Before you decide to relocate to Oregon, it’s important to research the exact cost of living around the state. And that’s what we’re going to help you do.
These are the places in Oregon that cost a pretty penny — the most expensive cities in the state.
We used Saturday Night Science to compare the 2020-2024 American Community Survey on cost of living for the 80 places in Oregon with more than 5,000 people.
After we saved up for months and could finally afford it, we landed on this list of the ten most expensive cities in Oregon for 2026.
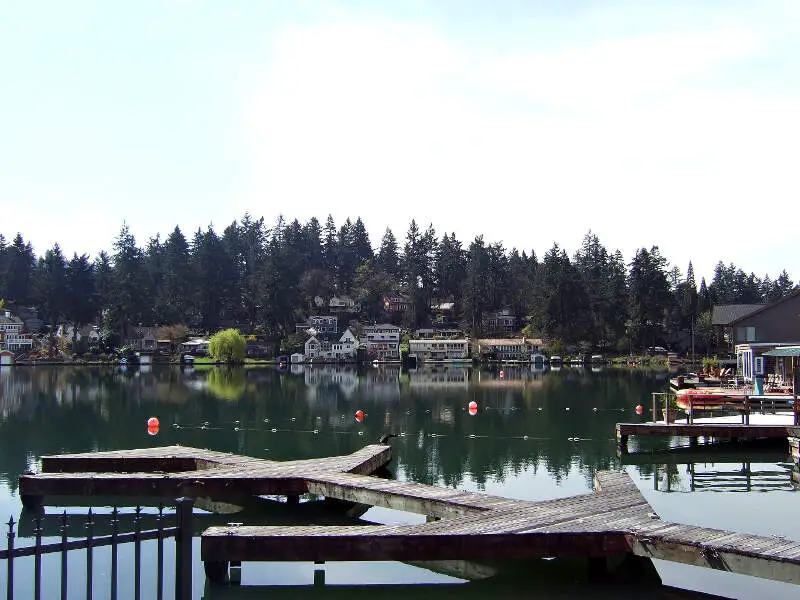
$141,549 median income · $882,925 median home · #1 home prices in Oregon
Lake Oswego is a city in the State of Oregon, primarily in Clackamas County with small portions extending into neighboring Multnomah and Washington counties. Located about 8 miles south of Portland and surrounding the 405-acre Oswego Lake, the town was founded in 1847 and incorporated as Oswego in 1910. The city was the hub of Oregon’s brief iron industry in the late 19th century and is today an affluent suburb of Portland. As of the 2010 census, the city had a total population of 36,619, a 3.8% increase over the 2000 population of 35,278.
Data | Crime | Cost of living | Movers
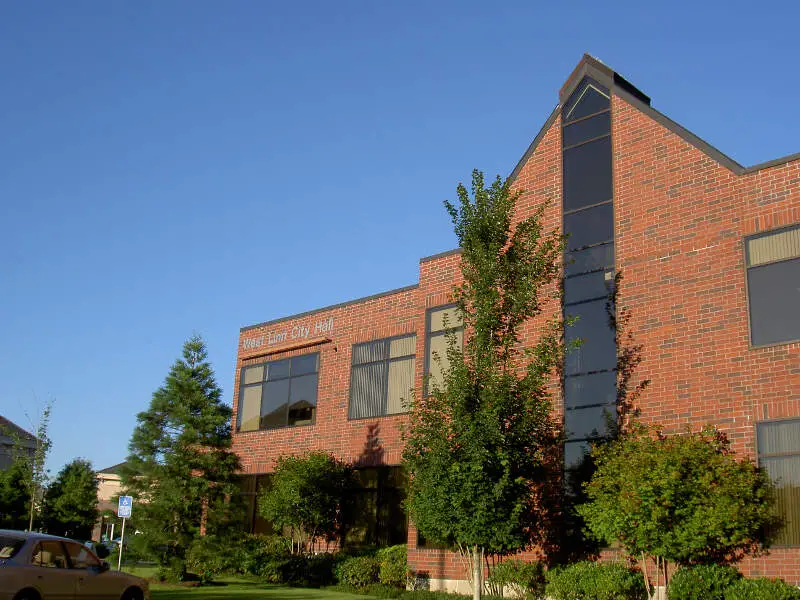
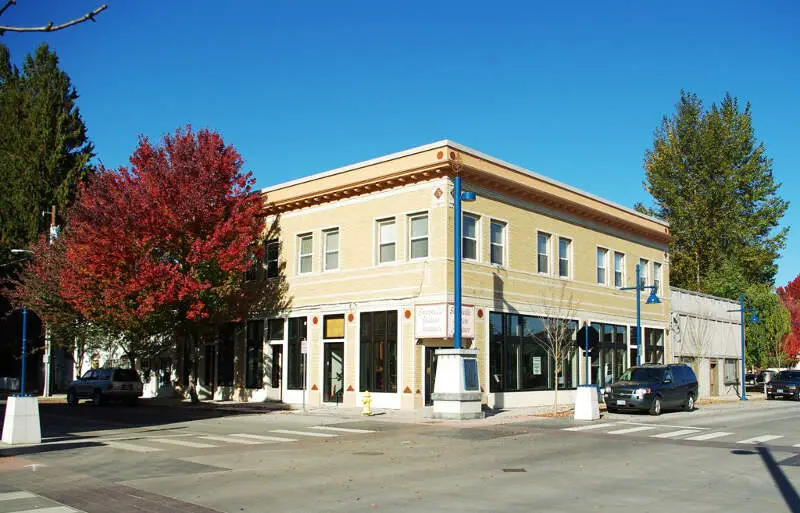
$146,507 median income · $777,229 median home · #2 home prices in Oregon
West Linn is a city in Clackamas County, Oregon, United States. Now a southern suburb within the Portland metropolitan area, West Linn has a history of early development, prompted by the opportunity to harvest energy from nearby Willamette Falls. It was named after U.S. Senator Lewis F. Linn of Ste. Genevieve, Missouri, who had advocated the American occupation of Oregon as a counterclaim to the British. As of the 2010 census, the city had a population of 25,109.
Data | Crime | Cost of living | Movers
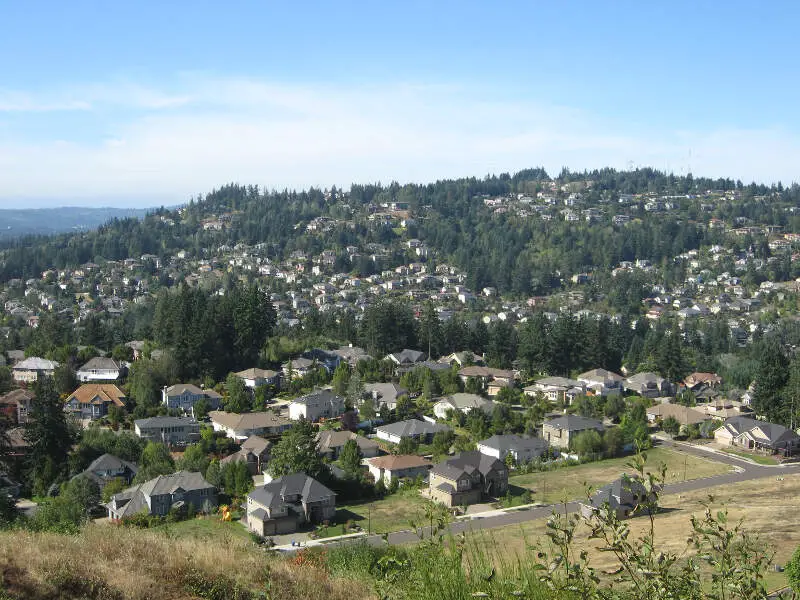
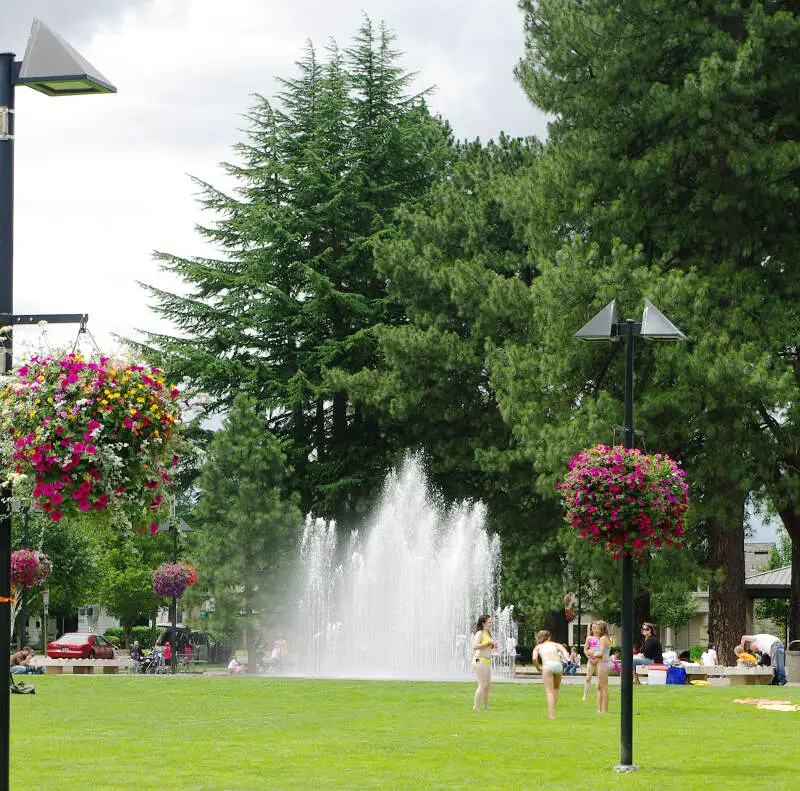
$122,151 median income · $681,241 median home · #5 home prices in Oregon
Happy Valley is a city in Clackamas County, Oregon, United States. The population was 13,903 at the 2010 census.
Data | Crime | Cost of living | Movers
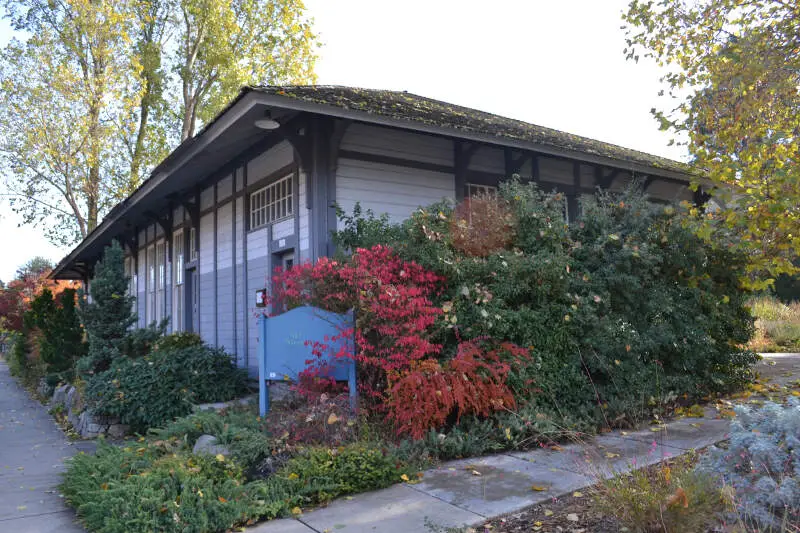
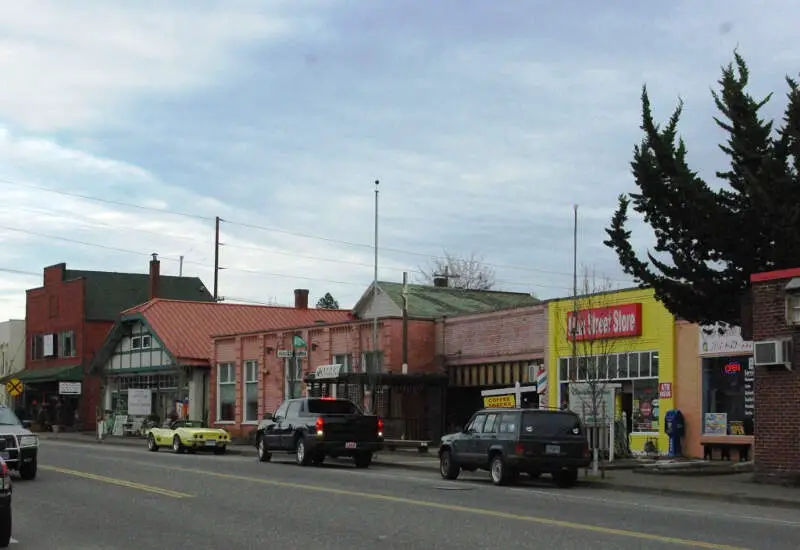
$68,028 median income · $551,385 median home · #13 home prices in Oregon
Ashland is a city in Jackson County, in the State of Oregon. It lies along Interstate 5 approximately 16 miles north of the California border and near the south end of the Rogue Valley. As of 2015, the city’s population was approaching 21,000.
Data | Crime | Cost of living | Movers
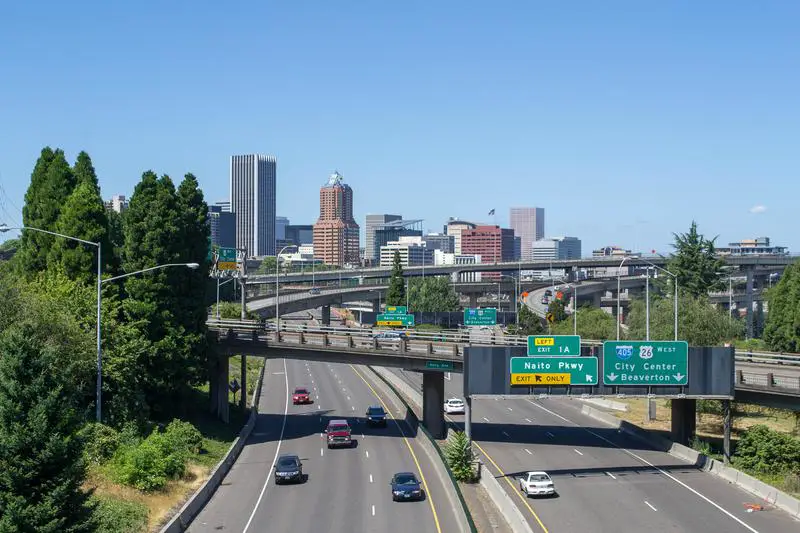
$90,919 median income · $534,638 median home · #16 home prices in Oregon
Portland is the largest city in the U.S. state of Oregon and the seat of Multnomah County. It is a major port in the Willamette Valley region of the Pacific Northwest, at the confluence of the Willamette and Columbia rivers. The city covers 145 square miles and had an estimated population of 639,863 in 2016, making it the 26th most populous city in the United States, and the second-most populous in the Pacific Northwest. Approximately 2,424,955 people live in the Portland metropolitan statistical area, making it the 25th most populous MSA in the United States. Its Combined Statistical Area ranks 18th with a population of 3,160,488. Roughly 60% of Oregon’s population resides within the Portland metropolitan area.
Data | Crime | Cost of living | Movers

$104,043 median income · $638,736 median home · #6 home prices in Oregon
Tualatin is a city located primarily in Washington County in the State of Oregon. A small portion of the city is also located in neighboring Clackamas County. It is a southwestern suburb in the Portland Metropolitan Area that is located south of Tigard. The population was 26,054 at the 2010 census.
Data | Crime | Cost of living | Movers
$109,966 median income · $633,005 median home · #8 home prices in Oregon
Sherwood is a city in Washington County, Oregon, United States. Located in the southeast corner of the county, it is a residential community in the Tualatin Valley, southwest of Portland. As of the 2010 census, Sherwood had a population of 18,194 residents. The city’s population for 2014 was estimated to be 18,978 by the U.S. Census. Sherwood was first incorporated in 1893 as a town. Originally named Smockville after its founder, James Christopher Smock, the town was given its current name by local businessman Robert Alexander in 1891, who likely named it after his hometown of Sherwood, Michigan.
Data | Crime | Cost of living | Movers
$98,622 median income · $530,795 median home · #17 home prices in Oregon
Beaverton is a city in Washington County, in the U.S. state of Oregon. The city center is 7 miles west of downtown Portland in the Tualatin River Valley. As of the 2010 census, the population is 89,803. This makes it the second-largest city in the county and Oregon’s sixth-largest city. Fire protection and EMS services are provided through Tualatin Valley Fire and Rescue.
Data | Crime | Cost of living | Movers
$108,823 median income · $608,407 median home · #9 home prices in Oregon
Tigard is a city in Washington County, Oregon, United States. The population was 48,035 at the 2010 census. As of 2007, Tigard was the state’s 12th largest city. Incorporated in 1961, the city is located south of Beaverton and north of Tualatin, and is part of the Portland metropolitan area. Interstate 5 and Oregon Route 217 are the main freeways in the city, with Oregon Route 99W and Oregon Route 210 serving as other major highways. Public transit service is provided by TriMet, via several bus routes and the WES Commuter Rail line.
Data | Crime | Cost of living | Movers
$96,236 median income · $635,208 median home · #7 home prices in Oregon
Wilsonville is a city primarily in Clackamas County, Oregon, United States. A portion of the northern section of the city is in Washington County. It was founded as Boones Landing because of the Boones Ferry which crossed the Willamette River at the location; the community became Wilsonville in 1880. The city was incorporated in 1969 with a population of approximately 1,000. The population was 13,991 at the 2000 census, and grew to 19,509 as of 2010. Slightly more than 90% of residents at the 2000 census were white, with Hispanics comprising the largest minority group.
Data | Crime | Cost of living | Movers
The receipts
Compare the top ten
Pick a metric. The bars rescale. The red line is Oregon’s statewide median.
Oregon statewide median: $499,004
Oregon statewide median: $83,011
On the map
Mapping the most expensive places in Oregon
Saturday Night Science
Methodology: How We Determined The Most Expensive Places To Live In The Beaver State For 2026
The two most important things to think about when it comes to being able to afford a city in Oregon are how much money you make and how much you have to spend to live there.
You need to understand your costs in the context of how much money you make.
For example, if the median household earns $100,000 and spends $40,000 on housing, it’s actually cheaper to live there than a place with a median income of $50,000 and housing costs of $21,000. You might spend more on housing, but you have more money overall to play with.
With that example in mind, we derived several statistics from the latest Census American Community Survey 2020-2024 around incomes and costs. They are:
- Overall Cost Of Living Index
- Median Home Price / Median Income (lower is better)
- Median Income / Median Rent (Higher is better)
- Median Home Price
You can then compare these metrics in each of the places in Oregon to figure out which is the most expensive.
You are left with a “Cost of Living Index” by taking the average rank of each of these metrics for each city.
So we used that cost of living index to rank all of the 80 places in Oregon that have more than 5,000 people.
The place with the highest cost of living in Oregon according to the data is Lake Oswego. We updated this article for 2026. This article is our eleventh time ranking the most expensive places to live in Oregon.
The full plate
Most Expensive Cities In Oregon
Click any column to sort. Search by city name.
| Rank | City | Cost Of Living | Population | Median Income | Average Home Price | Home/Income Ratio |
|---|---|---|---|---|---|---|
| 1 | Lake Oswego | 166 | 40,381 | $141,549 | $882,925 | 6.2x |
| 2 | West Linn | 153 | 26,935 | $146,507 | $777,229 | 5.3x |
| 3 | Happy Valley | 153 | 26,738 | $122,151 | $681,241 | 5.6x |
| 4 | Ashland | 141 | 21,259 | $68,028 | $551,385 | 8.1x |
| 5 | Portland | 139 | 641,165 | $90,919 | $534,638 | 5.9x |
| 6 | Tualatin | 139 | 27,763 | $104,043 | $638,736 | 6.1x |
| 7 | Sherwood | 138 | 20,307 | $109,966 | $633,005 | 5.8x |
| 8 | Beaverton | 136 | 97,812 | $98,622 | $530,795 | 5.4x |
| 9 | Tigard | 136 | 56,011 | $108,823 | $608,407 | 5.6x |
| 10 | Wilsonville | 134 | 26,974 | $96,236 | $635,208 | 6.6x |
| 11 | Hood River | 134 | 8,361 | $85,647 | $712,510 | 8.3x |
| 12 | Bend | 132 | 103,390 | $96,394 | $732,650 | 7.6x |
| 13 | Hillsboro | 128 | 108,231 | $106,409 | $522,557 | 4.9x |
| 14 | Corvallis | 128 | 59,960 | $65,012 | $555,988 | 8.6x |
| 15 | Oregon City | 128 | 37,755 | $97,829 | $603,704 | 6.2x |
| 16 | Troutdale | 128 | 15,923 | $89,337 | $492,004 | 5.5x |
| 17 | Canby | 127 | 18,134 | $100,989 | $590,607 | 5.8x |
| 18 | Gladstone | 127 | 11,977 | $91,250 | $517,793 | 5.7x |
| 19 | Estacada | 127 | 5,152 | $94,435 | $540,538 | 5.7x |
| 20 | Gresham | 126 | 112,378 | $77,795 | $471,181 | 6.1x |
| 21 | Newberg | 126 | 26,066 | $93,232 | $530,485 | 5.7x |
| 22 | Sandy | 125 | 12,854 | $108,984 | $523,760 | 4.8x |
| 23 | Forest Grove | 124 | 26,529 | $87,933 | $525,623 | 6.0x |
| 24 | Milwaukie | 124 | 21,392 | $86,892 | $519,433 | 6.0x |
| 25 | Scappoose | 124 | 8,179 | $97,708 | $489,282 | 5.0x |
| 26 | Brookings | 124 | 6,703 | $74,933 | $477,228 | 6.4x |
| 27 | Cornelius | 122 | 14,255 | $96,273 | $485,775 | 5.0x |
| 28 | Fairview | 122 | 10,735 | $70,107 | $479,771 | 6.8x |
| 29 | Molalla | 122 | 10,186 | $89,318 | $497,975 | 5.6x |
| 30 | Seaside | 122 | 7,192 | $47,361 | $465,276 | 9.8x |
| 31 | Eugene | 121 | 179,591 | $66,562 | $473,231 | 7.1x |
| 32 | Silverton | 120 | 10,456 | $79,960 | $546,989 | 6.8x |
| 33 | King City | 120 | 5,073 | $63,684 | $464,246 | 7.3x |
| 34 | Medford | 119 | 86,315 | $73,230 | $406,689 | 5.6x |
| 35 | Eagle Point | 119 | 9,839 | $84,126 | $470,636 | 5.6x |
| 36 | Keizer | 118 | 39,082 | $84,813 | $450,015 | 5.3x |
| 37 | Central Point | 118 | 19,216 | $86,058 | $418,192 | 4.9x |
| 38 | Astoria | 118 | 10,109 | $68,007 | $474,605 | 7.0x |
| 39 | Redmond | 117 | 36,092 | $84,164 | $514,637 | 6.1x |
| 40 | Warrenton | 117 | 6,327 | $70,670 | $498,702 | 7.1x |
| 41 | Philomath | 117 | 5,642 | $83,672 | $518,378 | 6.2x |
| 42 | Salem | 116 | 178,865 | $75,487 | $436,318 | 5.8x |
| 43 | Monmouth | 116 | 11,428 | $69,170 | $473,961 | 6.9x |
| 44 | Newport | 116 | 10,583 | $60,568 | $445,961 | 7.4x |
| 45 | Florence | 116 | 9,482 | $53,333 | $435,248 | 8.2x |
| 46 | McMinnville | 115 | 34,596 | $73,736 | $484,842 | 6.6x |
| 47 | Stayton | 115 | 8,292 | $78,268 | $463,064 | 5.9x |
| 48 | St. Helens | 114 | 14,258 | $82,865 | $425,040 | 5.1x |
| 49 | Talent | 114 | 6,254 | $62,543 | $430,818 | 6.9x |
| 50 | Grants Pass | 113 | 39,311 | $59,646 | $398,231 | 6.7x |
| 51 | Creswell | 113 | 5,621 | $100,385 | $468,604 | 4.7x |
| 52 | Albany | 112 | 56,839 | $78,114 | $435,935 | 5.6x |
| 53 | Junction City | 112 | 6,947 | $85,595 | $478,165 | 5.6x |
| 54 | Springfield | 111 | 61,499 | $68,761 | $414,618 | 6.0x |
| 55 | Woodburn | 111 | 27,875 | $67,347 | $425,248 | 6.3x |
| 56 | Dallas | 111 | 17,531 | $71,549 | $474,062 | 6.6x |
| 57 | Independence | 111 | 10,199 | $85,375 | $425,946 | 5.0x |
| 58 | Lincoln City | 111 | 9,968 | $56,635 | $491,268 | 8.7x |
| 59 | Veneta | 110 | 5,200 | $66,890 | $435,477 | 6.5x |
| 60 | The Dalles | 109 | 15,917 | $62,614 | $389,438 | 6.2x |
| 61 | Coos Bay | 108 | 15,925 | $56,524 | $323,165 | 5.7x |
| 62 | North Bend | 108 | 10,171 | $81,320 | $355,605 | 4.4x |
| 63 | Sheridan | 107 | 6,339 | $70,785 | $402,546 | 5.7x |
| 64 | Hermiston | 106 | 19,546 | $66,998 | $339,211 | 5.1x |
| 65 | Prineville | 106 | 11,470 | $72,980 | $425,759 | 5.8x |
| 66 | Cottage Grove | 106 | 10,698 | $80,875 | $395,746 | 4.9x |
| 67 | Roseburg | 105 | 23,778 | $53,918 | $361,701 | 6.7x |
| 68 | Sutherlin | 105 | 8,599 | $51,250 | $345,332 | 6.7x |
| 69 | Tillamook | 105 | 5,218 | $58,176 | $459,171 | 7.9x |
| 70 | Klamath Falls | 104 | 22,115 | $46,693 | $308,371 | 6.6x |
| 71 | Winston | 104 | 5,690 | $56,667 | $313,139 | 5.5x |
| 72 | Lebanon | 103 | 19,344 | $63,176 | $391,198 | 6.2x |
| 73 | Pendleton | 103 | 16,950 | $66,563 | $295,556 | 4.4x |
| 74 | La Grande | 103 | 13,058 | $58,427 | $298,760 | 5.1x |
| 75 | Umatilla | 103 | 7,508 | $68,826 | $291,018 | 4.2x |
| 76 | Sweet Home | 102 | 10,078 | $56,927 | $350,175 | 6.2x |
| 77 | Madras | 102 | 7,676 | $64,659 | $358,034 | 5.5x |
| 78 | Baker City | 100 | 10,210 | $61,580 | $264,325 | 4.3x |
| 79 | Milton-Freewater | 97 | 7,036 | $52,183 | $250,756 | 4.8x |
| 80 | Ontario | 91 | 11,842 | $46,308 | $305,608 | 6.6x |
Source: U.S. Census ACS 2020-2024, Zillow research. 80 places with more than 5,000 residents.
Summary
Summary: Taking A Chunk Out Of Your Paycheck In Oregon For 2026
Well, there you have it, the places in Oregon that have the highest cost of living, with Lake Oswego ranking as the most expensive city in the Beaver State.
The most expensive cities in Oregon are Lake Oswego, West Linn, Happy Valley, Ashland, Portland, Tualatin, Sherwood, Beaverton, Tigard, and Wilsonville.


