
Before you decide to relocate to Tennessee, it’s important to research the exact cost of living around the state. And that’s what we’re going to help you do.
These are the places in Tennessee that cost a pretty penny — the most expensive cities in the state.
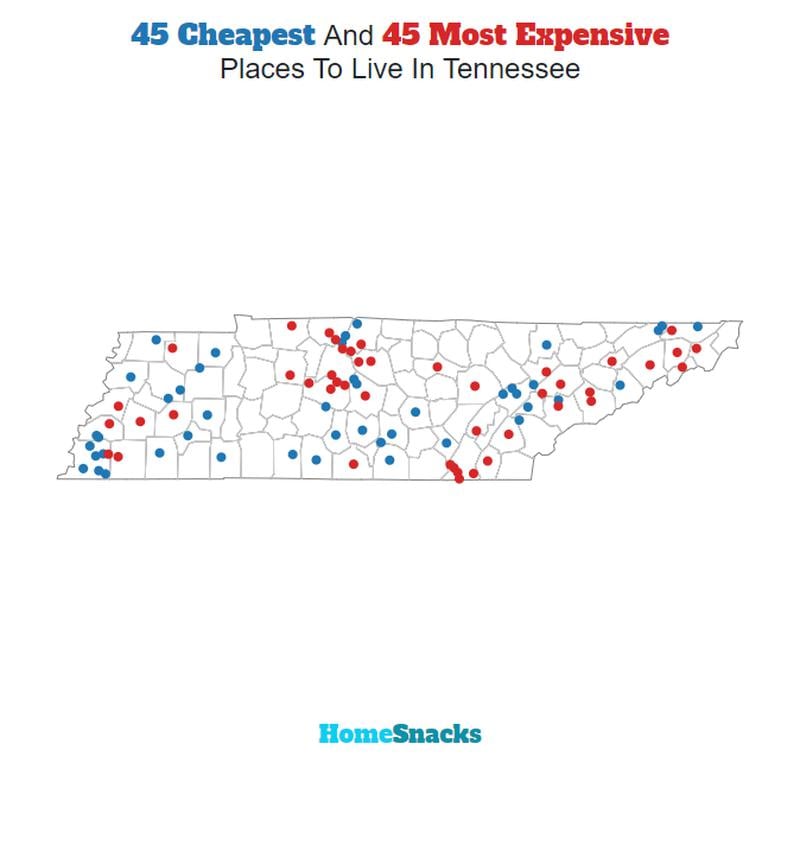
We used Saturday Night Science to compare the 2020-2024 American Community Survey on cost of living for the 100 places in Tennessee with more than 5,000 people.
After we saved up for months and could finally afford it, we landed on this list of the ten most expensive cities in Tennessee for 2026.
Table Of Contents: Top Ten | Methodology | Summary | Table
The 10 Most Expensive Places To Live In Tennessee For 2026
What’s the most expensive place to live in Tennessee? Well, HomeSnacks crunched the numbers and discovered that Brentwood is the most expensive place to live in Tennessee.
Dayton (the cheapest place to live in Tennessee) can show these guys how to live on a budget in the coming years. Read on for how these places had costs rise faster than inflation.
And if you already knew these places were expensive, check out some more reading about Tennessee and the most expensive cities in the country:
The 10 Most Expensive Places To Live In Tennessee For 2026

/10
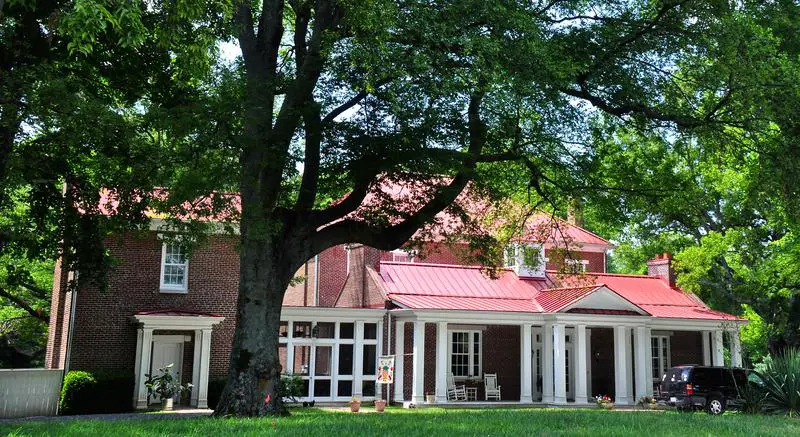
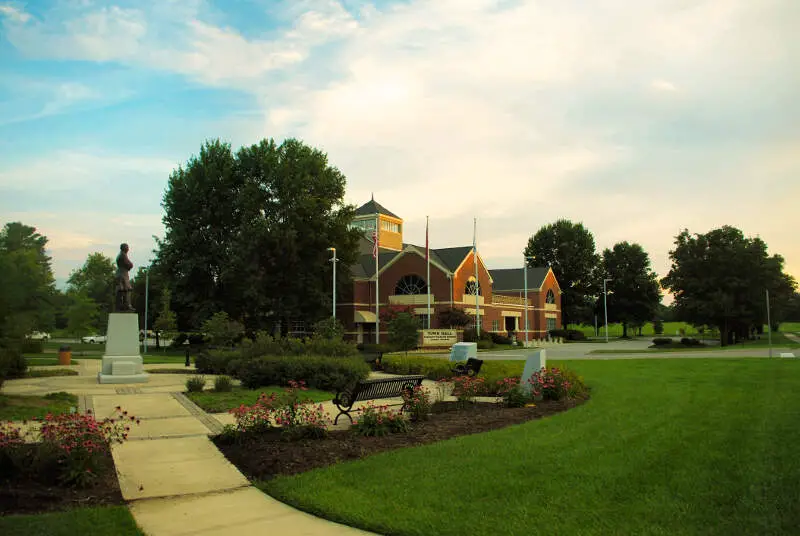
Population: 45,556
Cost Of Living Index: 164
Median Income: $182,088
Average Home Price: $1,393,273
Home Price To Income Ratio: 7.7x
More on Brentwood: Data | Crime | Cost Of Living | Movers
The overall cost of living in Brentwood is 164. The median income in Brentwood comes in at $182,088 and the average home value is $1,393,273 for 2026.

/10
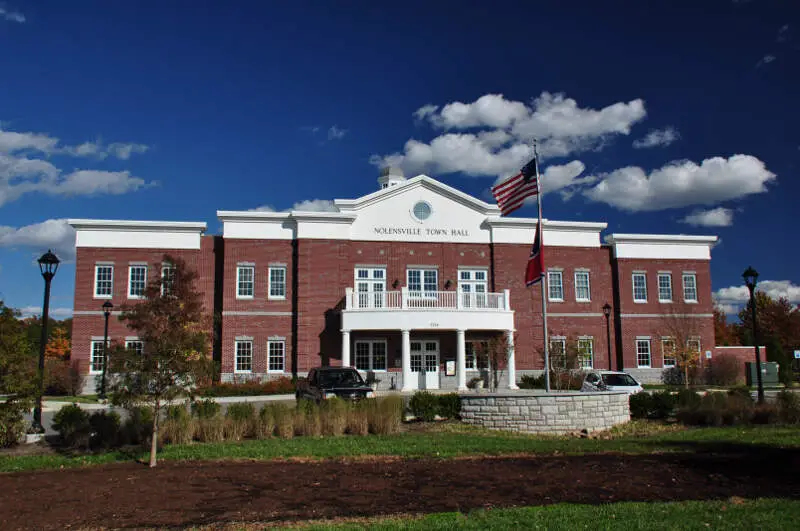
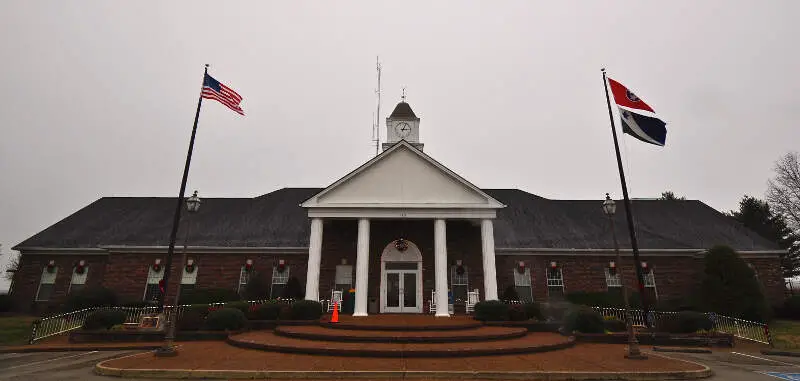
Population: 15,074
Cost Of Living Index: 144
Median Income: $177,148
Average Home Price: $836,735
Home Price To Income Ratio: 4.7x
More on Nolensville: Data | Crime | Cost Of Living | Movers
The overall cost of living in Nolensville is 144. The median income in Nolensville comes in at $177,148 and the average home value is $836,735 for 2026.
/10
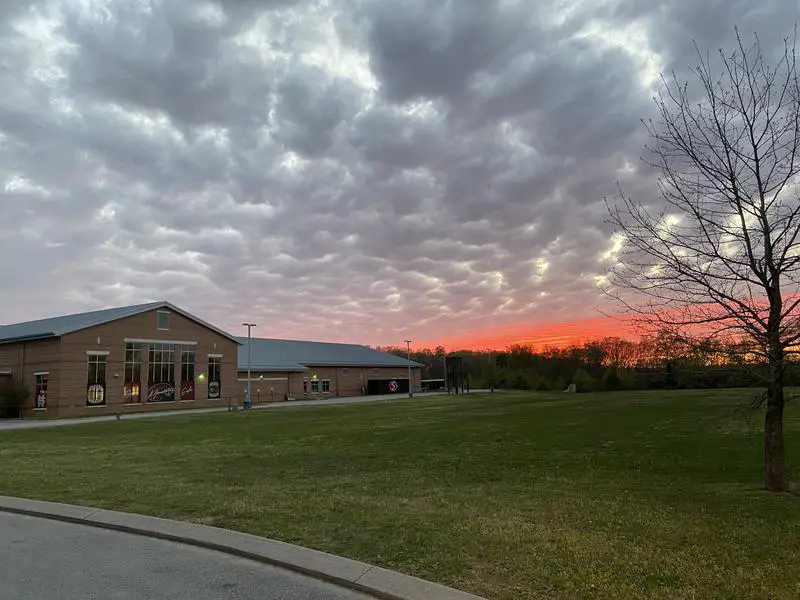
Population: 8,294
Cost Of Living Index: 136
Median Income: $132,647
Average Home Price: $815,216
Home Price To Income Ratio: 6.1x
More on Thompson’s Station: Data | Cost Of Living | Movers
The overall cost of living in Thompson’s Station is 136. The median income in Thompson’s Station comes in at $132,647 and the average home value is $815,216 for 2026.

/10
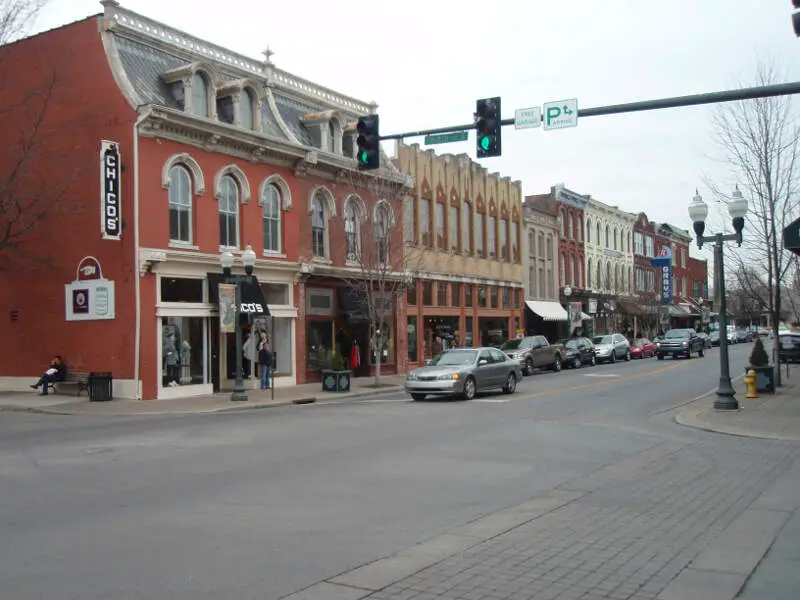
Population: 87,133
Cost Of Living Index: 134
Median Income: $119,528
Average Home Price: $922,855
Home Price To Income Ratio: 7.7x
More on Franklin: Data | Crime | Cost Of Living | Movers
The overall cost of living in Franklin is 134. The median income in Franklin comes in at $119,528 and the average home value is $922,855 for 2026.

/10
Population: 8,860
Cost Of Living Index: 125
Median Income: $141,008
Average Home Price: $623,274
Home Price To Income Ratio: 4.4x
More on Signal Mountain: Data | Crime | Cost Of Living | Movers
The overall cost of living in Signal Mountain is 125. The median income in Signal Mountain comes in at $141,008 and the average home value is $623,274 for 2026.

/10
Population: 24,634
Cost Of Living Index: 123
Median Income: $142,093
Average Home Price: $688,600
Home Price To Income Ratio: 4.8x
More on Farragut: Data | Cost Of Living | Movers
The overall cost of living in Farragut is 123. The median income in Farragut comes in at $142,093 and the average home value is $688,600 for 2026.

/10
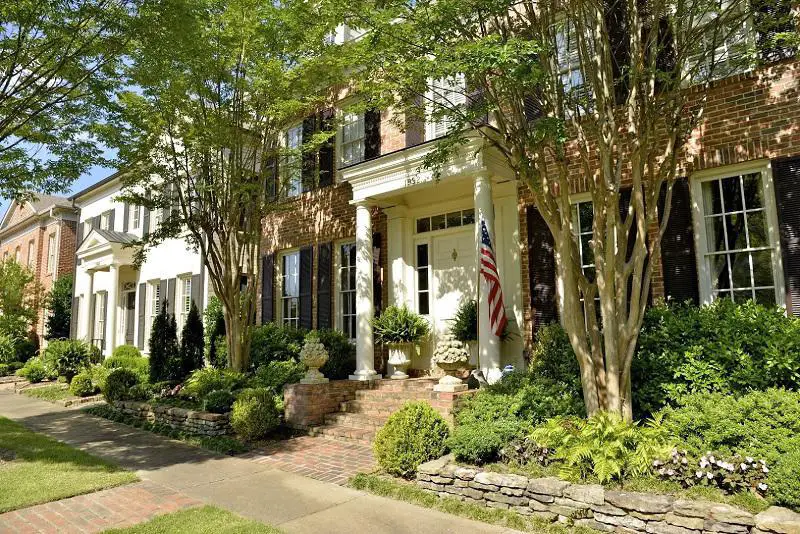
Population: 40,673
Cost Of Living Index: 121
Median Income: $149,920
Average Home Price: $485,879
Home Price To Income Ratio: 3.2x
More on Germantown: Data | Crime | Cost Of Living | Movers
The overall cost of living in Germantown is 121. The median income in Germantown comes in at $149,920 and the average home value is $485,879 for 2026.

/10
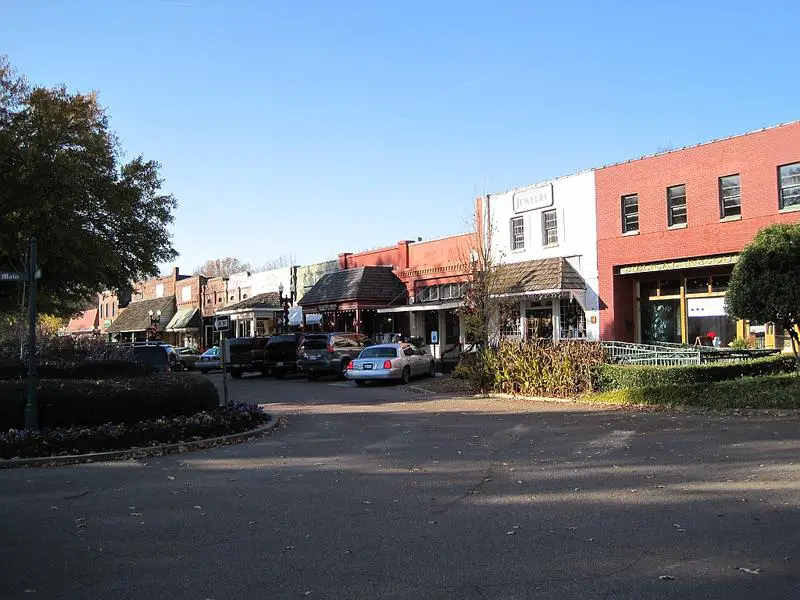
Population: 51,515
Cost Of Living Index: 118
Median Income: $138,598
Average Home Price: $509,893
Home Price To Income Ratio: 3.7x
More on Collierville: Data | Crime | Cost Of Living | Movers
The overall cost of living in Collierville is 118. The median income in Collierville comes in at $138,598 and the average home value is $509,893 for 2026.

/10
Population: 55,765
Cost Of Living Index: 117
Median Income: $112,013
Average Home Price: $523,264
Home Price To Income Ratio: 4.7x
More on Spring Hill: Data | Crime | Cost Of Living | Movers
The overall cost of living in Spring Hill is 117. The median income in Spring Hill comes in at $112,013 and the average home value is $523,264 for 2026.

/10
Population: 15,205
Cost Of Living Index: 115
Median Income: $135,105
Average Home Price: $409,249
Home Price To Income Ratio: 3.0x
More on Arlington: Data | Cost Of Living | Movers
The overall cost of living in Arlington is 115. The median income in Arlington comes in at $135,105 and the average home value is $409,249 for 2026.
Methodology: How We Determined The Most Expensive Places To Live In The Volunteer State For 2026
The two most important things to think about when it comes to being able to afford a city in Tennessee are:
- How much money do I make?
- How much do I have to spend to live there?
You need to understand your costs in the context of how much money you make.
For example, if the median household earns $100,000 and spends $40,000 on housing, it’s actually cheaper to live there than a place with a median income of $50,000 and housing costs of $21,000. You might spend more on housing, but you have more money overall to play with.
With that example in mind, we derived several statistics from the latest Census American Community Survey 2020-2024 around incomes and costs. They are:
- Overall Cost Of Living Index
- Median Home Price / Median Income (lower is better)
- Median Income / Median Rent (Higher is better)
- Median Home Price
You can then compare these metrics in each of the places in Tennessee to figure out which is the most expensive.
You are left with a “Cost of Living Index” by taking the average rank of each of these metrics for each city.
So we used that cost of living index to rank all of the 100 places in Tennessee that have more than 5,000 people.
The place with the highest cost of living in Tennessee according to the data is Brentwood. We updated this article for 2026. This article is our eleventh time ranking the most expensive places to live in Tennessee.
Summary: Taking A Chunk Out Of Your Paycheck In Tennessee For 2026
Well, there you have it, the places in Tennessee that have the highest cost of living, with Brentwood ranking as the most expensive city in the Volunteer State.
The most expensive cities in Tennessee are Brentwood, Nolensville, Thompson’s Station, Franklin, Signal Mountain, Farragut, Germantown, Collierville, Spring Hill, and Arlington.
Here’s a look at the most affordable cities in Tennessee according to the data:
- Dayton
- Brownsville
- Henderson
For more Tennessee reading, check out:
- Best Places To Live In Tennessee
- Cheapest Places To Live In Tennessee
- Most Dangerous Cities In Tennessee
- Best Places To Raise A Family In Tennessee
- Safest Places In Tennessee
- Worst Places To Live In Tennessee
Most Expensive Cities In Tennessee
| Rank | City | Cost Of Living | Population | Median Income | Average Home Price | Home/Income Ratio |
|---|---|---|---|---|---|---|
| 1 | Brentwood | 164 | 45,556 | $182,088 | $1,393,273 | 7.7x |
| 2 | Nolensville | 144 | 15,074 | $177,148 | $836,735 | 4.7x |
| 3 | Thompson’s Station | 136 | 8,294 | $132,647 | $815,216 | 6.1x |
| 4 | Franklin | 134 | 87,133 | $119,528 | $922,855 | 7.7x |
| 5 | Signal Mountain | 125 | 8,860 | $141,008 | $623,274 | 4.4x |
| 6 | Farragut | 123 | 24,634 | $142,093 | $688,600 | 4.8x |
| 7 | Germantown | 121 | 40,673 | $149,920 | $485,879 | 3.2x |
| 8 | Collierville | 118 | 51,515 | $138,598 | $509,893 | 3.7x |
| 9 | Spring Hill | 117 | 55,765 | $112,013 | $523,264 | 4.7x |
| 10 | Arlington | 115 | 15,205 | $135,105 | $409,249 | 3.0x |
| 11 | Mount Juliet | 114 | 42,073 | $107,068 | $562,744 | 5.3x |
| 12 | Lakeland | 113 | 14,192 | $116,250 | $445,695 | 3.8x |
| 13 | Hendersonville | 111 | 63,091 | $97,200 | $521,094 | 5.4x |
| 14 | Lebanon | 111 | 44,788 | $72,848 | $443,605 | 6.1x |
| 15 | Murfreesboro | 109 | 161,445 | $80,108 | $426,291 | 5.3x |
| 16 | Fairview | 109 | 10,009 | $91,131 | $560,109 | 6.1x |
| 17 | Goodlettsville | 107 | 17,597 | $70,758 | $389,925 | 5.5x |
| 18 | White House | 106 | 14,631 | $90,019 | $388,292 | 4.3x |
| 19 | Pleasant View | 106 | 5,276 | $109,213 | $416,777 | 3.8x |
| 20 | Gallatin | 105 | 48,532 | $77,518 | $435,263 | 5.6x |
| 21 | Smyrna | 104 | 56,692 | $81,926 | $403,723 | 4.9x |
| 22 | Collegedale | 103 | 11,330 | $70,246 | $418,364 | 6.0x |
| 23 | Atoka | 103 | 10,385 | $89,663 | $350,767 | 3.9x |
| 24 | Oakland | 103 | 9,979 | $97,798 | $353,491 | 3.6x |
| 25 | Greenbrier | 103 | 6,971 | $85,174 | $382,696 | 4.5x |
| 26 | Bartlett | 102 | 56,876 | $102,070 | $321,266 | 3.1x |
| 27 | Munford | 102 | 6,588 | $89,531 | $287,684 | 3.2x |
| 28 | Millersville | 102 | 5,836 | $71,789 | $360,650 | 5.0x |
| 29 | Maryville | 101 | 32,392 | $81,963 | $390,045 | 4.8x |
| 30 | La Vergne | 100 | 40,243 | $81,313 | $346,621 | 4.3x |
| 31 | Sevierville | 100 | 18,397 | $52,421 | $417,023 | 8.0x |
| 32 | Chattanooga | 99 | 185,783 | $64,523 | $319,578 | 5.0x |
| 33 | Clarksville | 97 | 176,456 | $69,303 | $318,205 | 4.6x |
| 34 | Johnson City | 97 | 72,222 | $57,254 | $292,484 | 5.1x |
| 35 | Ashland City | 97 | 5,424 | $79,231 | $349,646 | 4.4x |
| 36 | Medina | 97 | 5,407 | $107,807 | $320,514 | 3.0x |
| 37 | Pigeon Forge | 96 | 6,375 | $53,261 | $423,693 | 8.0x |
| 38 | Jonesborough | 96 | 6,232 | $74,015 | $334,164 | 4.5x |
| 39 | Cookeville | 95 | 36,088 | $51,375 | $320,761 | 6.2x |
| 40 | Oak Ridge | 95 | 32,693 | $72,311 | $322,989 | 4.5x |
| 41 | Dickson | 95 | 16,424 | $69,678 | $344,966 | 5.0x |
| 42 | Soddy-Daisy | 95 | 13,231 | $75,113 | $359,449 | 4.8x |
| 43 | Kingston | 95 | 6,224 | $71,675 | $329,855 | 4.6x |
| 44 | Cleveland | 94 | 48,829 | $58,559 | $311,237 | 5.3x |
| 45 | Columbia | 94 | 45,441 | $63,719 | $374,475 | 5.9x |
| 46 | Shelbyville | 94 | 24,661 | $55,073 | $313,350 | 5.7x |
| 47 | Springfield | 94 | 19,255 | $59,465 | $331,463 | 5.6x |
| 48 | Athens | 94 | 14,471 | $53,929 | $260,344 | 4.8x |
| 49 | Crossville | 94 | 12,428 | $48,802 | $304,996 | 6.2x |
| 50 | Clinton | 94 | 10,239 | $68,882 | $332,660 | 4.8x |
| 51 | Mount Carmel | 94 | 5,472 | $68,866 | $262,491 | 3.8x |
| 52 | Memphis | 93 | 618,980 | $51,736 | $144,710 | 2.8x |
| 53 | Kingsport | 93 | 56,262 | $52,490 | $254,341 | 4.8x |
| 54 | Bristol | 93 | 27,636 | $58,162 | $234,603 | 4.0x |
| 55 | Tullahoma | 93 | 21,103 | $60,979 | $293,828 | 4.8x |
| 56 | Portland | 93 | 13,449 | $72,647 | $332,793 | 4.6x |
| 57 | Manchester | 93 | 12,944 | $57,500 | $325,769 | 5.7x |
| 58 | Alcoa | 93 | 12,222 | $65,714 | $314,717 | 4.8x |
| 59 | Red Bank | 93 | 12,010 | $63,983 | $307,145 | 4.8x |
| 60 | Lenoir City | 93 | 11,110 | $67,259 | $411,983 | 6.1x |
| 61 | Jackson | 92 | 68,435 | $53,032 | $227,077 | 4.3x |
| 62 | East Ridge | 92 | 22,070 | $62,247 | $257,872 | 4.1x |
| 63 | Greeneville | 92 | 15,646 | $49,889 | $248,040 | 5.0x |
| 64 | Winchester | 92 | 9,799 | $62,782 | $359,609 | 5.7x |
| 65 | Knoxville | 91 | 195,185 | $54,039 | $369,216 | 6.8x |
| 66 | Morristown | 91 | 31,527 | $47,917 | $266,072 | 5.6x |
| 67 | Jefferson City | 91 | 8,579 | $60,638 | $304,011 | 5.0x |
| 68 | Church Hill | 91 | 7,139 | $65,526 | $261,208 | 4.0x |
| 69 | Lafayette | 91 | 5,727 | $51,736 | $269,410 | 5.2x |
| 70 | Lewisburg | 90 | 12,861 | $48,341 | $299,243 | 6.2x |
| 71 | Millington | 90 | 11,289 | $49,979 | $238,392 | 4.8x |
| 72 | Covington | 90 | 8,587 | $42,254 | $208,118 | 4.9x |
| 73 | Smithville | 90 | 5,288 | $33,192 | $285,424 | 8.6x |
| 74 | Dyersburg | 89 | 15,979 | $52,064 | $165,486 | 3.2x |
| 75 | Elizabethton | 89 | 14,374 | $46,975 | $229,441 | 4.9x |
| 76 | Fayetteville | 89 | 7,057 | $49,223 | $254,902 | 5.2x |
| 77 | Martin | 88 | 10,915 | $43,381 | $214,360 | 4.9x |
| 78 | Paris | 88 | 10,338 | $41,012 | $213,853 | 5.2x |
| 79 | Pulaski | 88 | 8,285 | $48,538 | $250,196 | 5.2x |
| 80 | Dunlap | 88 | 5,678 | $45,589 | $273,218 | 6.0x |
| 81 | Madisonville | 88 | 5,241 | $39,878 | $286,953 | 7.2x |
| 82 | Milan | 87 | 8,244 | $43,886 | $181,685 | 4.1x |
| 83 | Lexington | 87 | 7,962 | $49,057 | $216,845 | 4.4x |
| 84 | Savannah | 87 | 7,412 | $39,712 | $196,053 | 4.9x |
| 85 | Newport | 87 | 6,881 | $31,250 | $227,026 | 7.3x |
| 86 | Sweetwater | 87 | 6,532 | $45,451 | $256,822 | 5.7x |
| 87 | Erwin | 87 | 5,988 | $47,487 | $223,110 | 4.7x |
| 88 | McKenzie | 87 | 5,631 | $37,236 | $189,717 | 5.1x |
| 89 | Bolivar | 87 | 5,144 | $39,028 | $147,014 | 3.8x |
| 90 | McMinnville | 85 | 13,844 | $47,179 | $255,402 | 5.4x |
| 91 | Lawrenceburg | 85 | 11,844 | $42,343 | $240,471 | 5.7x |
| 92 | Union City | 85 | 10,982 | $50,870 | $167,472 | 3.3x |
| 93 | La Follette | 85 | 7,273 | $37,581 | $161,646 | 4.3x |
| 94 | Harriman | 85 | 6,090 | $44,653 | $239,088 | 5.4x |
| 95 | Rockwood | 85 | 5,566 | $47,791 | $230,191 | 4.8x |
| 96 | Humboldt | 84 | 7,787 | $52,917 | $155,460 | 2.9x |
| 97 | Ripley | 84 | 7,658 | $37,432 | $140,000 | 3.7x |
| 98 | Henderson | 84 | 6,411 | $45,938 | $177,751 | 3.9x |
| 99 | Brownsville | 83 | 9,622 | $43,494 | $163,990 | 3.8x |
| 100 | Dayton | 83 | 7,625 | $49,719 | $264,804 | 5.3x |