Most Hispanic/Latino cities in North Carolina research summary. We used Saturday Night Science to analyze North Carolina’s most recent Census data to determine the most Hispanic/Latino cities based on the percentage of Hispanic/Latino residents.
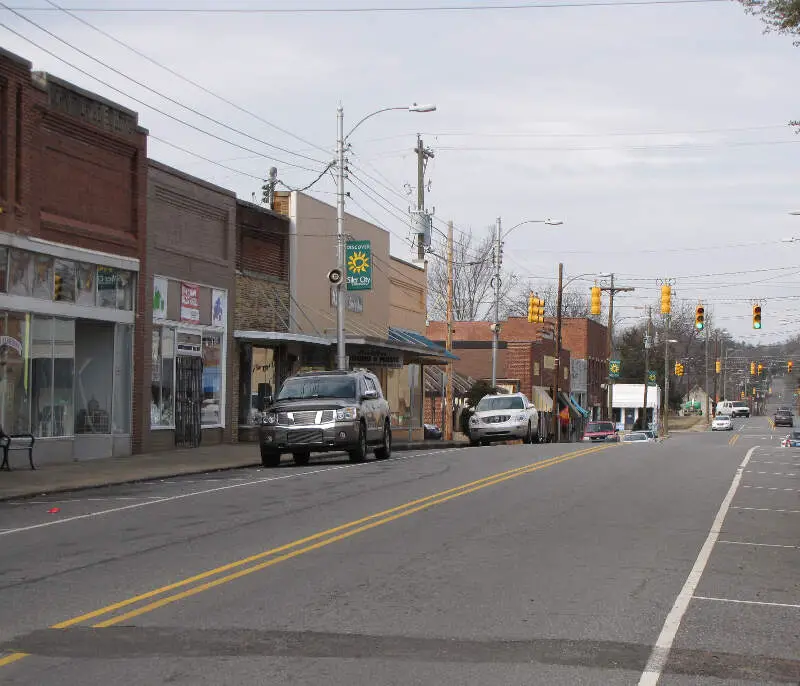
53.3% Hispanic · #1 most Hispanic in North Carolina
Siler City is a town in Chatham County, North Carolina, United States. As of the 2010 census, the town’s population was 7,887. The population was estimated to be 8,169 in 2013.
Data | Crime | Cost of living | Movers
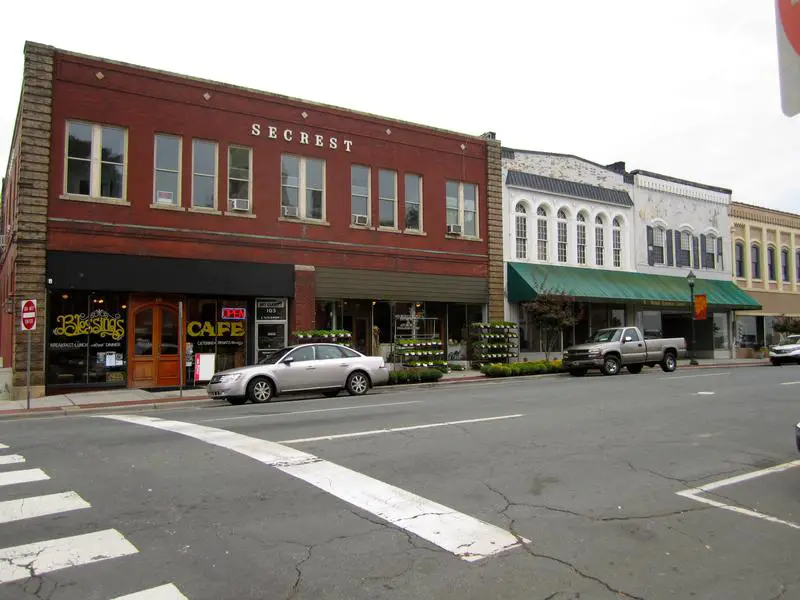
30.9% Hispanic · #2 most Hispanic in North Carolina
Monroe is a city in and the county seat of Union County, North Carolina, United States. The population increased from 26,228 in 2000 to 32,797 in 2010. It is within the rapidly growing Charlotte-Gastonia-Rock Hill, NC-SC Metropolitan area. Monroe has a council-manager form of government.
Data | Crime | Cost of living | Movers

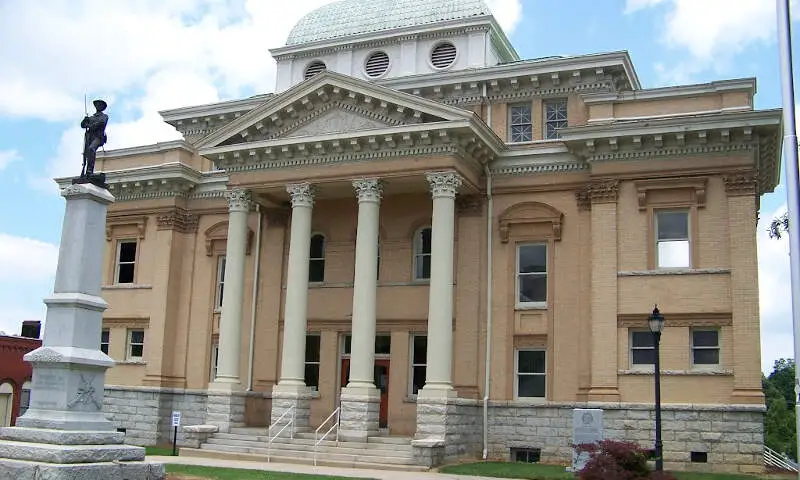
30.0% Hispanic · #3 most Hispanic in North Carolina
Sanford is a city in Lee County, North Carolina, United States. The population was 28,518 at the 2010 census. It is the county seat of Lee County.
Data | Crime | Cost of living | Movers
27.6% Hispanic · #4 most Hispanic in North Carolina
Data | Crime | Cost of living | Movers
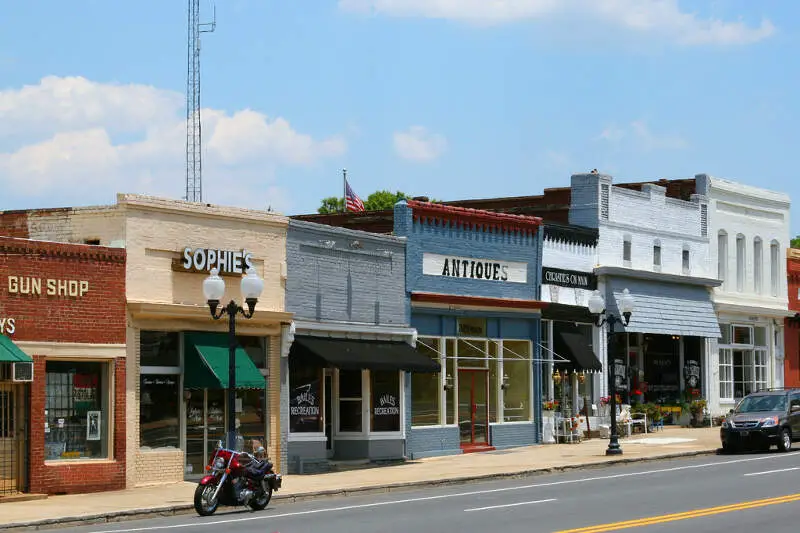
27.6% Hispanic · #5 most Hispanic in North Carolina
Pineville is a suburban town in the southernmost portion of Mecklenburg County, North Carolina situated in the Waxhaws district between Charlotte, North Carolina and Fort Mill, South Carolina.
Data | Crime | Cost of living | Movers
24.9% Hispanic · #6 most Hispanic in North Carolina
Data | Crime | Cost of living | Movers
24.4% Hispanic · #7 most Hispanic in North Carolina
Wendell is a town in Wake County, North Carolina United States. It is a satellite town of Raleigh, the state capital. The population was 5,845 at the 2010 census.
Data | Crime | Cost of living | Movers
24.1% Hispanic · #8 most Hispanic in North Carolina
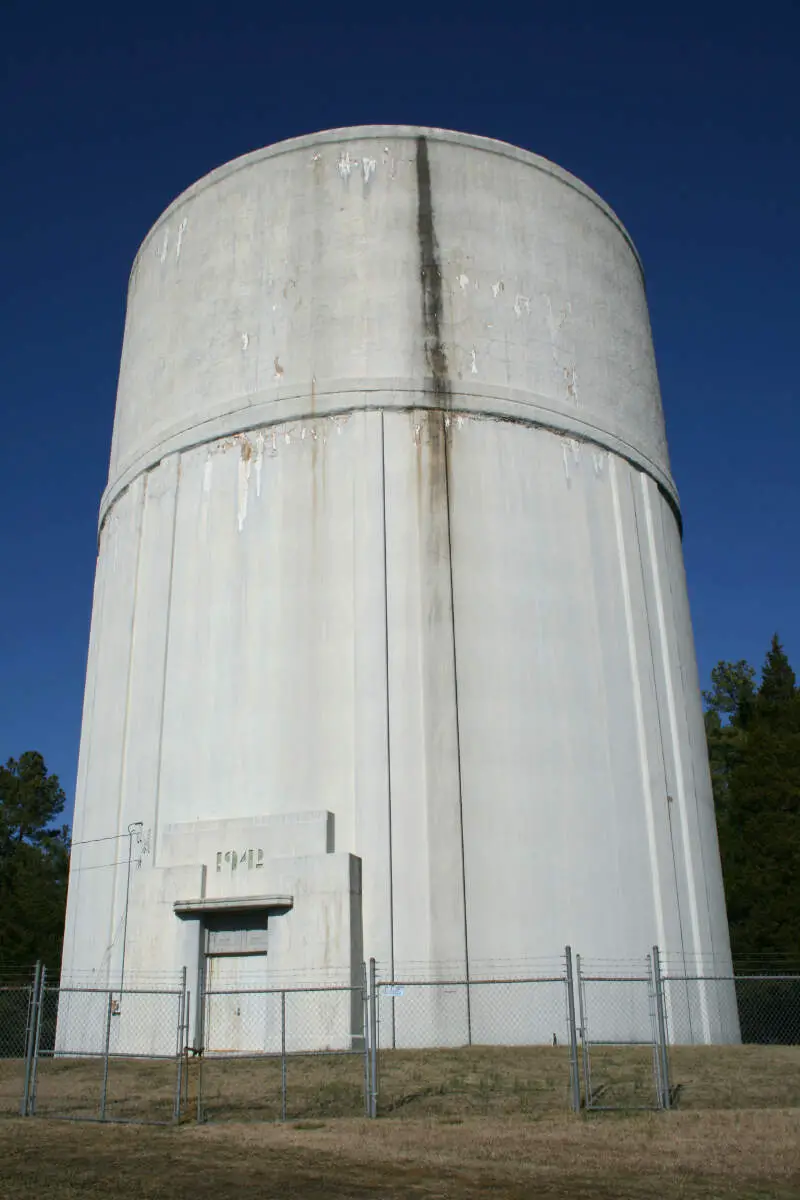
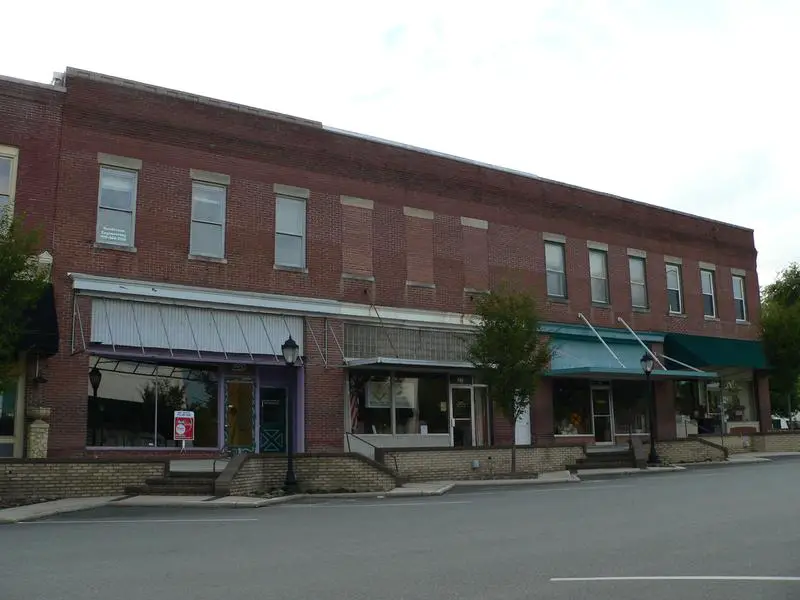
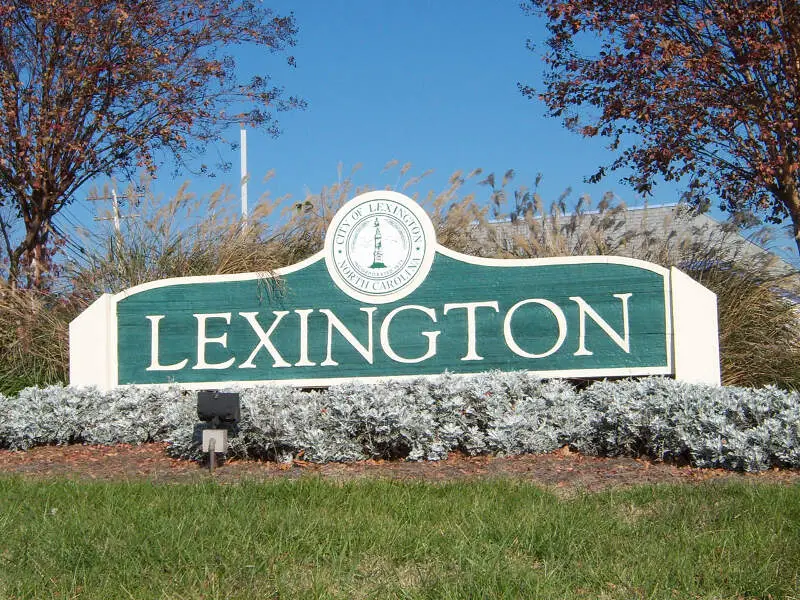
Lexington is the county seat of Davidson County, North Carolina, United States. As of the 2010 census, the city had a population of 18,931. It is located in central North Carolina, 20 miles south of Winston-Salem. Major highways include I-85, I-85B, U.S. Route 29, U.S. Route 70, U.S. Route 52 and U.S. Route 64. Lexington is part of the Piedmont Triad region of the state.
Data | Crime | Cost of living | Movers
23.3% Hispanic · #9 most Hispanic in North Carolina
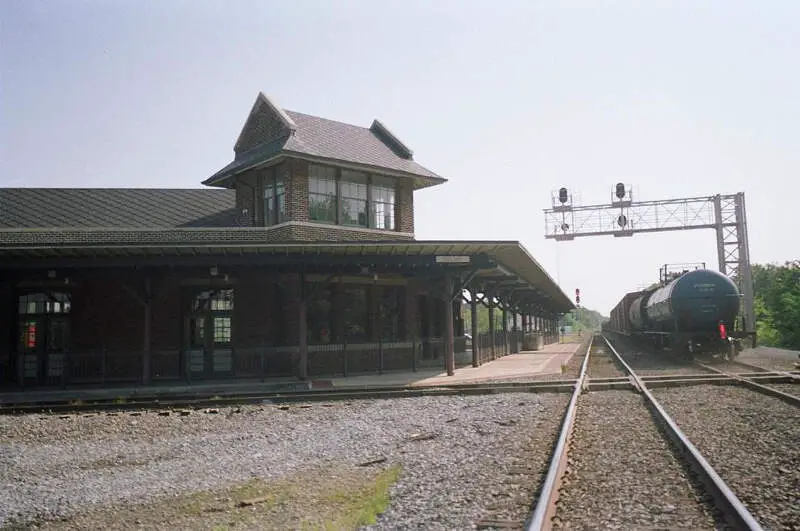
Selma is a town in Johnston County, North Carolina, United States. In 2010, the population was 6,073. Selma is part of the Raleigh-Durham-Cary Combined Statistical Area, and the Raleigh-Cary Metropolitan Statistical Area. The area has a population over 1.7 million residents, though the town of Selma is able to maintain its rural character. The Everitt P. Stevens House, located in Selma, was the site of the last Grand Review of the Confederate Army held on April 6, 1865, after its defeat at the Battle of Bentonville.
Data | Crime | Cost of living | Movers
22.6% Hispanic · #10 most Hispanic in North Carolina
Morganton is a city in Burke County, North Carolina, United States. The population was 16,918 at the 2010 census. Morganton is the county seat.
Data | Crime | Cost of living | Movers
The receipts
Compare the top ten
Pick a metric. The bars rescale. The red line is North Carolina’s statewide median.
On the map
Where North Carolina’s Hispanic and Latino communities live
Saturday Night Science
Methodology: How We Determined The Cities In North Carolina With The Largest Hispanic Population For 2026
We used Saturday Night Science to compare data on race from the US Census for every city in North Carolina.
North Carolina’s most recently available data comes from the 2020-2024 American Community Survey.
Specifically, we looked at table B03002: Hispanic OR LATINO ORIGIN BY RACE. Here are the category names as defined by the Census:
- Hispanic or Latino
- White alone*
- Black or African American alone*
- American Indian and Alaska Native alone*
- Asian alone*
- Native Hawaiian and Other Pacific Islander alone*
- Some other race alone*
- Two or more races*
Our particular column of interest here was the number of people who identified as Hispanic or Latino.
We limited our analysis to places in North Carolina with a population greater than 5,000 people. That left us with 124 cities.
We then calculated the percentage of Hispanic or Latino residents in each North Carolina city. The percentages ranked from 53.3% to 0.1%.
Finally, we ranked each city based on the percentage of the Hispanic or Latino population, with a higher percentage being more Hispanic or Latino. Siler City was the most Hispanic or Latino, while Nashville was the least Hispanic or Latino city.
We updated this article for 2026. This article represents our eleventh time ranking the cities in North Carolina with the largest Hispanic/Latino population.
The full plate
Cities In North Carolina By Hispanic Population
Click any column to sort. Search by city name.
| Rank | City | Population | Hispanic Population | % Hispanic |
|---|---|---|---|---|
| 1 | Siler City | 7,995 | 4,262 | 53.3% |
| 2 | Monroe | 36,759 | 11,365 | 30.9% |
| 3 | Sanford | 31,478 | 9,459 | 30.0% |
| 4 | Asheboro | 27,580 | 7,614 | 27.6% |
| 5 | Pineville | 11,055 | 3,046 | 27.6% |
| 6 | Butner | 8,065 | 2,006 | 24.9% |
| 7 | Wendell | 13,064 | 3,192 | 24.4% |
| 8 | Lexington | 19,690 | 4,741 | 24.1% |
| 9 | Selma | 6,817 | 1,590 | 23.3% |
| 10 | Morganton | 17,646 | 3,982 | 22.6% |
| 11 | Conover | 8,580 | 1,908 | 22.2% |
| 12 | Clinton | 8,304 | 1,818 | 21.9% |
| 13 | Jacksonville | 71,279 | 14,186 | 19.9% |
| 14 | Marion | 7,579 | 1,498 | 19.8% |
| 15 | Burlington | 59,610 | 11,641 | 19.5% |
| 16 | Graham | 18,048 | 3,282 | 18.2% |
| 17 | Winston-Salem | 252,037 | 45,789 | 18.2% |
| 18 | Spring Lake | 11,573 | 2,059 | 17.8% |
| 19 | Charlotte | 903,844 | 158,202 | 17.5% |
| 20 | Thomasville | 27,321 | 4,478 | 16.4% |
| 21 | Hope Mills | 17,939 | 2,938 | 16.4% |
| 22 | Havelock | 17,691 | 2,821 | 15.9% |
| 23 | Concord | 108,719 | 17,149 | 15.8% |
| 24 | Durham | 291,467 | 44,260 | 15.2% |
| 25 | Hickory | 44,258 | 6,709 | 15.2% |
| 26 | Statesville | 29,894 | 4,451 | 14.9% |
| 27 | Lincolnton | 11,783 | 1,753 | 14.9% |
| 28 | Indian Trail | 42,036 | 6,169 | 14.7% |
| 29 | Smithfield | 12,116 | 1,666 | 13.8% |
| 30 | Kernersville | 27,830 | 3,801 | 13.7% |
| 31 | Carrboro | 21,204 | 2,891 | 13.6% |
| 32 | Kannapolis | 57,890 | 7,784 | 13.4% |
| 33 | Lenoir | 18,299 | 2,421 | 13.2% |
| 34 | Garner | 34,473 | 4,554 | 13.2% |
| 35 | Clayton | 29,320 | 3,860 | 13.2% |
| 36 | Fayetteville | 210,815 | 27,604 | 13.1% |
| 37 | High Point | 116,245 | 15,005 | 12.9% |
| 38 | Gastonia | 82,884 | 10,598 | 12.8% |
| 39 | Lumberton | 18,859 | 2,383 | 12.6% |
| 40 | Raleigh | 481,031 | 60,502 | 12.6% |
| 41 | Wilson | 48,370 | 6,061 | 12.5% |
| 42 | Mint Hill | 27,556 | 3,333 | 12.1% |
| 43 | Waxhaw | 22,275 | 2,634 | 11.8% |
| 44 | Newton | 13,333 | 1,540 | 11.6% |
| 45 | Dunn | 8,559 | 988 | 11.5% |
| 46 | Salisbury | 35,825 | 4,106 | 11.5% |
| 47 | Kill Devil Hills | 7,761 | 867 | 11.2% |
| 48 | Knightdale | 20,214 | 2,201 | 10.9% |
| 49 | Wesley Chapel | 9,090 | 954 | 10.5% |
| 50 | Greensboro | 301,198 | 31,585 | 10.5% |
| 51 | Forest City | 7,363 | 771 | 10.5% |
| 52 | Clemmons | 21,871 | 2,232 | 10.2% |
| 53 | Mount Airy | 10,633 | 1,067 | 10.0% |
| 54 | Fuquay-Varina | 40,485 | 4,003 | 9.9% |
| 55 | Mount Holly | 18,208 | 1,789 | 9.8% |
| 56 | Henderson | 14,885 | 1,441 | 9.7% |
| 57 | Rockingham | 8,967 | 857 | 9.6% |
| 58 | Cary | 179,306 | 17,117 | 9.5% |
| 59 | Harrisburg | 19,633 | 1,868 | 9.5% |
| 60 | Morehead City | 9,806 | 926 | 9.4% |
| 61 | Wake Forest | 52,844 | 4,744 | 9.0% |
| 62 | Mills River | 7,281 | 648 | 8.9% |
| 63 | Wilmington | 120,805 | 10,612 | 8.8% |
| 64 | Mebane | 19,538 | 1,703 | 8.7% |
| 65 | Hendersonville | 15,408 | 1,337 | 8.7% |
| 66 | Woodfin | 8,048 | 691 | 8.6% |
| 67 | Bessemer City | 5,580 | 479 | 8.6% |
| 68 | Fletcher | 8,098 | 686 | 8.5% |
| 69 | Eden | 15,356 | 1,294 | 8.4% |
| 70 | Mooresville | 52,381 | 4,339 | 8.3% |
| 71 | Huntersville | 63,969 | 5,285 | 8.3% |
| 72 | Hillsborough | 9,724 | 796 | 8.2% |
| 73 | Trinity | 7,111 | 581 | 8.2% |
| 74 | Roxboro | 8,182 | 640 | 7.8% |
| 75 | Boone | 20,032 | 1,551 | 7.7% |
| 76 | Chapel Hill | 61,607 | 4,658 | 7.6% |
| 77 | Weddington | 13,805 | 989 | 7.2% |
| 78 | Elizabeth City | 18,871 | 1,332 | 7.1% |
| 79 | Southern Pines | 16,420 | 1,156 | 7.0% |
| 80 | New Bern | 32,734 | 2,285 | 7.0% |
| 81 | Williamston | 5,112 | 350 | 6.8% |
| 82 | Holly Springs | 45,248 | 3,065 | 6.8% |
| 83 | Waynesville | 10,502 | 697 | 6.6% |
| 84 | Asheville | 94,535 | 6,264 | 6.6% |
| 85 | Tarboro | 10,770 | 711 | 6.6% |
| 86 | Carolina Beach | 6,745 | 434 | 6.4% |
| 87 | Stallings | 16,886 | 1,086 | 6.4% |
| 88 | Reidsville | 14,585 | 938 | 6.4% |
| 89 | King | 7,408 | 463 | 6.2% |
| 90 | Albemarle | 16,762 | 1,044 | 6.2% |
| 91 | Apex | 70,630 | 4,376 | 6.2% |
| 92 | Goldsboro | 34,383 | 2,087 | 6.1% |
| 93 | Roanoke Rapids | 14,856 | 901 | 6.1% |
| 94 | Matthews | 30,577 | 1,823 | 6.0% |
| 95 | Oak Ridge | 7,744 | 447 | 5.8% |
| 96 | Cherryville | 6,226 | 350 | 5.6% |
| 97 | Greenville | 92,857 | 5,136 | 5.5% |
| 98 | Rocky Mount | 54,297 | 2,997 | 5.5% |
| 99 | Lewisville | 13,828 | 757 | 5.5% |
| 100 | Cornelius | 32,783 | 1,761 | 5.4% |
Source: U.S. Census ACS 2020-2024. 124 cities with more than 5,000 residents.
Summary
Summary: Hispanic or Latino Populations Across North Carolina
According to the most recent data, this is an accurate list if you’re looking for a breakdown of Latino populations for each place across North Carolina.
The most Hispanic/Latino cities in North Carolina are Siler City, Monroe, Sanford, Asheboro, Pineville, Butner, Wendell, Lexington, Selma, and Morganton.


