

In this article, we will explore some of the most liberal cities in South Carolina, where progressive ideas and inclusive attitudes flourish.
If you’re looking to move to South Carolina and want to know where the majority of South Carolinians lean left, you’ve come to the right place.
Specifically, we wanted to know which cities have the highest number of liberal voters in the Palmetto State.
To do so, we analyzed how the people in each city in South Carolina with a population greater than 5,000 voted during the last presidential election. The cities with the highest percentage of voters who voted Democrat were named the most liberal cities in the state.
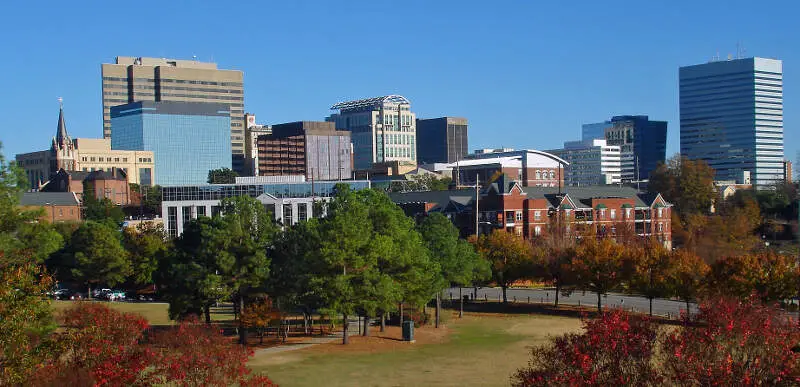
68.4% Democrat vote · #3 most liberal in South Carolina
 Located in
Richland County, South Carolina
Located in
Richland County, South Carolina
Columbia is the capital and second largest city of the U.S. state of South Carolina, with a population estimate of 134,309 as of 2016. The city serves as the county seat of Richland County, and a portion of the city extends into neighboring Lexington County. It is the center of the Columbia metropolitan statistical area, which had a population of 767,598 as of the 2010 United States Census, growing to 817,488 by July 1, 2016, according to 2015 U.S. Census estimates. The name Columbia is a poetic term used for the United States, originating from the name of Christopher Columbus.
Data | Crime | Cost of living | Movers
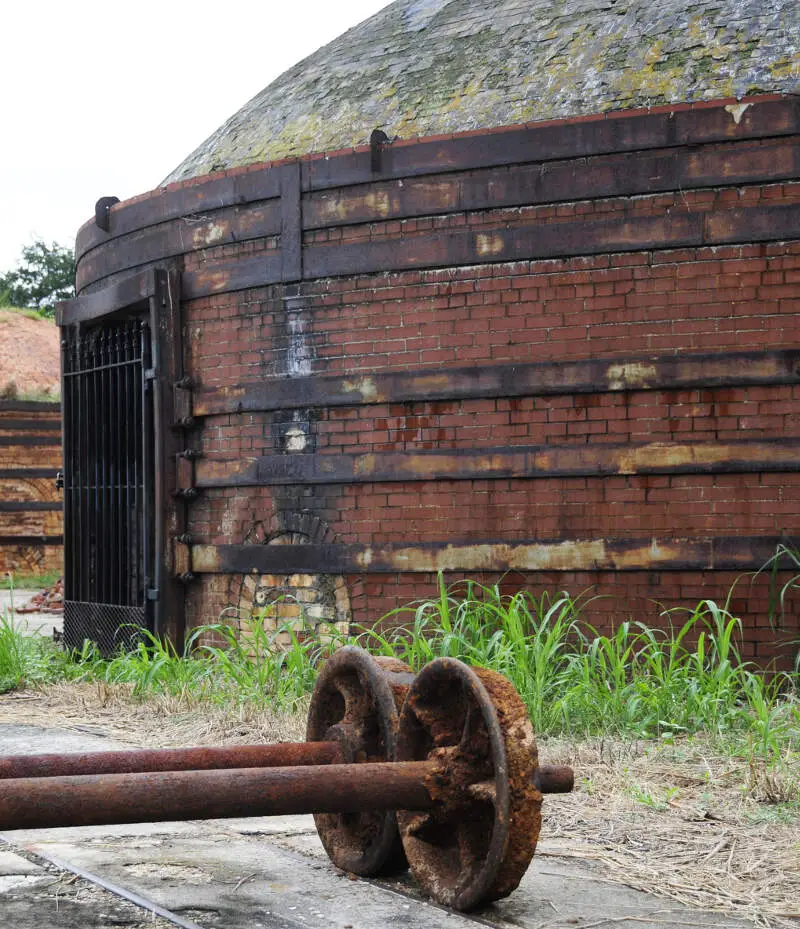
68.4% Democrat vote · #3 most liberal in South Carolina
 Located in
Richland County, South Carolina
Located in
Richland County, South Carolina
Cayce is a city in Lexington and Richland counties in the U.S. state of South Carolina, along the Congaree River. The population was 12,528 at the 2010 census. It is part of the Columbia, South Carolina, Metropolitan Statistical Area.
Data | Crime | Cost of living | Movers
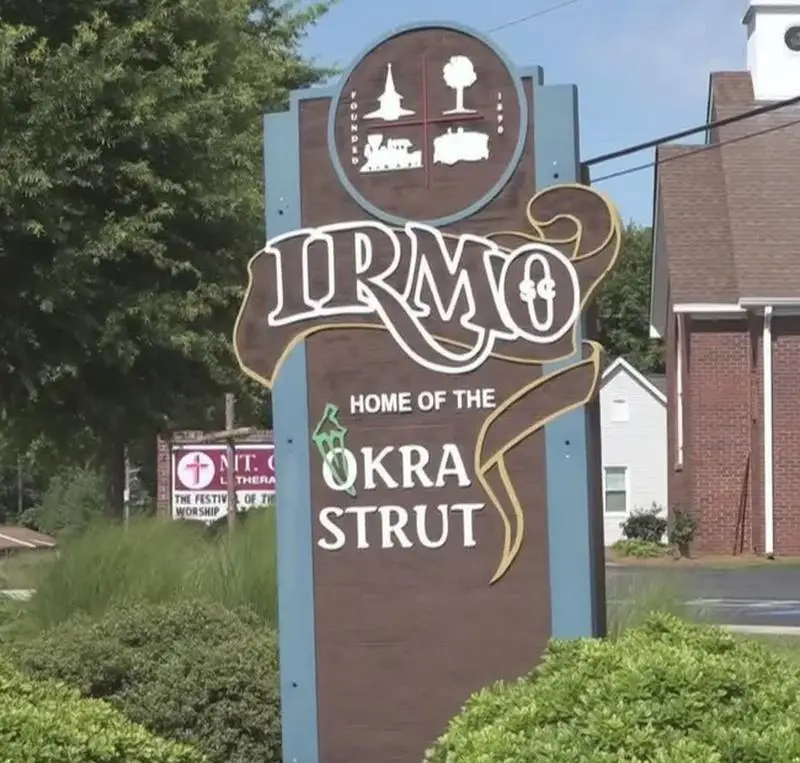
68.4% Democrat vote · #3 most liberal in South Carolina
 Located in
Richland County, South Carolina
Located in
Richland County, South Carolina
Irmo is a town in Lexington and Richland counties, South Carolina, United States and a suburb of Columbia. It is part of the Columbia Metropolitan Statistical Area and is located 12 miles northwest of the city center. The population of Irmo was 11,097 at the 2010 census.
Data | Crime | Cost of living | Movers
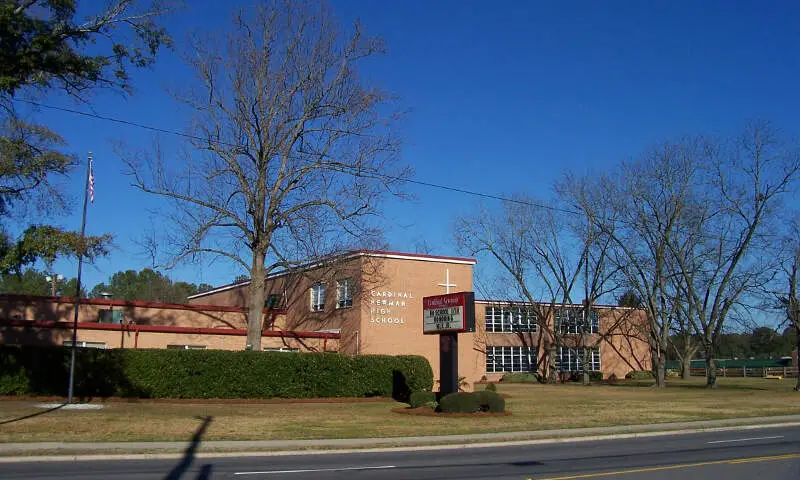
68.4% Democrat vote · #3 most liberal in South Carolina
 Located in
Richland County, South Carolina
Located in
Richland County, South Carolina
Data | Crime | Cost of living | Movers
68.4% Democrat vote · #3 most liberal in South Carolina
Data | Crime | Cost of living | Movers
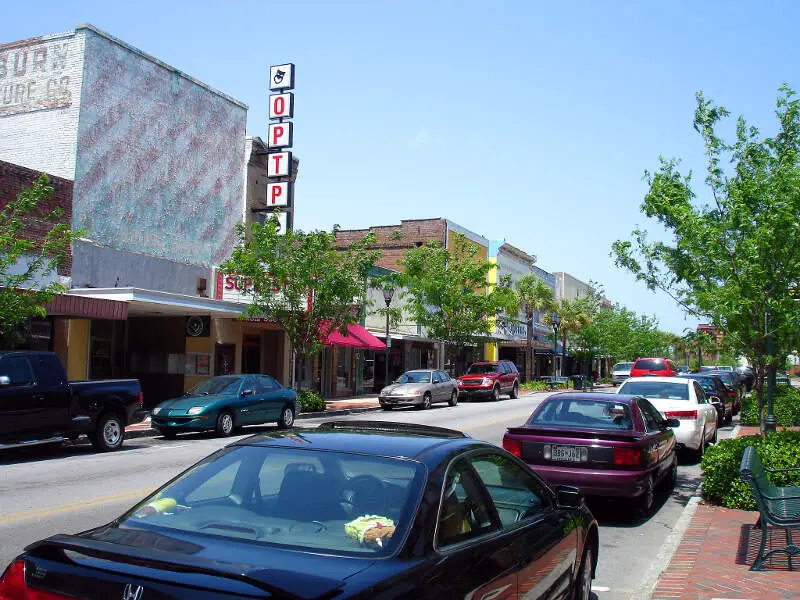
66.2% Democrat vote · #6 most liberal in South Carolina
 Located in
Orangeburg County, South Carolina
Located in
Orangeburg County, South Carolina
Orangeburg, also known as The Garden City, is the principal city in and the county seat of Orangeburg County, South Carolina, United States. The population of the city was 13,964 according to the 2010 United States census. The city is located 37 miles southeast of Columbia, on the north fork of the Edisto River in the Piedmont area.
Data | Crime | Cost of living | Movers
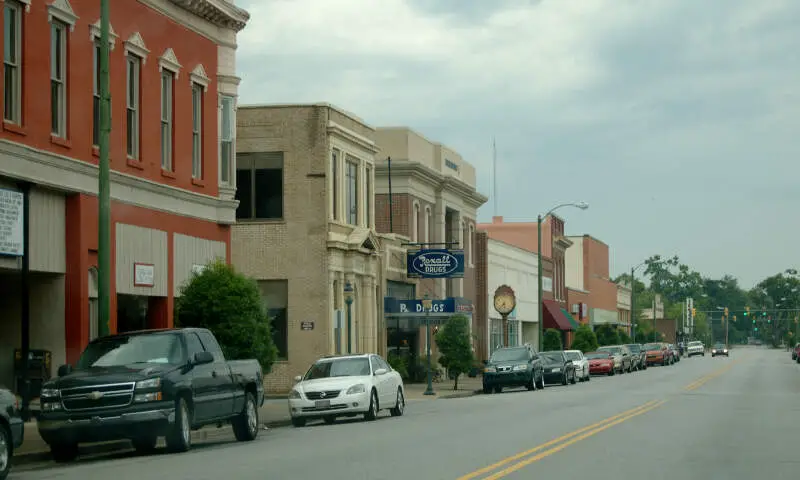
60.3% Democrat vote · #8 most liberal in South Carolina
 Located in
Marion County, South Carolina
Located in
Marion County, South Carolina
Marion is a city in Marion County, South Carolina, United States. The population was 6,711 at the 2016 census. It is the county seat of Marion County. It is named for Francis Marion, a Brigadier General from South Carolina in the American Revolutionary War.
Data | Crime | Cost of living | Movers
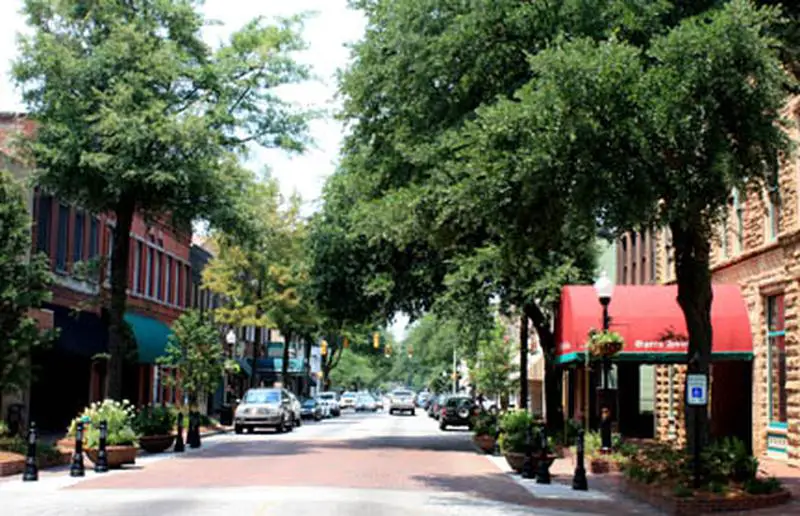
56.0% Democrat vote · #9 most liberal in South Carolina
 Located in
Sumter County, South Carolina
Located in
Sumter County, South Carolina
Sumter is the county seat of Sumter County, South Carolina, United States. Known as the Sumter Metropolitan Statistical Area, the namesake county adjoins Clarendon and Lee to form the core of Sumter-Lee-Clarendon tri-county area of South Carolina, an area that includes the three counties in the east central Piedmont. The U.S. Census Bureau estimated the city’s population was 39,643 at the 2000 census. The 2010 census puts the city at 40,524.
Data | Crime | Cost of living | Movers
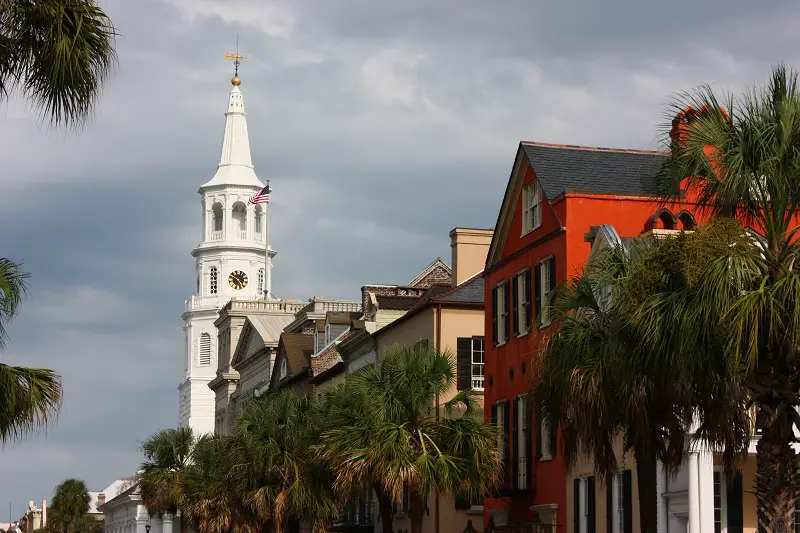
55.5% Democrat vote · #13 most liberal in South Carolina
 Located in
Charleston County, South Carolina
Located in
Charleston County, South Carolina
Charleston is the oldest and largest city in the U.S. state of South Carolina, the county seat of Charleston County, and the principal city in the Charleston-North Charleston-Summerville Metropolitan Statistical Area. The city lies just south of the geographical midpoint of South Carolina’s coastline and is located on Charleston Harbor, an inlet of the Atlantic Ocean formed by the confluence of the Ashley and Cooper rivers. Charleston had an estimated population of 134,385 in 2016. The estimated population of the Charleston metropolitan area, comprising Berkeley, Charleston, and Dorchester counties, was 761,155 residents in 2016, the third-largest in the state and the 78th-largest metropolitan statistical area in the United States.
Data | Crime | Cost of living | Movers
55.5% Democrat vote · #13 most liberal in South Carolina
 Located in
Dorchester County, South Carolina
Located in
Dorchester County, South Carolina
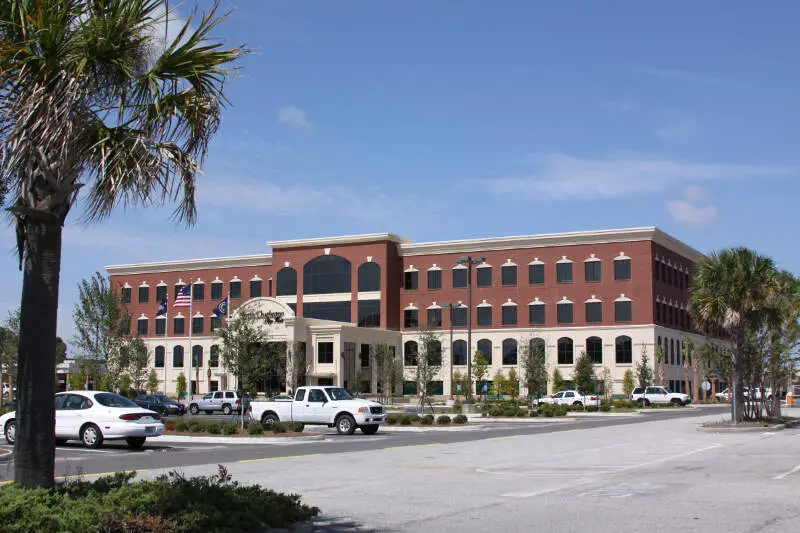
North Charleston is the third-largest city in the U.S. state of South Carolina, with incorporated areas in Berkeley, Charleston, and Dorchester counties. On June 12, 1972, the city of North Charleston was incorporated and was rated as the ninth-largest city in South Carolina. As of the 2010 Census, North Charleston had a population of 97,471, growing to an estimated population of 108,304 in 2015, and with a current area of more than 76.6 square miles. As defined by the U.S. Office of Management and Budget, for use by the U.S. Census Bureau and other U.S. Government agencies for statistical purposes only, North Charleston is included within the Charleston-North Charleston-Summerville metropolitan area and the Charleston-North Charleston urban area. North Charleston is one of the state’s major industrial centers and is the state’s top city in gross retail sales.
Data | Crime | Cost of living | Movers
The receipts
Compare the top ten
Pick a metric. The bars rescale. The red line is South Carolina’s statewide median.
On the map
Mapping the liberal strongholds in South Carolina
Saturday Night Science
How we determined the most liberal cities in South Carolina for 2026
To find the most liberal places in South Carolina, we used Saturday Night Science – the argument you’d make at a bar – to find the cities with the most liberals.
We started by making a list of every city in South Carolina over 5,000 people based on the 2020-2024 American Community Survey. That left us with 64 cities and towns.
We then measured the voting record and MIT election data to determine which places lean the most leftward in their allegiances by:
- Percentage Of Votes For Democratic President In 2020
Because no voting data exists at the city level, we used county-level election results from the 2020 election. We assigned every city in a county the percentage of votes that went to the Democrats, effectively extending the county’s results to the city level. In cases where larger cities encompassed an entire county, the election outcomes accurately reflected the city’s political landscape.
The winner, Columbia, is “The Most liberal City in South Carolina For 2026”. The most conservative place in South Carolina was Central.
We updated this article for 2026. This report is our eleventh time ranking the most liberal places to live in South Carolina.
The full plate
Most Liberal Places In South Carolina
Click any column to sort. Search by city name.
| Rank | City | Population | % Liberal |
|---|---|---|---|
| 3 | Columbia | 139,643 | 68.4% |
| 3 | Cayce | 13,741 | 68.4% |
| 3 | Irmo | 11,813 | 68.4% |
| 3 | Forest Acres | 10,530 | 68.4% |
| 3 | Blythewood | 5,731 | 68.4% |
| 6 | Orangeburg | 13,253 | 66.2% |
| 7 | Marion | 6,206 | 60.3% |
| 8 | Sumter | 43,053 | 56.0% |
| 12 | Charleston | 154,338 | 55.5% |
| 12 | North Charleston | 119,913 | 55.5% |
| 12 | Mount Pleasant | 93,993 | 55.5% |
| 12 | Summerville | 51,654 | 55.5% |
| 12 | Goose Creek | 48,078 | 55.5% |
| 12 | James Island | 12,198 | 55.5% |
| 12 | Hollywood | 5,382 | 55.5% |
| 16 | Bennettsville | 7,751 | 55.0% |
| 17 | Hardeeville | 10,871 | 49.9% |
| 18 | Dillon | 6,354 | 49.1% |
| 19 | Florence | 40,408 | 48.3% |
| 19 | Lake City | 5,988 | 48.3% |
| 21 | Hartsville | 7,419 | 47.0% |
| 21 | Darlington | 6,120 | 47.0% |
| 23 | Walterboro | 5,480 | 44.6% |
| 25 | Hilton Head Island | 37,911 | 44.4% |
| 25 | Bluffton | 33,157 | 44.4% |
| 25 | Port Royal | 15,579 | 44.4% |
| 25 | Beaufort | 13,747 | 44.4% |
| 28 | Chester | 5,218 | 44.1% |
| 29 | Hanahan | 21,452 | 43.3% |
| 29 | Moncks Corner | 15,485 | 43.3% |
| 31 | Georgetown | 8,565 | 43.1% |
| 34 | Clover | 7,234 | 41.0% |
| 34 | York | 8,969 | 41.0% |
| 34 | Rock Hill | 75,259 | 41.0% |
| 34 | Fort Mill | 30,775 | 41.0% |
| 34 | Tega Cay | 13,615 | 41.0% |
| 39 | Greenville | 72,935 | 39.9% |
| 39 | Greer | 41,536 | 39.9% |
| 39 | Mauldin | 27,055 | 39.9% |
| 39 | Simpsonville | 26,144 | 39.9% |
| 39 | Fountain Inn | 12,020 | 39.9% |
| 39 | Travelers Rest | 8,370 | 39.9% |
| 43 | Lancaster | 8,921 | 38.0% |
| 44 | Greenwood | 22,536 | 37.9% |
| 45 | Aiken | 32,521 | 37.9% |
| 45 | North Augusta | 25,653 | 37.9% |
| 47 | Camden | 8,267 | 37.8% |
| 48 | Newberry | 10,790 | 37.3% |
| 49 | Union | 8,079 | 37.2% |
| 50 | Spartanburg | 38,910 | 35.6% |
| 50 | Lyman | 6,547 | 35.6% |
| 52 | Lexington | 24,585 | 34.1% |
| 52 | West Columbia | 17,963 | 34.1% |
| 54 | Laurens | 9,336 | 33.3% |
| 54 | Clinton | 7,676 | 33.3% |
| 57 | Myrtle Beach | 38,371 | 32.9% |
| 57 | Conway | 27,263 | 32.9% |
| 57 | North Myrtle Beach | 19,855 | 32.9% |
| 60 | Anderson | 30,051 | 28.3% |
| 60 | Easley | 24,841 | 28.3% |
| 60 | Clemson | 18,072 | 28.3% |
| 62 | Gaffney | 12,596 | 27.6% |
| 63 | Seneca | 8,993 | 25.6% |
| 64 | Central | 5,320 | 23.7% |
Source: county-level 2020 election results, U.S. Census ACS 2020-2024. 64 cities with more than 5,000 residents.
Summary
Summing Up The Liberal Snowflakes in South Carolina
Well, there you have it, the places in South Carolina that have the highest number of liberals per capita, with Columbia ranking as the least conservative in the entire state.
The most liberal cities in South Carolina are Columbia, Cayce, Irmo, Forest Acres, Blythewood, Orangeburg, Marion, Sumter, Charleston, and North Charleston.
If you’re curious, here are the least liberal cities in South Carolina. Not sold on South Carolina? Take the two-minute Find Your Place quiz and see which state actually fits you.
Questions and answers
Most Liberal Places In South Carolina FAQs
What is the most liberal city in South Carolina?
Columbia is the most liberal place in South Carolina for 2026, by Democrat share of the 2020 presidential vote. Cayce and Irmo are next.
What are the most liberal places in South Carolina?
The most liberal places in South Carolina are Columbia, Cayce, Irmo, Forest Acres, Blythewood, Orangeburg, Marion, Sumter, Charleston, and North Charleston. We ranked all 64 cities with more than 5,000 residents.
How do you measure how liberal a city is?
Cities are ranked on the county-level Democrat vote share from the 2020 presidential election. One number, straight from certified election results.
What is the most conservative place in South Carolina?
Central posts the lowest Democrat vote share of the 64 South Carolina cities we ranked, making it the most conservative place on this list. Our separate most conservative places in South Carolina ranking runs the same math from the other direction.
Does city size matter in this ranking?
Only places with more than 5,000 residents qualify — 64 South Carolina cities this year. Beyond that cutoff, a small town and a big city count the same.


