Most Native American places in Illinois research summary. We used Saturday Night Science to research the Illinois cities with the highest percentage of Native American residents for 2026. The data comes from the American Community Survey 2020-2024 vintage, which breaks down race by origin.
The city with the highest percentage of Native Americans is Mount Vernon. 0.72% of people in Mount Vernon are Native Americans.
The city with the lowest percentage of Native Americans is Lockport. 0.00% of people in Lockport are Native American.
The city with the most Native Americans is Chicago. 2,271 people in Chicago are Native American.
The city with the fewest Native Americans is Lockport. 0 people in Lockport are Native American.
The United States has 1,698,432 Native Americans and is 0.51% Native American.
Which city in Illinois had the largest Native American population? The place with the largest Native American population in Illinois for 2026 is Mount Vernon. 0.72% of Mount Vernon identify as Native American.
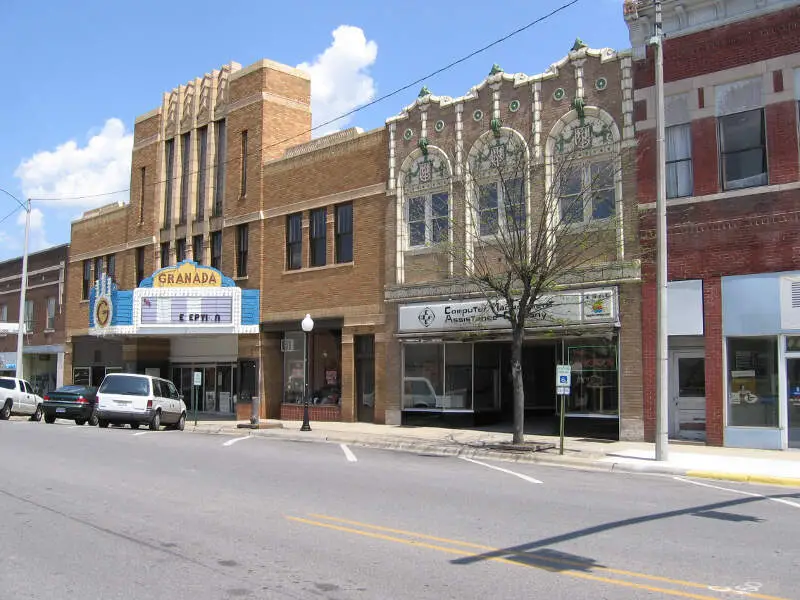
0.7% Native American · 102 Native American residents
Mount Vernon known as “The King City” is a city in and the county seat of Jefferson County, Illinois, United States. The population was 15,277 at the 2010 census.
Data | Crime | Cost of living | Movers
0.7% Native American · 93 Native American residents
Canton is the largest city in Fulton County, Illinois, United States. The population was 14,704 at the 2010 census, down from 15,288 as of the 2000 census. The Canton Micropolitan Statistical Area covers all of Fulton County; it is in turn part of the wider Peoria-Canton, IL Combined Statistical Area.
Data | Crime | Cost of living | Movers
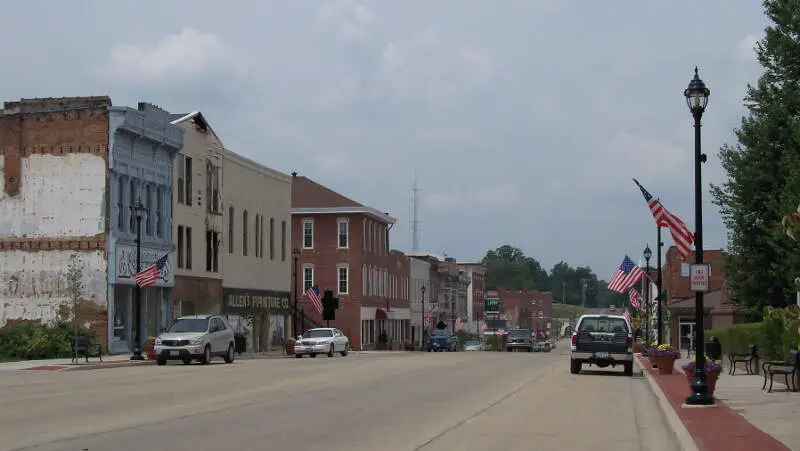
0.7% Native American · 41 Native American residents
Vandalia is a town in Fayette County, Illinois, United States, 69 miles northeast of St. Louis, on the Kaskaskia River. It served as the state capital of Illinois from 1819 until 1839, when the seat of state government moved to Springfield. Vandalia was for years the western terminus of the National Road.
Data | Crime | Cost of living | Movers
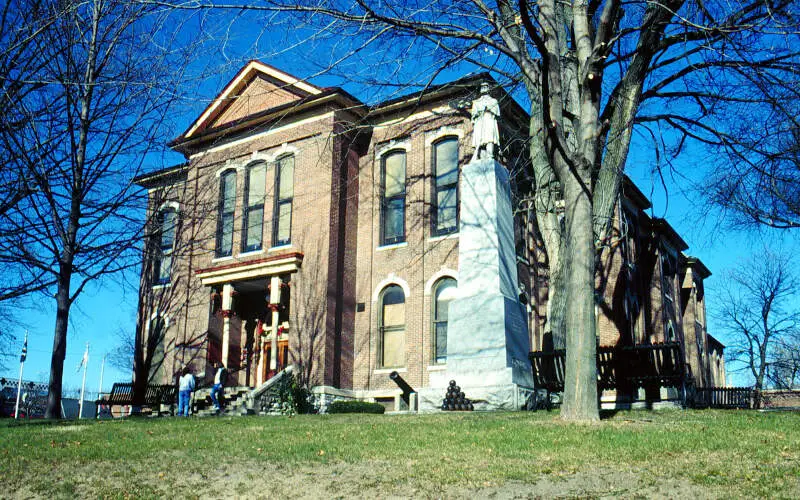
0.6% Native American · 45 Native American residents
Greenville is a city in Bond County, Illinois, United States, 51 miles east of St. Louis. The population as of the 2010 census was 7,000. It is the county seat of Bond County.
Data | Crime | Cost of living | Movers
0.6% Native American · 32 Native American residents
Berkeley is a village located in Cook County, Illinois, United States. Incorporated in 1924, the population at the 2010 census was 5,209.
Data | Crime | Cost of living | Movers
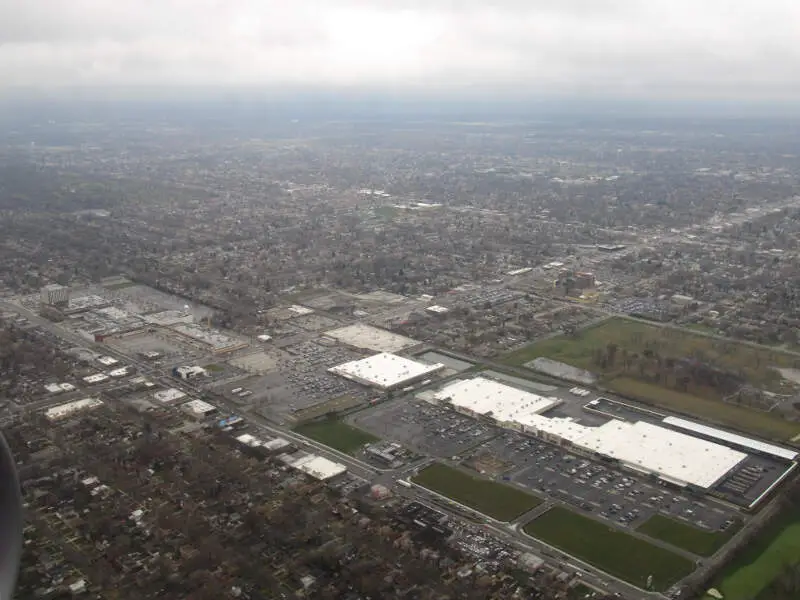
0.6% Native American · 173 Native American residents
North Chicago is a city in Lake County, Illinois, United States, and a suburb of the Chicago metropolitan area. The population was 32,574 at the 2010 census.
Data | Crime | Cost of living | Movers
0.6% Native American · 107 Native American residents
Evergreen Park is a village in Cook County, Illinois, United States. In 2010, the population of Evergreen Park was 19,852, according to that year’s census.
Data | Crime | Cost of living | Movers
0.5% Native American · 35 Native American residents
Clinton is the largest city in DeWitt County, Illinois, United States. The population was 7,225 at the 2010 census. It is the county seat of DeWitt County.
Data | Crime | Cost of living | Movers
0.5% Native American · 47 Native American residents
Data | Crime | Cost of living | Movers
0.5% Native American · 173 Native American residents
Data | Crime | Cost of living | Movers
The receipts
Compare the top ten
Pick a metric. The bars rescale. The red line is Illinois’s statewide median.
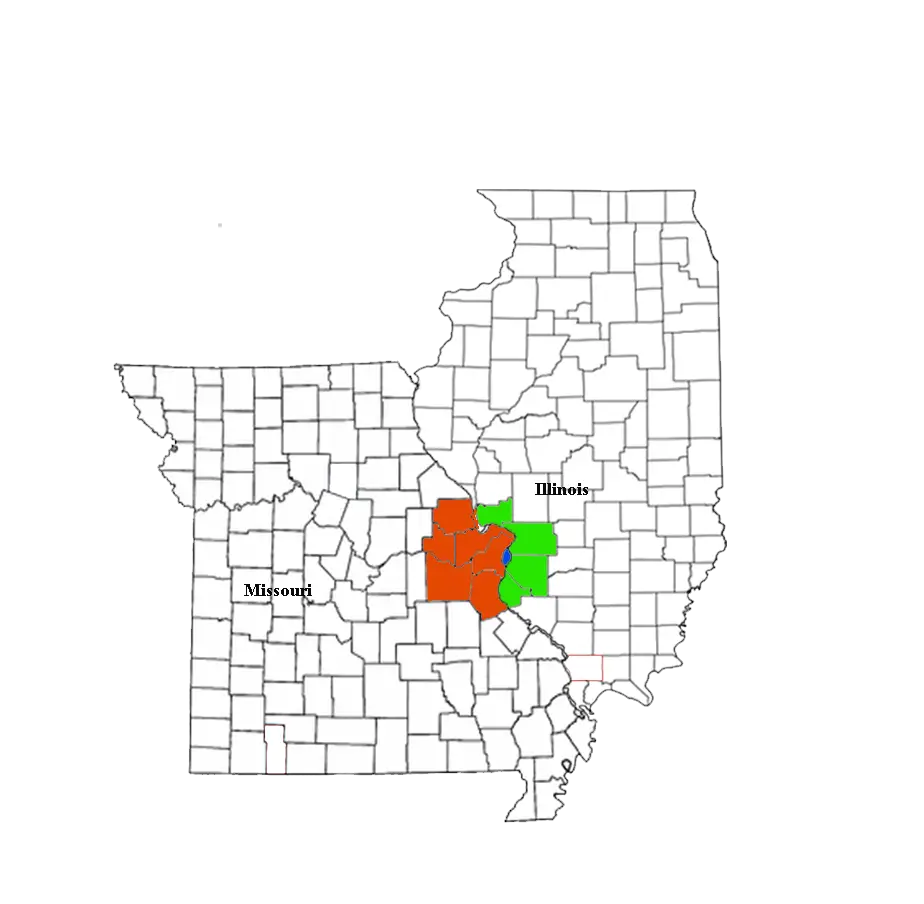
On the map
Where Illinois’s Native American population is concentrated
Saturday Night Science
Methodology: How We Determined The Cities In Illinois With The Largest Native American Population For 2026
We still believe in the accuracy of data — especially from the Census. So that’s where we went to get the race breakdown across Illinois.
We used Saturday Night Science to analyze the Census’s most recently available data, the 2020-2024 American Community Survey data.
Specifically, we looked at table B03002: Hispanic OR LATINO ORIGIN BY RACE. Here are the category names as defined by the Census:
- Hispanic or Latino
- White alone
- Black or African American alone
- American Indian and Alaska Native alone
- Asian alone
- Native Hawaiian and Other Pacific Islander alone
- Some other race alone
- Two or more races
Our particular column of interest here was the number of people identifying as American Indian and Alaska Native alone.
We limited our analysis to places with a population greater than 5,000 people. That left us with 324 cities.
We then calculated the percentage of residents that are American Indian and Alaska Native. The percentages ranked from 0.72 to 0.00.
Finally, we ranked each city based on the percentage of the American Indian and Alaska Native population, with a higher score being more American Indian and Alaska Native than a lower score. Mount Vernon took the distinction of being the most American Indian and Alaska Native, while Lockport was the least Native American city.
We updated this article for 2026. This article is our eleventh time ranking the cities in Illinois with the largest Native American population.
The full plate
Most Native American Places In Illinois
Click any column to sort. Search by city name.
| Rank | City | Population | Native American Population | % Native American |
|---|---|---|---|---|
| 1 | Mount Vernon | 14,090 | 102 | 0.7% |
| 2 | Canton | 13,144 | 93 | 0.7% |
| 3 | Vandalia | 5,796 | 41 | 0.7% |
| 4 | Greenville | 7,235 | 45 | 0.6% |
| 5 | Berkeley | 5,199 | 32 | 0.6% |
| 6 | North Chicago | 30,643 | 173 | 0.6% |
| 7 | Evergreen Park | 19,420 | 107 | 0.6% |
| 8 | Clinton | 6,985 | 35 | 0.5% |
| 9 | Wood River | 10,279 | 47 | 0.5% |
| 10 | Wheeling | 38,433 | 173 | 0.5% |
| 11 | DeKalb | 40,443 | 159 | 0.4% |
| 12 | Alton | 25,279 | 99 | 0.4% |
| 13 | Chester | 6,797 | 26 | 0.4% |
| 14 | Plainfield | 46,708 | 160 | 0.3% |
| 15 | Pekin | 31,781 | 106 | 0.3% |
| 16 | Stickney | 6,952 | 23 | 0.3% |
| 17 | Chicago Heights | 26,736 | 83 | 0.3% |
| 18 | Calumet Park | 6,855 | 21 | 0.3% |
| 19 | Carol Stream | 39,460 | 105 | 0.3% |
| 20 | Carlinville | 5,480 | 14 | 0.3% |
| 21 | Elgin | 114,934 | 288 | 0.3% |
| 22 | Glenwood | 8,603 | 20 | 0.2% |
| 23 | Alsip | 18,583 | 43 | 0.2% |
| 24 | Edwardsville | 26,474 | 60 | 0.2% |
| 25 | Bridgeview | 16,849 | 35 | 0.2% |
| 26 | Round Lake | 18,628 | 37 | 0.2% |
| 27 | Harvey | 20,230 | 40 | 0.2% |
| 28 | North Aurora | 18,696 | 35 | 0.2% |
| 29 | Rock Falls | 8,587 | 16 | 0.2% |
| 30 | Hanover Park | 36,732 | 66 | 0.2% |
| 31 | Freeport | 23,505 | 42 | 0.2% |
| 32 | Monmouth | 8,581 | 15 | 0.2% |
| 33 | Elmwood Park | 23,868 | 41 | 0.2% |
| 34 | Shiloh | 14,572 | 25 | 0.2% |
| 35 | Robinson | 7,084 | 12 | 0.2% |
| 36 | Oswego | 36,375 | 61 | 0.2% |
| 37 | Braidwood | 6,062 | 10 | 0.2% |
| 38 | Geneva | 21,258 | 34 | 0.2% |
| 39 | Summit | 10,846 | 17 | 0.2% |
| 40 | West Frankfort | 7,118 | 11 | 0.2% |
| 41 | Park City | 7,827 | 12 | 0.2% |
| 42 | Rockford | 147,521 | 226 | 0.2% |
| 43 | Lincolnwood | 13,112 | 20 | 0.2% |
| 44 | Litchfield | 6,834 | 10 | 0.1% |
| 45 | Libertyville | 20,525 | 30 | 0.1% |
| 46 | Crystal Lake | 40,579 | 58 | 0.1% |
| 47 | Johnsburg | 6,386 | 9 | 0.1% |
| 48 | Lakemoor | 6,467 | 9 | 0.1% |
| 49 | Jacksonville | 18,014 | 25 | 0.1% |
| 50 | Machesney Park | 22,630 | 31 | 0.1% |
| 51 | Waterloo | 11,129 | 15 | 0.1% |
| 52 | Skokie | 66,219 | 88 | 0.1% |
| 53 | Rock Island | 36,151 | 48 | 0.1% |
| 54 | Spring Valley | 5,476 | 7 | 0.1% |
| 55 | Lake Villa | 8,683 | 11 | 0.1% |
| 56 | Broadview | 7,896 | 10 | 0.1% |
| 57 | Zion | 24,600 | 31 | 0.1% |
| 58 | Silvis | 7,955 | 10 | 0.1% |
| 59 | Lindenhurst | 14,417 | 18 | 0.1% |
| 60 | Yorkville | 23,617 | 29 | 0.1% |
| 61 | Long Grove | 8,305 | 9 | 0.1% |
| 62 | Granite City | 26,549 | 28 | 0.1% |
| 63 | Olney | 8,577 | 9 | 0.1% |
| 64 | Champaign | 89,996 | 94 | 0.1% |
| 65 | Sandwich | 7,219 | 7 | 0.1% |
| 66 | Bensenville | 18,603 | 18 | 0.1% |
| 67 | Harvard | 9,598 | 9 | 0.1% |
| 68 | Midlothian | 13,948 | 13 | 0.1% |
| 69 | Batavia | 27,151 | 25 | 0.1% |
| 70 | Naperville | 150,692 | 134 | 0.1% |
| 71 | Peoria Heights | 5,825 | 5 | 0.1% |
| 72 | Taylorville | 10,646 | 9 | 0.1% |
| 73 | Waukegan | 89,076 | 75 | 0.1% |
| 74 | Chicago | 2,711,226 | 2,271 | 0.1% |
| 75 | Inverness | 7,275 | 6 | 0.1% |
| 76 | Rantoul | 12,421 | 10 | 0.1% |
| 77 | Woodstock | 26,147 | 21 | 0.1% |
| 78 | Mundelein | 31,915 | 25 | 0.1% |
| 79 | O’Fallon | 32,262 | 25 | 0.1% |
| 80 | Marion | 16,836 | 13 | 0.1% |
| 81 | Island Lake | 8,014 | 6 | 0.1% |
| 82 | Streamwood | 39,001 | 29 | 0.1% |
| 83 | Algonquin | 30,067 | 22 | 0.1% |
| 84 | Mattoon | 16,586 | 12 | 0.1% |
| 85 | Quincy | 39,109 | 28 | 0.1% |
| 86 | Schaumburg | 76,868 | 55 | 0.1% |
| 87 | Montgomery | 21,515 | 15 | 0.1% |
| 88 | Springfield | 113,330 | 79 | 0.1% |
| 89 | Normal | 53,569 | 36 | 0.1% |
| 90 | East Moline | 20,904 | 14 | 0.1% |
| 91 | Park Forest | 21,156 | 14 | 0.1% |
| 92 | Herrin | 12,226 | 8 | 0.1% |
| 93 | Pontiac | 11,294 | 7 | 0.1% |
| 94 | Lombard | 43,619 | 27 | 0.1% |
| 95 | Morris | 14,898 | 9 | 0.1% |
| 96 | Dixon | 14,910 | 9 | 0.1% |
| 97 | Western Springs | 13,446 | 8 | 0.1% |
| 98 | Channahon | 13,927 | 8 | 0.1% |
| 99 | Decatur | 69,815 | 40 | 0.1% |
| 100 | Carpentersville | 37,346 | 21 | 0.1% |
Source: U.S. Census ACS 2020-2024, table B03002. 324 Illinois cities with more than 5,000 residents.
Summary
Summary: Native American Populations Across Illinois
If you’re looking for a breakdown of Native American populations across Illinois according to the most recent data, this is an accurate list.
The most Native American cities in Illinois are Mount Vernon, Canton, Vandalia, Greenville, Berkeley, North Chicago, Evergreen Park, Clinton, Wood River, and Wheeling.


