Most Native American places in Missouri research summary. We used Saturday Night Science to research the Missouri cities with the highest percentage of Native American residents for 2026. The data comes from the American Community Survey 2020-2024 vintage, which breaks down race by origin.
The city with the highest percentage of Native Americans is Odessa. 1.16% of people in Odessa are Native Americans.
The city with the lowest percentage of Native Americans is St. John. 0.00% of people in St. John are Native American.
The city with the most Native Americans is Kansas City. 511 people in Kansas City are Native American.
The city with the fewest Native Americans is St. John. 0 people in St. John are Native American.
The United States has 1,698,432 Native Americans and is 0.51% Native American.
Which city in Missouri had the largest Native American population? The place with the largest Native American population in Missouri for 2026 is Odessa. 1.16% of Odessa identify as Native American.
1.2% Native American · 65 Native American residents
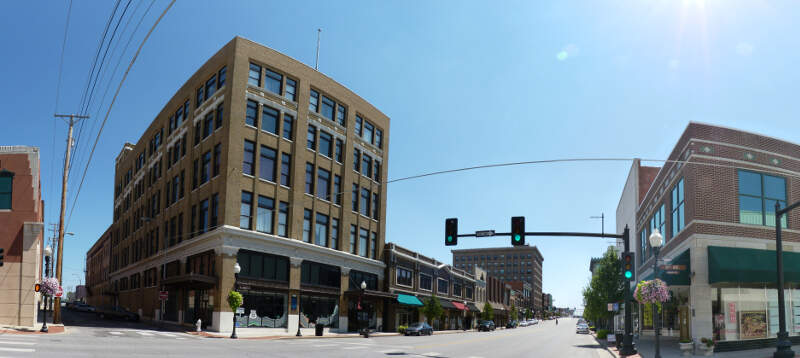
Odessa is a city in Lafayette County, Missouri, United States. The population was 5,300 at the 2010 census.
Data | Crime | Cost of living | Movers
1.0% Native American · 156 Native American residents
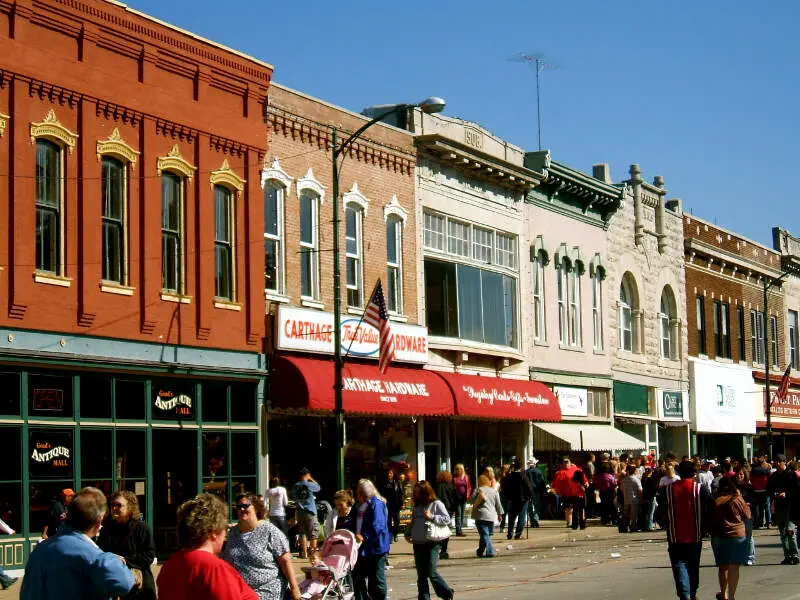
Carthage is a city in Jasper County, Missouri, United States. The population was 14,378 at the 2010 census. It is the county seat of Jasper County and is nicknamed “America’s Maple Leaf City.”
Data | Crime | Cost of living | Movers
0.7% Native American · 200 Native American residents
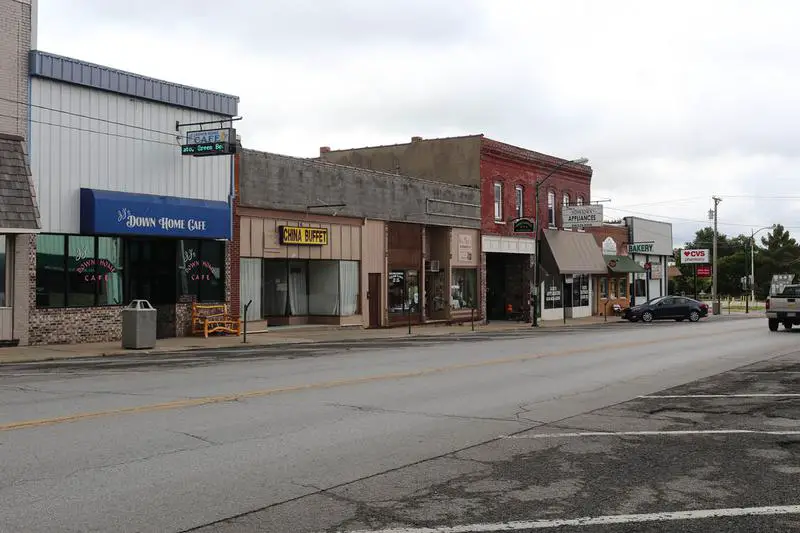
Gladstone is a city in Clay County, Missouri, is a suburb of Kansas City, Missouri. The City of Gladstone has the advantage of being located only 10 minutes from downtown Kansas City, and 10 minutes from Kansas City International Airport. As of the 2010 census, the city population was 26,365.
Data | Crime | Cost of living | Movers
0.7% Native American · 106 Native American residents
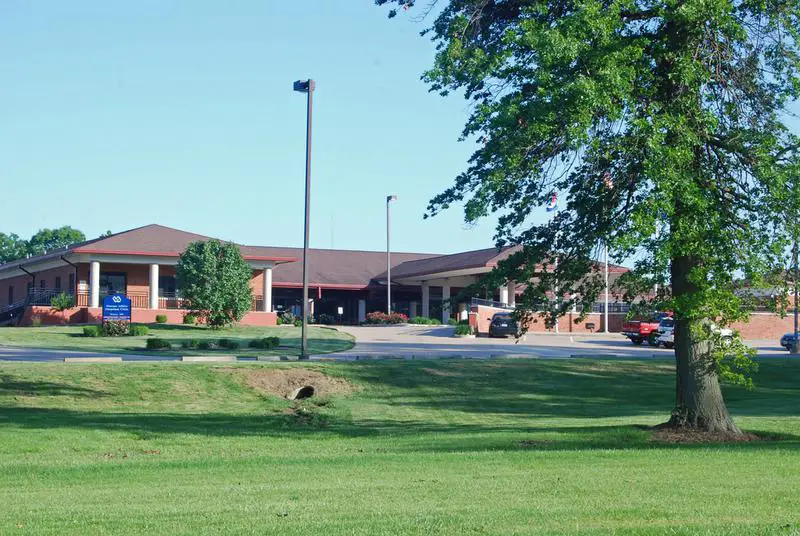
Jackson is a city in Cape Girardeau County, Missouri, United States. The population was 13,758 at the 2010 census. It is the county seat of Cape Girardeau County. It is a principal city of the Cape Girardeau-Jackson, MO-IL Metropolitan Statistical Area.
Data | Crime | Cost of living | Movers
0.6% Native American · 321 Native American residents
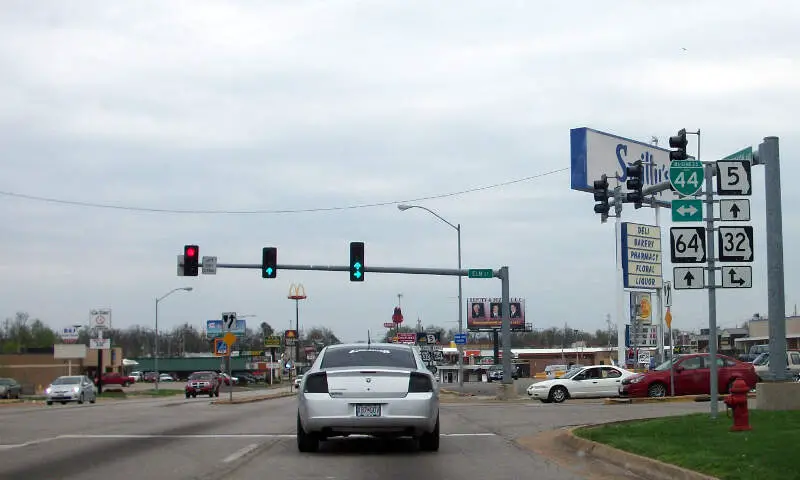
Joplin or is a city in southern Jasper County and northern Newton County in the southwestern corner of the U.S. state of Missouri. Joplin is the largest city in Jasper County, though it is not the county seat. As of the 2010 census, the city population was 50,150. Joplin is the main hub of the three-county Joplin-Miami, Oklahoma metropolitan area.
Data | Crime | Cost of living | Movers
0.6% Native American · 64 Native American residents
Smithville is a city in Clay and Platte counties in the U.S. state of Missouri, along the Little Platte River. The population was 8,425 at the 2010 United States Census.
Data | Crime | Cost of living | Movers
0.5% Native American · 59 Native American residents
Mexico, formerly known as New Mexico, is a city in Audrain County, Missouri. The population was 11,543 at the 2010 census. It is the county seat, home to the Missouri Military Academy, and annually hosts the Miss Missouri Pageant. The micropolitan statistical area consists of Audrain County.
Data | Crime | Cost of living | Movers
0.5% Native American · 78 Native American residents
Lebanon is a city in Laclede County, Missouri, United States. The population was 14,474 at the 2010 census. It is the county seat of Laclede County. The Lebanon Micropolitan Statistical Area consists of Laclede County.
Data | Crime | Cost of living | Movers
0.5% Native American · 64 Native American residents
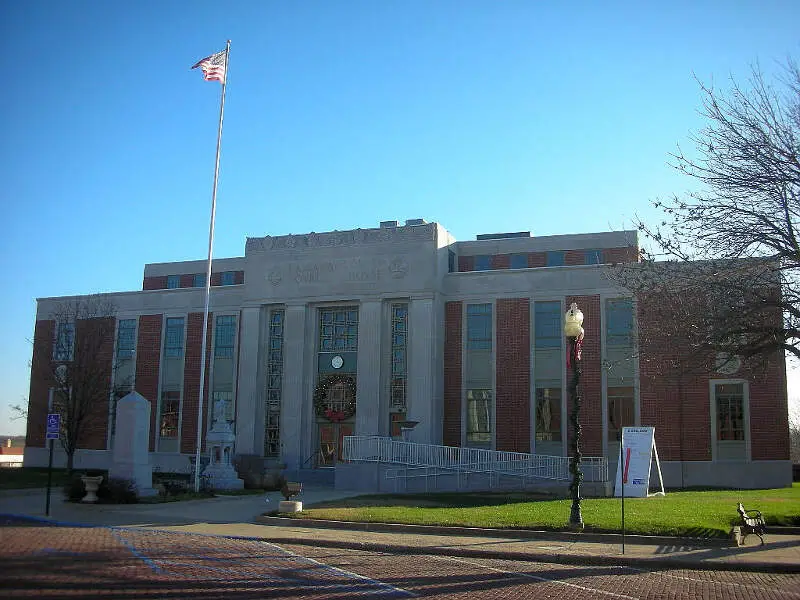
Fulton is the largest city in and the county seat of Callaway County, Missouri, United States. It is part of the Jefferson City, Missouri Metropolitan Statistical Area. The population was 12,790 in the 2010 census. The city is home to two universities, Westminster College and William Woods University, the Missouri School for the Deaf, the Fulton State Hospital, and Fulton Reception and Diagnostic Center.
Data | Crime | Cost of living | Movers
0.5% Native American · 48 Native American residents
Harrisonville is a city in Cass County, Missouri, United States. The population was 10,019 at the 2010 census. It is the county seat of Cass County.
Data | Crime | Cost of living | Movers
The receipts
Compare the top ten
Pick a metric. The bars rescale. The red line is Missouri’s statewide median.
On the map
Where Missouri’s Native American population is concentrated
Saturday Night Science
Methodology: How We Determined The Cities In Missouri With The Largest Native American Population For 2026
We still believe in the accuracy of data — especially from the Census. So that’s where we went to get the race breakdown across Missouri.
We used Saturday Night Science to analyze the Census’s most recently available data, the 2020-2024 American Community Survey data.
Specifically, we looked at table B03002: Hispanic OR LATINO ORIGIN BY RACE. Here are the category names as defined by the Census:
- Hispanic or Latino
- White alone
- Black or African American alone
- American Indian and Alaska Native alone
- Asian alone
- Native Hawaiian and Other Pacific Islander alone
- Some other race alone
- Two or more races
Our particular column of interest here was the number of people identifying as American Indian and Alaska Native alone.
We limited our analysis to places with a population greater than 5,000 people. That left us with 121 cities.
We then calculated the percentage of residents that are American Indian and Alaska Native. The percentages ranked from 1.16 to 0.00.
Finally, we ranked each city based on the percentage of the American Indian and Alaska Native population, with a higher score being more American Indian and Alaska Native than a lower score. Odessa took the distinction of being the most American Indian and Alaska Native, while St. John was the least Native American city.
We updated this article for 2026. This article is our eleventh time ranking the cities in Missouri with the largest Native American population.
The full plate
Most Native American Places In Missouri
Click any column to sort. Search by city name.
| Rank | City | Population | Native American Population | % Native American |
|---|---|---|---|---|
| 1 | Odessa | 5,620 | 65 | 1.2% |
| 2 | Carthage | 15,574 | 156 | 1.0% |
| 3 | Gladstone | 27,207 | 200 | 0.7% |
| 4 | Jackson | 15,659 | 106 | 0.7% |
| 5 | Joplin | 52,593 | 321 | 0.6% |
| 6 | Smithville | 10,705 | 64 | 0.6% |
| 7 | Mexico | 11,477 | 59 | 0.5% |
| 8 | Lebanon | 15,270 | 78 | 0.5% |
| 9 | Fulton | 12,617 | 64 | 0.5% |
| 10 | Harrisonville | 9,970 | 48 | 0.5% |
| 11 | Republic | 19,829 | 95 | 0.5% |
| 12 | Poplar Bluff | 16,254 | 76 | 0.5% |
| 13 | Kirksville | 17,563 | 78 | 0.4% |
| 14 | Neosho | 13,224 | 55 | 0.4% |
| 15 | Caruthersville | 5,326 | 22 | 0.4% |
| 16 | Richmond | 5,959 | 24 | 0.4% |
| 17 | Festus | 13,201 | 51 | 0.4% |
| 18 | Parkville | 8,366 | 28 | 0.3% |
| 19 | Cameron | 8,519 | 25 | 0.3% |
| 20 | Clayton | 17,380 | 49 | 0.3% |
| 21 | Chillicothe | 8,923 | 25 | 0.3% |
| 22 | Springfield | 169,954 | 474 | 0.3% |
| 23 | Jennings | 12,918 | 36 | 0.3% |
| 24 | Liberty | 30,689 | 84 | 0.3% |
| 25 | Jefferson City | 42,488 | 109 | 0.3% |
| 26 | Macon | 5,466 | 14 | 0.3% |
| 27 | Pacific | 7,475 | 19 | 0.3% |
| 28 | Rolla | 20,287 | 50 | 0.2% |
| 29 | Independence | 121,740 | 291 | 0.2% |
| 30 | Carl Junction | 8,339 | 19 | 0.2% |
| 31 | Cape Girardeau | 40,344 | 90 | 0.2% |
| 32 | Park Hills | 8,678 | 19 | 0.2% |
| 33 | Dexter | 7,891 | 17 | 0.2% |
| 34 | St. Joseph | 71,236 | 151 | 0.2% |
| 35 | Belton | 25,008 | 53 | 0.2% |
| 36 | Excelsior Springs | 10,484 | 22 | 0.2% |
| 37 | West Plains | 12,441 | 26 | 0.2% |
| 38 | Town and Country | 11,607 | 23 | 0.2% |
| 39 | Nixa | 24,836 | 49 | 0.2% |
| 40 | Grain Valley | 16,271 | 32 | 0.2% |
| 41 | Bolivar | 11,170 | 20 | 0.2% |
| 42 | Oak Grove | 8,538 | 15 | 0.2% |
| 43 | Washington | 15,130 | 26 | 0.2% |
| 44 | Branson | 12,817 | 22 | 0.2% |
| 45 | Raymore | 24,526 | 41 | 0.2% |
| 46 | St. Ann | 12,811 | 20 | 0.2% |
| 47 | De Soto | 6,470 | 10 | 0.2% |
| 48 | St. Louis | 288,512 | 433 | 0.2% |
| 49 | Webb City | 13,221 | 19 | 0.1% |
| 50 | Monett | 9,873 | 14 | 0.1% |
| 51 | Marshall | 13,739 | 19 | 0.1% |
| 52 | Hannibal | 16,771 | 23 | 0.1% |
| 53 | Lee’s Summit | 103,656 | 128 | 0.1% |
| 54 | Moberly | 13,526 | 16 | 0.1% |
| 55 | Maryville | 10,428 | 12 | 0.1% |
| 56 | Sullivan | 6,310 | 7 | 0.1% |
| 57 | Black Jack | 6,589 | 7 | 0.1% |
| 58 | Webster Groves | 23,712 | 24 | 0.1% |
| 59 | Kansas City | 510,612 | 511 | 0.1% |
| 60 | Aurora | 7,397 | 7 | 0.1% |
| 61 | Warrensburg | 19,582 | 18 | 0.1% |
| 62 | Marshfield | 7,696 | 7 | 0.1% |
| 63 | Ellisville | 10,002 | 9 | 0.1% |
| 64 | Grandview | 26,527 | 23 | 0.1% |
| 65 | University City | 34,685 | 29 | 0.1% |
| 66 | Chesterfield | 49,574 | 41 | 0.1% |
| 67 | Blue Springs | 59,965 | 48 | 0.1% |
| 68 | Shrewsbury | 6,316 | 5 | 0.1% |
| 69 | Warrenton | 9,066 | 7 | 0.1% |
| 70 | Overland | 15,695 | 12 | 0.1% |
| 71 | Valley Park | 6,795 | 5 | 0.1% |
| 72 | Bonne Terre | 6,683 | 4 | 0.1% |
| 73 | St. Charles | 71,508 | 42 | 0.1% |
| 74 | Ozark | 22,417 | 13 | 0.1% |
| 75 | O’Fallon | 93,801 | 52 | 0.1% |
| 76 | Trenton | 5,536 | 3 | 0.1% |
| 77 | Columbia | 128,548 | 66 | 0.1% |
| 78 | Lake St. Louis | 18,066 | 7 | 0.0% |
| 79 | Troy | 13,947 | 5 | 0.0% |
| 80 | Arnold | 20,956 | 7 | 0.0% |
| 81 | Pevely | 6,055 | 2 | 0.0% |
| 82 | Battlefield | 6,165 | 2 | 0.0% |
| 83 | Ballwin | 31,279 | 10 | 0.0% |
| 84 | Sedalia | 22,003 | 7 | 0.0% |
| 85 | Wildwood | 35,133 | 11 | 0.0% |
| 86 | Farmington | 18,282 | 5 | 0.0% |
| 87 | Bridgeton | 11,369 | 3 | 0.0% |
| 88 | Florissant | 51,773 | 13 | 0.0% |
| 89 | Brentwood | 8,144 | 2 | 0.0% |
| 90 | Kirkwood | 29,363 | 7 | 0.0% |
| 91 | Union | 12,781 | 3 | 0.0% |
| 92 | Perryville | 8,536 | 2 | 0.0% |
| 93 | Olivette | 8,645 | 2 | 0.0% |
| 94 | Wentzville | 47,061 | 9 | 0.0% |
| 95 | Ferguson | 18,213 | 3 | 0.0% |
| 96 | Dardenne Prairie | 13,503 | 2 | 0.0% |
| 97 | Des Peres | 9,170 | 1 | 0.0% |
| 98 | Maryland Heights | 27,880 | 3 | 0.0% |
| 99 | Eureka | 13,081 | 1 | 0.0% |
| 100 | St. Peters | 59,092 | 4 | 0.0% |
Source: U.S. Census ACS 2020-2024, table B03002. 121 Missouri cities with more than 5,000 residents.
Summary
Summary: Native American Populations Across Missouri
If you’re looking for a breakdown of Native American populations across Missouri according to the most recent data, this is an accurate list.
The most Native American cities in Missouri are Odessa, Carthage, Gladstone, Jackson, Joplin, Smithville, Mexico, Lebanon, Fulton, and Harrisonville.


