Most Native American places in South Carolina research summary. We used Saturday Night Science to research the South Carolina cities with the highest percentage of Native American residents for 2026. The data comes from the American Community Survey 2020-2024 vintage, which breaks down race by origin.
-
The city with the highest percentage of Native Americans is Bennettsville. 1.26% of people in Bennettsville are Native Americans.
-
The city with the lowest percentage of Native Americans is Hilton Head Island. 0.00% of people in Hilton Head Island are Native American.
-
The city with the most Native Americans is Anderson. 238 people in Anderson are Native American.
-
The city with the fewest Native Americans is Hilton Head Island. 0 people in Hilton Head Island are Native American.
-
The United States has 1,698,432 Native Americans and is 0.51% Native American.
Table Of Contents: Top Ten | Methodology | Summary | Table
The 10 Cities In South Carolina With The Largest Native American Population For 2026
Which city in South Carolina had the largest Native American population? The place with the largest Native American population in South Carolina for 2026 is Bennettsville. 1.26 of Bennettsville identify as Native American.
To see where South Carolina ranked as a state on diversity, we have a ranking of the most diverse states in America.
And if you already knew these places were Native American, check out the best places to live in South Carolina or the most diverse places in South Carolina.
Read below to see how we crunched the numbers and how your town ranked.
Cities In South Carolina With The Largest Native American Population For 2026

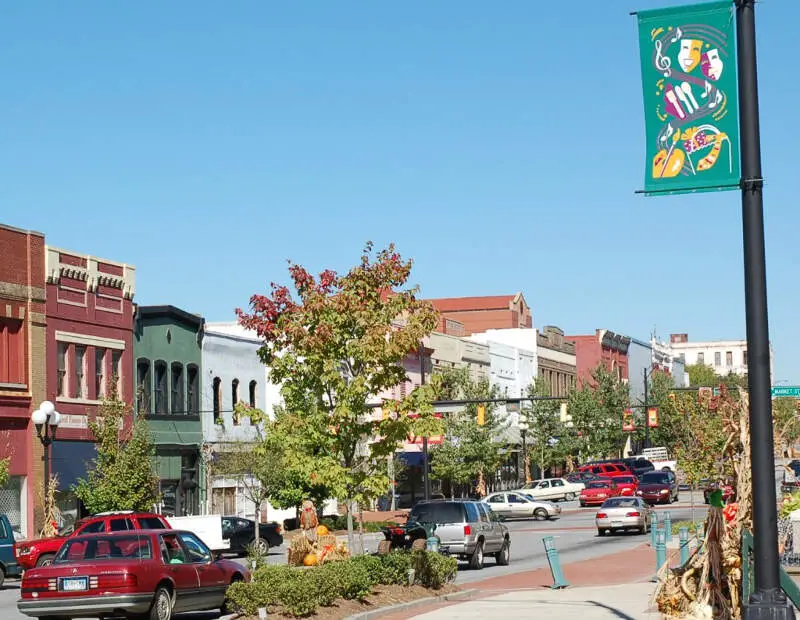
/10
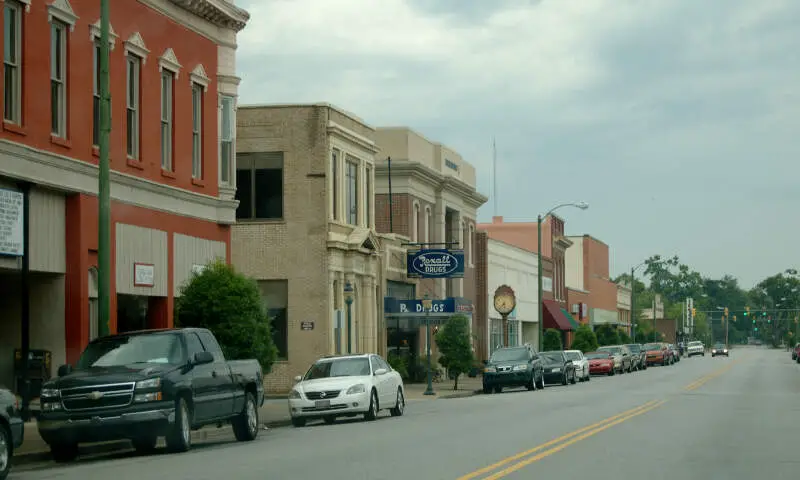
Population: 7,751
# Of Native American Residents: 98
% Native American: 1.26%
More on Bennettsville: Data | Crime | Cost Of Living | Movers

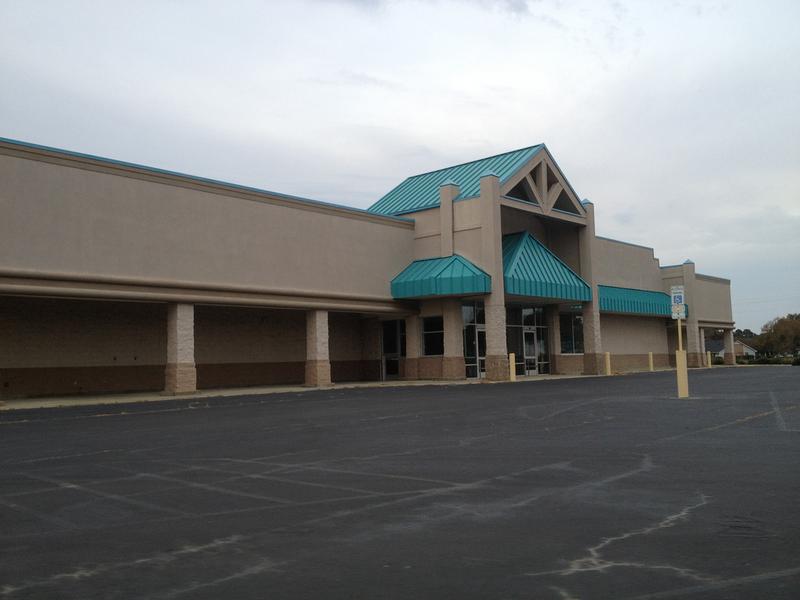
/10
Population: 30,051
# Of Native American Residents: 238
% Native American: 0.79%
More on Anderson: Data | Crime | Cost Of Living | Movers

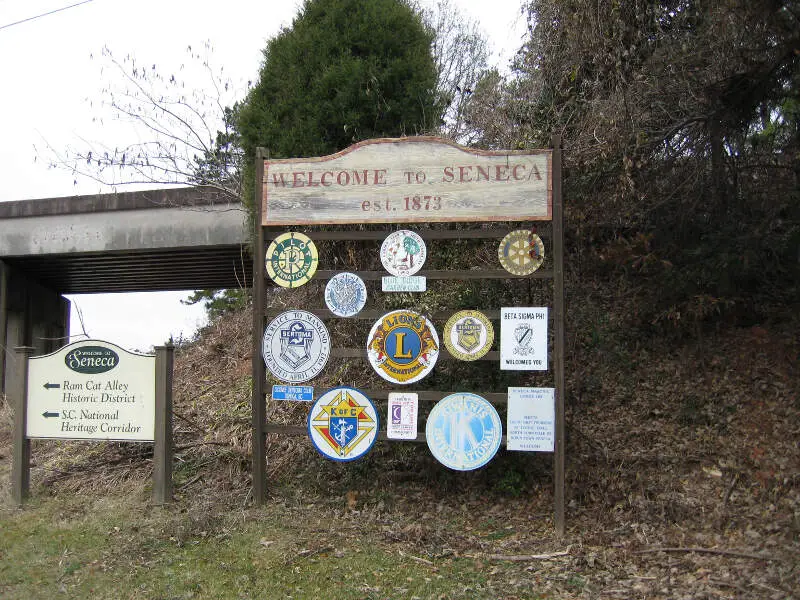
/10
Population: 8,993
# Of Native American Residents: 69
% Native American: 0.77%
More on Seneca: Data | Crime | Cost Of Living | Movers

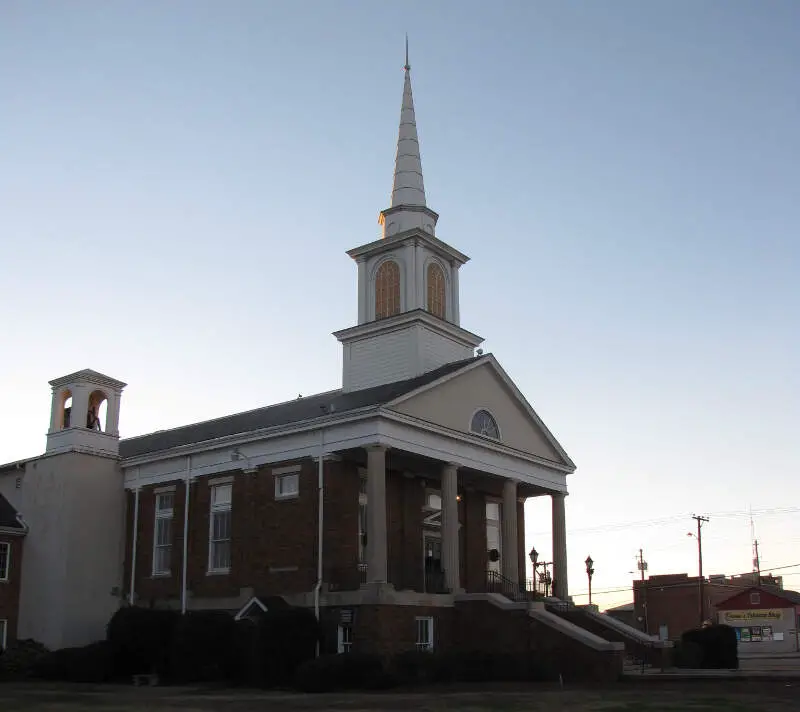
/10
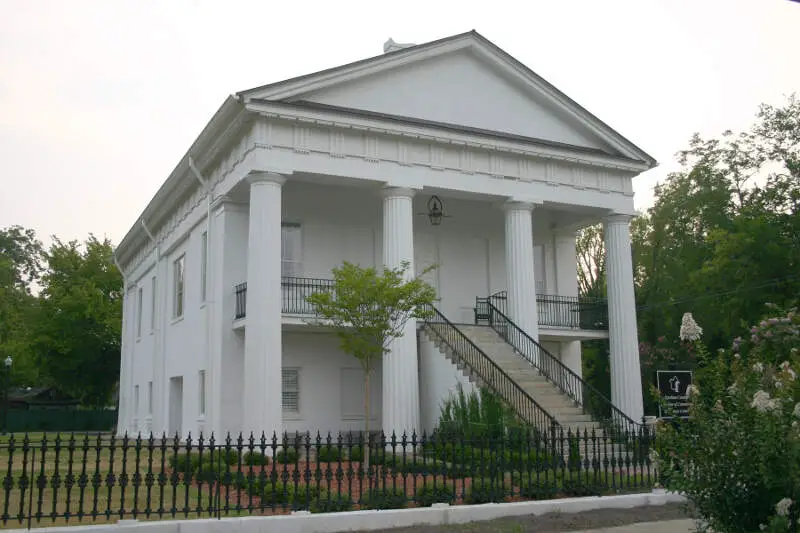
Population: 6,354
# Of Native American Residents: 47
% Native American: 0.74%
More on Dillon: Data | Cost Of Living | Movers

/10
Population: 6,206
# Of Native American Residents: 41
% Native American: 0.66%
More on Marion: Data | Crime | Cost Of Living | Movers

/10
Population: 15,485
# Of Native American Residents: 100
% Native American: 0.65%
More on Moncks Corner: Data | Crime | Cost Of Living | Movers

/10
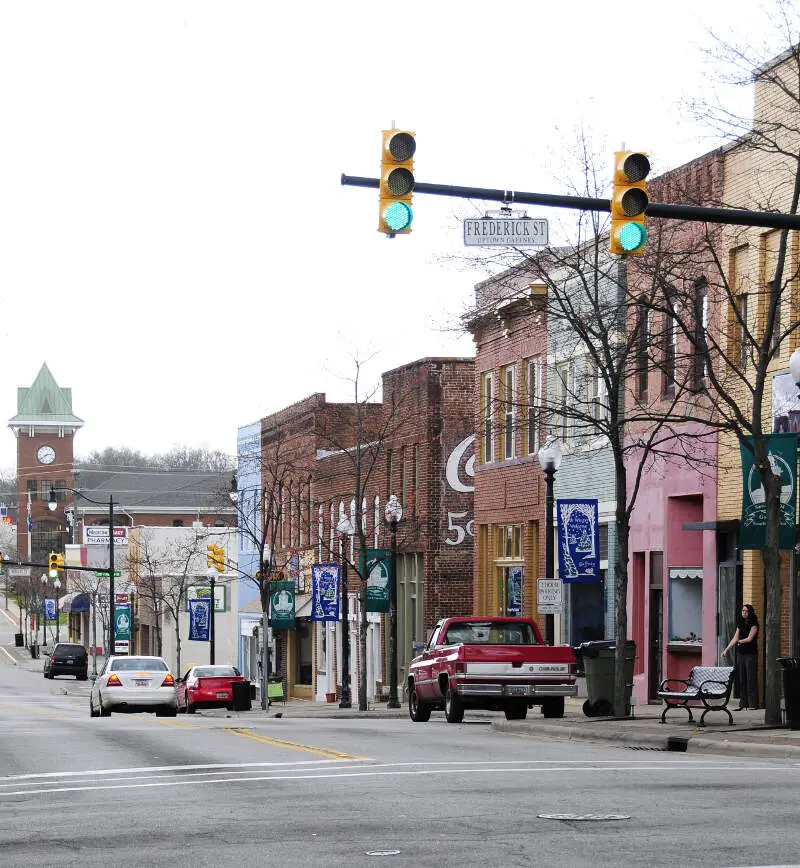
Population: 12,596
# Of Native American Residents: 79
% Native American: 0.63%
More on Gaffney: Data | Crime | Cost Of Living | Movers

/10
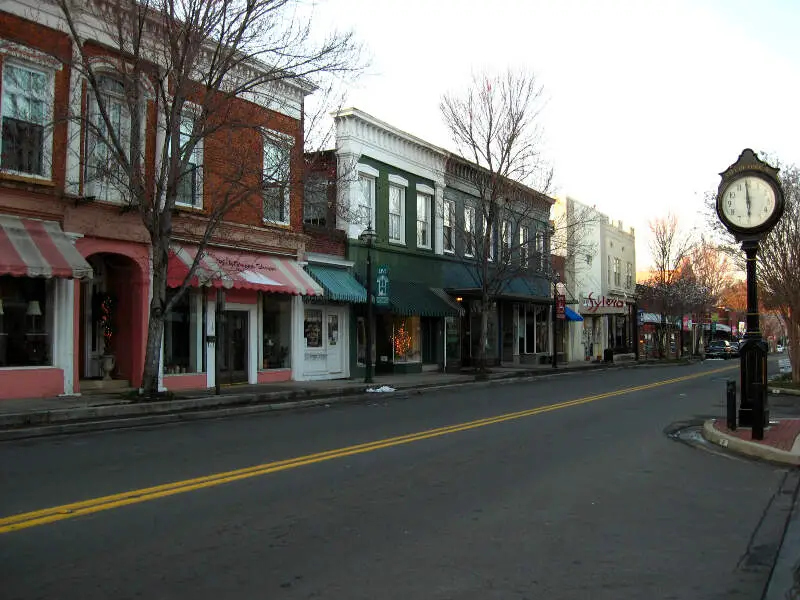
Population: 8,267
# Of Native American Residents: 31
% Native American: 0.37%
More on Camden: Data | Crime | Cost Of Living | Movers

/10
Population: 8,969
# Of Native American Residents: 32
% Native American: 0.36%
More on York: Data | Crime | Cost Of Living | Movers


/10
Population: 21,452
# Of Native American Residents: 67
% Native American: 0.31%
More on Hanahan: Data | Crime | Cost Of Living | Movers
Methodology: How We Determined The Cities In South Carolina With The Largest Native American Population For 2026
We still believe in the accuracy of data — especially from the Census. So that’s where we went to get the race breakdown across South Carolina.
We used Saturday Night Science to analyze the Census’s most recently available data, the 2020-2024 American Community Survey data.
Specifically, we looked at table B03002: Hispanic OR LATINO ORIGIN BY RACE. Here are the category names as defined by the Census:
- Hispanic or Latino
- White alone*
- Black or African American alone*
- American Indian and Alaska Native alone*
- Asian alone*
- Native Hawaiian and Other Pacific Islander alone*
- Some other race alone*
- Two or more races*
Our particular column of interest here was the number of people identifying as American Indian and Alaska Native alone.
We limited our analysis to places with a population greater than 5,000 people. That left us with 56 cities.
We then calculated the percentage of residents that are American Indian and Alaska Native. The percentages ranked from 1.26 to 0.00.
Finally, we ranked each city based on the percentage of the American Indian and Alaska Native population, with a higher score being more American Indian and Alaska Native than a lower score. Bennettsville took the distinction of being the most American Indian and Alaska Native, while Hilton Head Island was the least Native American city.
We updated this article for 2026. This article is our eleventh time ranking the cities in South Carolina with the largest Native American population.
Summary: Native American Populations Across South Carolina
If you’re looking for a breakdown of Native American populations across South Carolina according to the most recent data, this is an accurate list.
The most Native American cities in South Carolina are Bennettsville, Anderson, Seneca, Dillon, Marion, Moncks Corner, Gaffney, Camden, York, and Hanahan.
If you’re curious enough, here are the least Native American places in South Carolina:
- Hilton Head Island
- Mauldin
- Chester
For more South Carolina reading, check out:
- Safest Places In South Carolina
- Richest Cities In South Carolina
- Best Places To Retire In South Carolina
Most Native American Places In South Carolina
| Rank | City | Population | Native American Population | % Native American |
|---|---|---|---|---|
| 1 | Bennettsville | 7,751 | 98 | 1.26% |
| 2 | Anderson | 30,051 | 238 | 0.79% |
| 3 | Seneca | 8,993 | 69 | 0.77% |
| 4 | Dillon | 6,354 | 47 | 0.74% |
| 5 | Marion | 6,206 | 41 | 0.66% |
| 6 | Moncks Corner | 15,485 | 100 | 0.65% |
| 7 | Gaffney | 12,596 | 79 | 0.63% |
| 8 | Camden | 8,267 | 31 | 0.37% |
| 9 | York | 8,969 | 32 | 0.36% |
| 10 | Hanahan | 21,452 | 67 | 0.31% |
| 11 | Summerville | 51,654 | 145 | 0.28% |
| 12 | Orangeburg | 13,253 | 36 | 0.27% |
| 13 | North Myrtle Beach | 19,855 | 51 | 0.26% |
| 14 | Fountain Inn | 12,020 | 30 | 0.25% |
| 15 | Laurens | 9,336 | 23 | 0.25% |
| 16 | Greenville | 72,935 | 167 | 0.23% |
| 17 | Rock Hill | 75,259 | 170 | 0.23% |
| 18 | Aiken | 32,521 | 69 | 0.21% |
| 19 | West Columbia | 17,963 | 34 | 0.19% |
| 20 | Beaufort | 13,747 | 25 | 0.18% |
| 21 | Simpsonville | 26,144 | 46 | 0.18% |
| 22 | Goose Creek | 48,078 | 82 | 0.17% |
| 23 | Lancaster | 8,921 | 14 | 0.16% |
| 24 | North Augusta | 25,653 | 39 | 0.15% |
| 25 | Columbia | 139,643 | 174 | 0.12% |
| 26 | Spartanburg | 38,910 | 34 | 0.09% |
| 27 | Charleston | 154,338 | 133 | 0.09% |
| 28 | Conway | 27,263 | 23 | 0.08% |
| 29 | Myrtle Beach | 38,371 | 32 | 0.08% |
| 30 | Florence | 40,408 | 33 | 0.08% |
| 31 | Sumter | 43,053 | 34 | 0.08% |
| 32 | North Charleston | 119,913 | 81 | 0.07% |
| 33 | Hartsville | 7,419 | 5 | 0.07% |
| 34 | Cayce | 13,741 | 8 | 0.06% |
| 35 | Easley | 24,841 | 13 | 0.05% |
| 36 | Fort Mill | 30,775 | 16 | 0.05% |
| 37 | Clemson | 18,072 | 8 | 0.04% |
| 38 | Lexington | 24,585 | 9 | 0.04% |
| 39 | Mount Pleasant | 93,993 | 28 | 0.03% |
| 40 | Irmo | 11,813 | 2 | 0.02% |
| 41 | Greer | 41,536 | 6 | 0.01% |
| 42 | Bluffton | 33,157 | 4 | 0.01% |
| 43 | Darlington | 6,120 | 0 | 0.0% |
| 44 | Georgetown | 8,565 | 0 | 0.0% |
| 45 | Walterboro | 5,480 | 0 | 0.0% |
| 46 | Union | 8,079 | 0 | 0.0% |
| 47 | Tega Cay | 13,615 | 0 | 0.0% |
| 48 | Greenwood | 22,536 | 0 | 0.0% |
| 49 | Newberry | 10,790 | 0 | 0.0% |
| 50 | Forest Acres | 10,530 | 0 | 0.0% |
| 51 | Lake City | 5,988 | 0 | 0.0% |
| 52 | Port Royal | 15,579 | 0 | 0.0% |
| 53 | Clinton | 7,676 | 0 | 0.0% |
| 54 | Chester | 5,218 | 0 | 0.0% |
| 55 | Mauldin | 27,055 | 0 | 0.0% |
| 56 | Hilton Head Island | 37,911 | 0 | 0.0% |


