Most Native American places in Wisconsin research summary. We used Saturday Night Science to research the Wisconsin cities with the highest percentage of Native American residents for 2026. The data comes from the American Community Survey 2020-2024 vintage, which breaks down race by origin.
-
The city with the highest percentage of Native Americans is Shawano. 7.55% of people in Shawano are Native Americans.
-
The city with the lowest percentage of Native Americans is Sheboygan Falls. 0.00% of people in Sheboygan Falls are Native American.
-
The city with the most Native Americans is Green Bay. 2,758 people in Green Bay are Native American.
-
The city with the fewest Native Americans is Sheboygan Falls. 0 people in Sheboygan Falls are Native American.
-
The United States has 1,698,432 Native Americans and is 0.51% Native American.
Table Of Contents: Top Ten | Methodology | Summary | Table
The 10 Cities In Wisconsin With The Largest Native American Population For 2026
Which city in Wisconsin had the largest Native American population? The place with the largest Native American population in Wisconsin for 2026 is Shawano. 7.55 of Shawano identify as Native American.
To see where Wisconsin ranked as a state on diversity, we have a ranking of the most diverse states in America.
And if you already knew these places were Native American, check out the best places to live in Wisconsin or the most diverse places in Wisconsin.
Read below to see how we crunched the numbers and how your town ranked.
Cities In Wisconsin With The Largest Native American Population For 2026

/10
Population: 9,522
# Of Native American Residents: 719
% Native American: 7.55%
More on Shawano: Data | Crime | Cost Of Living | Movers

/10
Population: 7,902
# Of Native American Residents: 541
% Native American: 6.85%
More on Ashland: Data | Crime | Cost Of Living | Movers

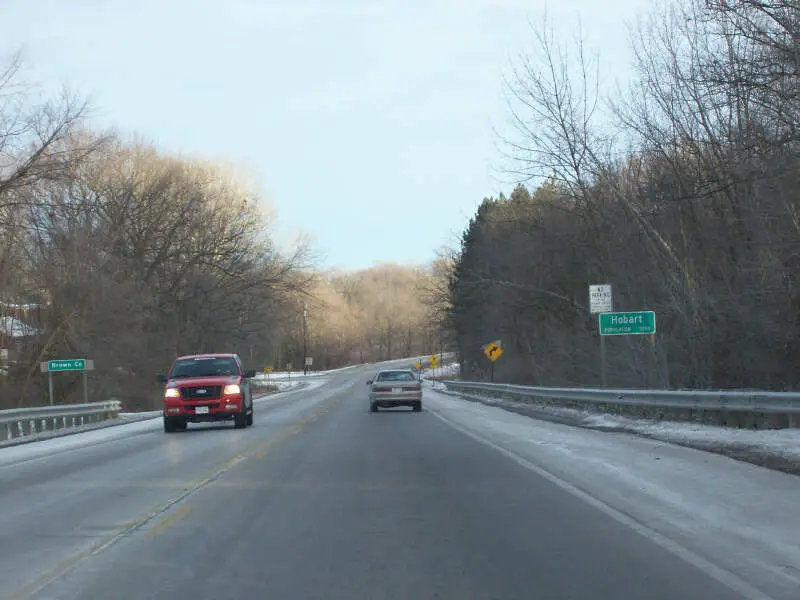
/10
Population: 10,610
# Of Native American Residents: 551
% Native American: 5.19%
More on Hobart: Data | Cost Of Living | Movers

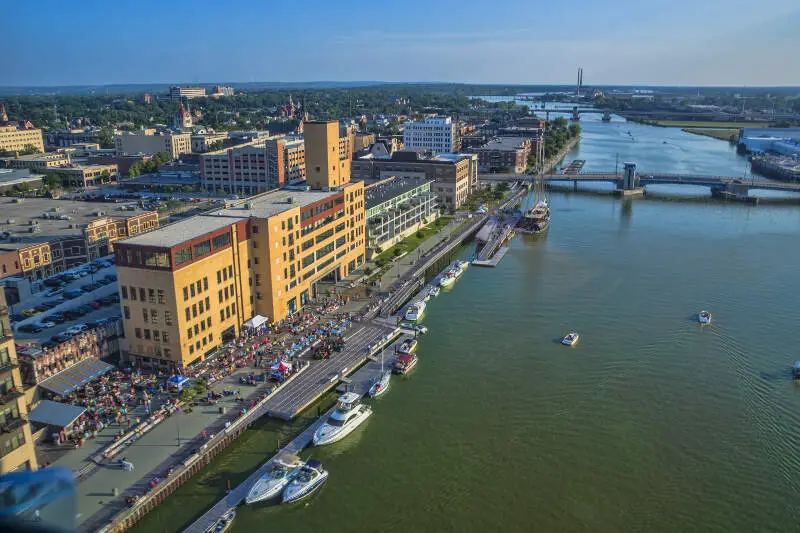
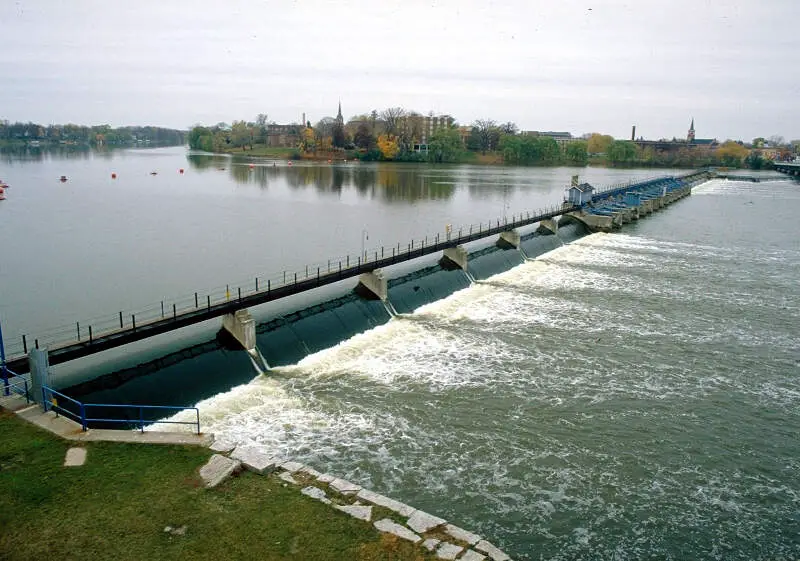
/10
Population: 106,253
# Of Native American Residents: 2,758
% Native American: 2.6%
More on Green Bay: Data | Crime | Cost Of Living | Movers

/10
Population: 25,301
# Of Native American Residents: 389
% Native American: 1.54%
More on De Pere: Data | Crime | Cost Of Living | Movers

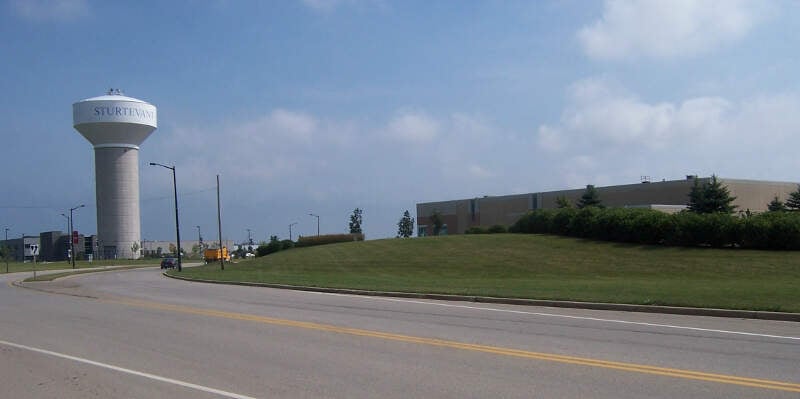
/10
Population: 6,772
# Of Native American Residents: 96
% Native American: 1.42%
More on Sturtevant: Data | Crime | Cost Of Living | Movers

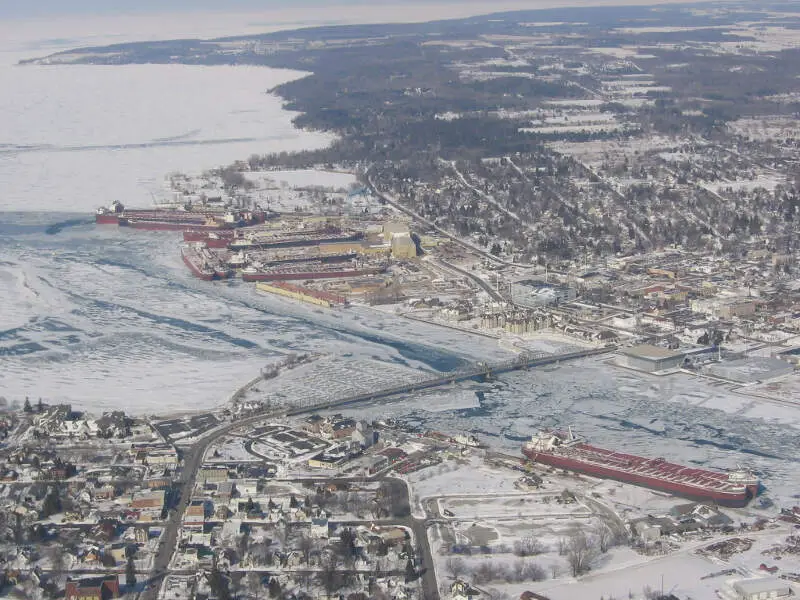
/10
Population: 9,806
# Of Native American Residents: 109
% Native American: 1.11%
More on Sturgeon Bay: Data | Crime | Cost Of Living | Movers

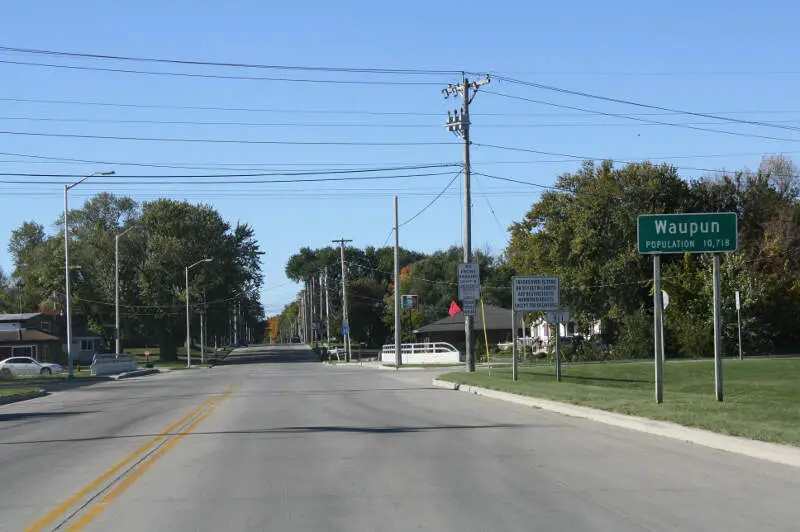
/10
Population: 11,174
# Of Native American Residents: 110
% Native American: 0.98%
More on Waupun: Data | Crime | Cost Of Living | Movers

/10
Population: 26,677
# Of Native American Residents: 255
% Native American: 0.96%
More on Superior: Data | Crime | Cost Of Living | Movers

/10
Population: 17,314
# Of Native American Residents: 165
% Native American: 0.95%
More on Ashwaubenon: Data | Crime | Cost Of Living | Movers
Methodology: How We Determined The Cities In Wisconsin With The Largest Native American Population For 2026
We still believe in the accuracy of data — especially from the Census. So that’s where we went to get the race breakdown across Wisconsin.
We used Saturday Night Science to analyze the Census’s most recently available data, the 2020-2024 American Community Survey data.
Specifically, we looked at table B03002: Hispanic OR LATINO ORIGIN BY RACE. Here are the category names as defined by the Census:
- Hispanic or Latino
- White alone*
- Black or African American alone*
- American Indian and Alaska Native alone*
- Asian alone*
- Native Hawaiian and Other Pacific Islander alone*
- Some other race alone*
- Two or more races*
Our particular column of interest here was the number of people identifying as American Indian and Alaska Native alone.
We limited our analysis to places with a population greater than 5,000 people. That left us with 137 cities.
We then calculated the percentage of residents that are American Indian and Alaska Native. The percentages ranked from 7.55 to 0.00.
Finally, we ranked each city based on the percentage of the American Indian and Alaska Native population, with a higher score being more American Indian and Alaska Native than a lower score. Shawano took the distinction of being the most American Indian and Alaska Native, while Sheboygan Falls was the least Native American city.
We updated this article for 2026. This article is our eleventh time ranking the cities in Wisconsin with the largest Native American population.
Summary: Native American Populations Across Wisconsin
If you’re looking for a breakdown of Native American populations across Wisconsin according to the most recent data, this is an accurate list.
The most Native American cities in Wisconsin are Shawano, Ashland, Hobart, Green Bay, De Pere, Sturtevant, Sturgeon Bay, Waupun, Superior, and Ashwaubenon.
If you’re curious enough, here are the least Native American places in Wisconsin:
- Sheboygan Falls
- Mcfarland
- Elm Grove
For more Wisconsin reading, check out:
Most Native American Places In Wisconsin
| Rank | City | Population | Native American Population | % Native American |
|---|---|---|---|---|
| 1 | Shawano | 9,522 | 719 | 7.55% |
| 2 | Ashland | 7,902 | 541 | 6.85% |
| 3 | Hobart | 10,610 | 551 | 5.19% |
| 4 | Green Bay | 106,253 | 2,758 | 2.6% |
| 5 | De Pere | 25,301 | 389 | 1.54% |
| 6 | Sturtevant | 6,772 | 96 | 1.42% |
| 7 | Sturgeon Bay | 9,806 | 109 | 1.11% |
| 8 | Waupun | 11,174 | 110 | 0.98% |
| 9 | Superior | 26,677 | 255 | 0.96% |
| 10 | Ashwaubenon | 17,314 | 165 | 0.95% |
| 11 | Tomah | 9,532 | 90 | 0.94% |
| 12 | Chippewa Falls | 14,782 | 139 | 0.94% |
| 13 | Little Chute | 11,754 | 86 | 0.73% |
| 14 | South Milwaukee | 20,442 | 136 | 0.67% |
| 15 | Berlin | 5,562 | 35 | 0.63% |
| 16 | Rhinelander | 8,316 | 52 | 0.63% |
| 17 | Onalaska | 19,348 | 116 | 0.6% |
| 18 | Kaukauna | 17,706 | 104 | 0.59% |
| 19 | Glendale | 13,656 | 75 | 0.55% |
| 20 | Portage | 10,236 | 54 | 0.53% |
| 21 | Menasha | 18,273 | 95 | 0.52% |
| 22 | Prairie Du Chien | 5,491 | 27 | 0.49% |
| 23 | Baraboo | 12,769 | 59 | 0.46% |
| 24 | Sparta | 9,950 | 45 | 0.45% |
| 25 | Antigo | 8,069 | 36 | 0.45% |
| 26 | Wauwatosa | 48,529 | 207 | 0.43% |
| 27 | Waterford | 5,692 | 23 | 0.4% |
| 28 | Shorewood | 13,627 | 53 | 0.39% |
| 29 | Oshkosh | 66,729 | 246 | 0.37% |
| 30 | Milwaukee | 566,973 | 1,972 | 0.35% |
| 31 | Whitewater | 15,807 | 54 | 0.34% |
| 32 | Lake Hallie | 7,285 | 24 | 0.33% |
| 33 | Appleton | 75,023 | 237 | 0.32% |
| 34 | West Allis | 59,612 | 184 | 0.31% |
| 35 | Allouez | 13,975 | 42 | 0.3% |
| 36 | Suamico | 12,985 | 39 | 0.3% |
| 37 | New Richmond | 10,539 | 27 | 0.26% |
| 38 | Eau Claire | 70,322 | 171 | 0.24% |
| 39 | Oconomowoc | 19,080 | 46 | 0.24% |
| 40 | Whitefish Bay | 14,665 | 35 | 0.24% |
| 41 | New London | 7,726 | 18 | 0.23% |
| 42 | Fond Du Lac | 44,494 | 103 | 0.23% |
| 43 | La Crosse | 51,356 | 117 | 0.23% |
| 44 | Mequon | 25,270 | 57 | 0.23% |
| 45 | Ripon | 7,772 | 17 | 0.22% |
| 46 | Waupaca | 6,283 | 13 | 0.21% |
| 47 | Verona | 15,232 | 31 | 0.2% |
| 48 | Germa | 20,962 | 42 | 0.2% |
| 49 | Rice Lake | 9,030 | 18 | 0.2% |
| 50 | Racine | 77,633 | 151 | 0.19% |
| 51 | Greendale | 14,594 | 28 | 0.19% |
| 52 | Weston | 15,749 | 30 | 0.19% |
| 53 | Wisconsin Rapids | 18,722 | 35 | 0.19% |
| 54 | Franklin | 35,886 | 65 | 0.18% |
| 55 | Reedsburg | 10,168 | 18 | 0.18% |
| 56 | Neenah | 27,336 | 47 | 0.17% |
| 57 | Hartford | 15,821 | 27 | 0.17% |
| 58 | Stoughton | 13,033 | 22 | 0.17% |
| 59 | Fitchburg | 32,619 | 55 | 0.17% |
| 60 | Madison | 278,001 | 457 | 0.16% |
| 61 | Lake Geneva | 8,521 | 14 | 0.16% |
| 62 | Beaver Dam | 16,565 | 27 | 0.16% |
| 63 | Mayville | 5,228 | 8 | 0.15% |
| 64 | Sheboygan | 49,645 | 74 | 0.15% |
| 65 | Kenosha | 99,372 | 142 | 0.14% |
| 66 | Port Washington | 12,645 | 17 | 0.13% |
| 67 | West Bend | 32,030 | 43 | 0.13% |
| 68 | Wausau | 39,996 | 53 | 0.13% |
| 69 | Brookfield | 41,273 | 54 | 0.13% |
| 70 | Muskego | 25,406 | 33 | 0.13% |
| 71 | Pleasant Prairie | 21,669 | 27 | 0.12% |
| 72 | Milton | 5,706 | 7 | 0.12% |
| 73 | Merrill | 9,356 | 11 | 0.12% |
| 74 | Greenfield | 37,345 | 42 | 0.11% |
| 75 | Marinette | 11,115 | 12 | 0.11% |
| 76 | Two Rivers | 11,231 | 12 | 0.11% |
| 77 | Sussex | 12,066 | 12 | 0.1% |
| 78 | Oak Creek | 37,325 | 37 | 0.1% |
| 79 | Elkhorn | 10,221 | 10 | 0.1% |
| 80 | Bellevue | 16,442 | 16 | 0.1% |
| 81 | New Berlin | 40,270 | 39 | 0.1% |
| 82 | Watertown | 22,774 | 20 | 0.09% |
| 83 | Waukesha | 71,233 | 59 | 0.08% |
| 84 | Twin Lakes | 6,309 | 5 | 0.08% |
| 85 | Altoona | 8,878 | 7 | 0.08% |
| 86 | Janesville | 66,030 | 52 | 0.08% |
| 87 | Plymouth | 8,890 | 7 | 0.08% |
| 88 | Oregon | 11,547 | 9 | 0.08% |
| 89 | River Falls | 16,719 | 13 | 0.08% |
| 90 | Kronenwetter | 8,395 | 6 | 0.07% |
| 91 | Cedarburg | 12,605 | 9 | 0.07% |
| 92 | Howard | 21,087 | 15 | 0.07% |
| 93 | Hartland | 9,972 | 7 | 0.07% |
| 94 | Manitowoc | 34,620 | 23 | 0.07% |
| 95 | Caledonia | 25,257 | 15 | 0.06% |
| 96 | Stevens Point | 25,785 | 15 | 0.06% |
| 97 | Delafield | 7,202 | 4 | 0.06% |
| 98 | Marshfield | 18,700 | 10 | 0.05% |
| 99 | Hales Corners | 7,689 | 4 | 0.05% |
| 100 | Fort Atkinson | 12,463 | 6 | 0.05% |


