Welcome to the happiest places in North Carolina.
Using Saturday Night Science and data, we determined the cities and towns with the most rainbows, butterflies, puppies, and unicorns.
You know, the places where people have jobs, white-picked fences, and friendly neighbors – unicorn cities.
After analyzing the 142 largest cities, we happily present the happiest cities in the Tar Heel State.
Table Of Contents: Top Ten | Methodology | Summary | Table
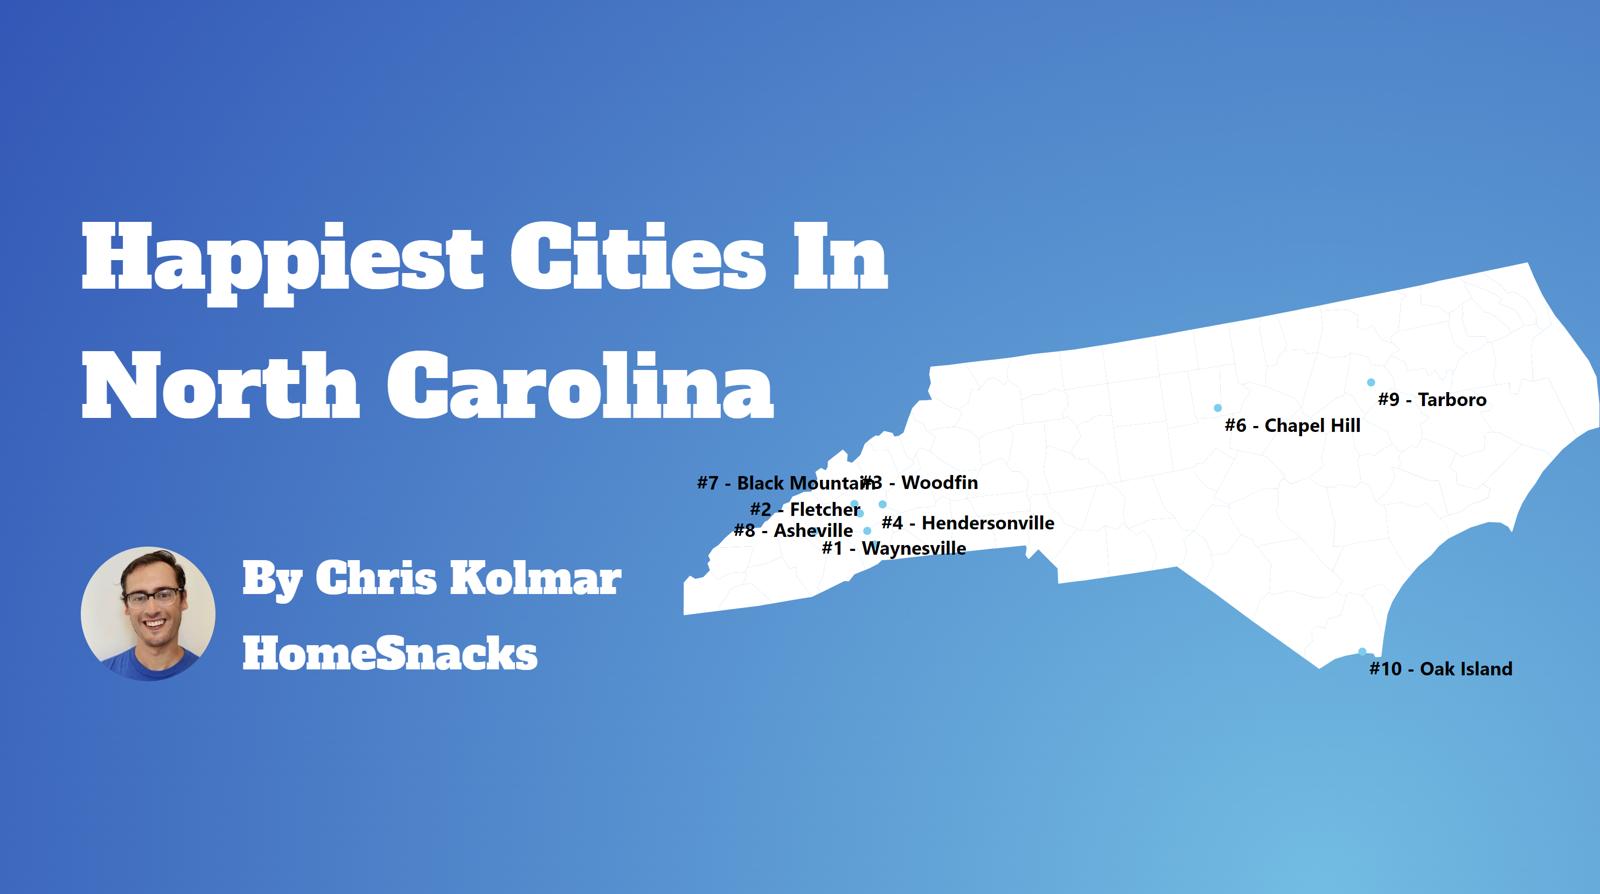
The 10 Happiest Places In North Carolina
Read on below to see how we crunched the numbers and how your town ranked. If you have a smile on your face, you probably live in one of these cities.
Oh, and by the way, Zebulon is the most miserable place in North Carolina.
For more North Carolina reading, check out:
The 10 Happiest Places In North Carolina For 2026
/10
Population: 9,806
Poverty Level: 18.1%
Median Home Price $410,236
Married Households 19.0%
Households With Kids 22.87%
More on Morehead City: Data | Crime | Cost Of Living | Movers
Morehead City is by far the happiest place in the state of North Carolina. Let’s see why.
First off, having a solid family life is a good indication of how happy someone is. Lots of the residents of Morehead City aren’t missing out on love; more than 19% of them are married. Plus, the average commute time here is only about 18 minutes each way. That means a lot more time with the spouse and kids.

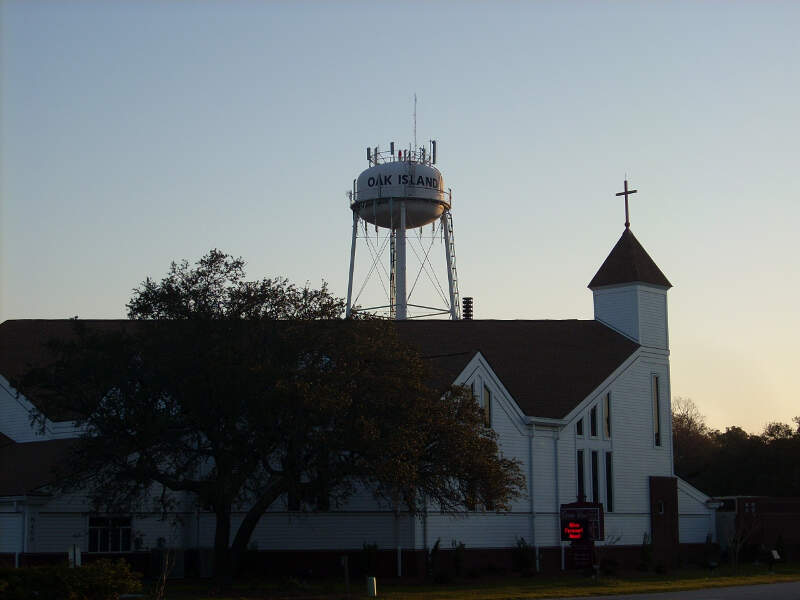
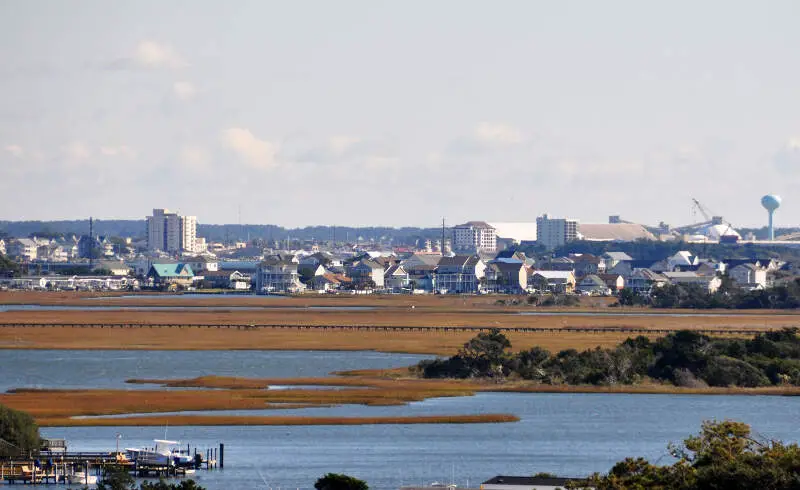
/10
Population: 9,030
Poverty Level: 8.7%
Median Home Price $568,671
Married Households 28.0%
Households With Kids 8.82%
More on Oak Island: Data | Crime | Cost Of Living | Movers
Things look to be pretty pleasant in Oak Island. Crime is really low here, and the percentage of married residents (28%) mean there’s lots of stability at home.
In addition to those factors, there is a thriving amount of community involvement. Studies have shown that a key factor to happiness is when people volunteer, especially in their own neighborhoods.

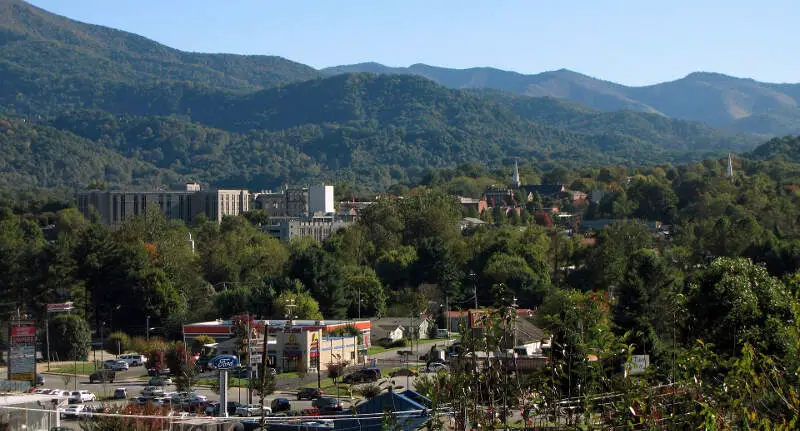
/10
Population: 10,502
Poverty Level: 15.9%
Median Home Price $355,351
Married Households 19.0%
Households With Kids 19.96%
More on Waynesville: Data | Crime | Cost Of Living | Movers
The people who live in Waynesville have a lot going for them. 34% of them have college degrees, and they command some of the highest salaries in NC. 19% of the people here are married.
Most of these all tops in the entire state.

/10
Population: 7,897
Poverty Level: 15.1%
Median Home Price $464,517
Married Households 13.0%
Households With Kids 18.39%
More on Brevard: Data | Crime | Cost Of Living | Movers
Brevard is where you can bet there are lots of smiley and happy people all over town. Crime is essentially something that just doesn’t happen here very often. And when you can let your guard down and relax a little, the lack of stress really makes a difference.
Same goes on the job front. Only 3.6% of residents here are out of work. Sounds like there are jobs for just about everyone who wants one. Which must be a good feeling to have.

/10
Population: 61,607
Poverty Level: 18.6%
Median Home Price $631,166
Married Households 6.0%
Households With Kids 23.83%
More on Chapel Hill: Data | Crime | Cost Of Living | Movers
If you want to see a bunch of happy people, go to Chapel Hill. It seriously looks like something out of a commercial.
They have a 19 minute commute time, which means lots more time with the kids.

/10
Population: 20,032
Poverty Level: 51.2%
Median Home Price $483,788
Married Households 6.0%
Households With Kids 9.82%
More on Boone: Data | Crime | Cost Of Living | Movers
For those who say that money doesn’t buy happiness, you’re half right. Studies have shown that people are happy up to a certain point when it comes to annual salaries, somewhere around $72,000 a year. After that, it doesn’t matter how much you make, you’re not going to be much happier.
The residents of Boone have that covered. Plus about 6% of households are married.

/10
Population: 9,726
Poverty Level: 23.1%
Median Home Price $242,528
Married Households 26.0%
Households With Kids 24.36%
More on Washington: Data | Crime | Cost Of Living | Movers
Most of the people in Washington have to be âplum’ happy. True happiness is âHome Sweet Home’ with your kids and spouse, being reminded to do chores, run errands and fold the clothes right.

/10
Population: 15,408
Poverty Level: 14.6%
Median Home Price $405,675
Married Households 11.0%
Households With Kids 15.5%
More on Hendersonville: Data | Crime | Cost Of Living | Movers
Less than 3.2% of the residents in Hendersonville are jobless, which is just about as low as you’ll see.
Incomes are steady, and commute times are really low as well. That really takes away the stress factors that stop folks from relaxing and enjoying their âdown time’ to do the little things that matter: Walks in the park, time alone with a book and extra face time with the children.


/10
Population: 120,805
Poverty Level: 16.0%
Median Home Price $416,159
Married Households 13.0%
Households With Kids 18.75%
More on Wilmington: Data | Crime | Cost Of Living | Movers
About 46% of residents in Wilmington, NC have a college degree. While we’ve all heard the saying, âIgnorance is bliss,’ our argument is: Ignorance is also broke.
Not only are most of the residents of Wilmington smart, they’re safe, too.


/10
Population: 8,048
Poverty Level: 14.1%
Median Home Price $427,001
Married Households 13.0%
Households With Kids 17.5%
More on Woodfin: Data | Crime | Cost Of Living | Movers
In Woodfin, most of the population is married, and most own their own homes.
The commute times (22 minutes each way) might eventually start to turn the corners of those smiles sideways.
But for now, it’s all roses in Woodfin.
Methodology: How We Measured The Happiest Cities In The Tar Heel State
To rank the happiest places in North Carolina, we had to determine what criteria make people happy. It isn’t a stretch to assume that happy people earn great salaries, are relatively stress-free, and have a stable home life.
So we went to the Census’s American Community Survey 2020-2024 report for the happy criteria, added some Saturday Night Science, and generated the answer.
Here are the criteria we used to measure happiness:
- Percentage of residents with a college degree
- Average commute times
- Unemployment rates
- Cost of living
- % of married couples
- % of families with kids
- Poverty rate
After we decided on the criteria, we gathered the data for the 142 places in North Carolina with over 5,000 people.
We then ranked each place from one to 142 for each of the seven criteria, with a score of one being the happiest.
Next, we averaged the seven rankings into a Happy Index for each place with the lowest overall Happy Index “earning” the title “Happiest City In North Carolina.”
If you’d like to see the complete list of cities, happiest to saddest, scroll to the bottom of this post to see the unabridged chart.
We updated this article for 2026, and it’s our eleventh time ranking the happiest cities in North Carolina.
There You Have It – The Happiest Cities In North Carolina
As we said earlier, trying to determine the most miserable cities in North Carolina is usually a subjective matter.
But if you’re analyzing cities where people are not stable, where you’re stuck in traffic, and no one spent the time to go to college, then this is an accurate list.
The happiest cities in North Carolina are Morehead City, Oak Island, Waynesville, Brevard, Chapel Hill, Boone, Washington, Hendersonville, Wilmington, and Woodfin.
If you’re curious enough, here are the most miserable cities in North Carolina, according to science:
- Zebulon
- Hope Mills
- Roxboro
For more North Carolina reading, check out:
- Best Places To Live In North Carolina
- Cheapest Places To Live In North Carolina
- Most Dangerous Cities In North Carolina
- Richest Cities In North Carolina
- Safest Cities in North Carolina
- Worst Places To Live In North Carolina
- Most Expensive Places To Live In North Carolina
Happiest Cities In North Carolina For 2026
| Rank | City | Population | Poverty Level | Median Home Value | % Married | % Kids |
|---|---|---|---|---|---|---|
| 1 | Morehead City, NC | 9,806 | 18.1% | $410,236 | 19.0% | 22.87% |
| 2 | Oak Island, NC | 9,030 | 8.7% | $568,671 | 28.0% | 8.82% |
| 3 | Waynesville, NC | 10,502 | 15.9% | $355,351 | 19.0% | 19.96% |
| 4 | Brevard, NC | 7,897 | 15.1% | $464,517 | 13.0% | 18.39% |
| 5 | Chapel Hill, NC | 61,607 | 18.6% | $631,166 | 6.0% | 23.83% |
| 6 | Boone, NC | 20,032 | 51.2% | $483,788 | 6.0% | 9.82% |
| 7 | Washington, NC | 9,726 | 23.1% | $242,528 | 26.0% | 24.36% |
| 8 | Hendersonville, NC | 15,408 | 14.6% | $405,675 | 11.0% | 15.5% |
| 9 | Wilmington, NC | 120,805 | 16.0% | $416,159 | 13.0% | 18.75% |
| 10 | Woodfin, NC | 8,048 | 14.1% | $427,001 | 13.0% | 17.5% |
| 11 | Asheville, NC | 94,535 | 14.3% | $460,993 | 10.0% | 20.52% |
| 12 | Fletcher, NC | 8,098 | 7.6% | $446,279 | 21.0% | 23.04% |
| 13 | Oak Ridge, NC | 7,744 | 3.6% | $599,278 | 25.0% | 39.01% |
| 14 | Morganton, NC | 17,646 | 25.7% | $261,445 | 20.0% | 28.98% |
| 15 | Black Mountain, NC | 8,513 | 5.9% | $463,738 | 14.0% | 15.41% |
| 16 | Kernersville, NC | 27,830 | 12.6% | $322,446 | 19.0% | 25.86% |
| 17 | Hickory, NC | 44,258 | 17.1% | $293,999 | 20.0% | 28.99% |
| 18 | Elon, NC | 11,032 | 20.0% | $350,879 | 14.0% | 28.42% |
| 19 | Mills River, NC | 7,281 | 2.6% | $530,765 | 21.0% | 31.13% |
| 20 | Shelby, NC | 22,100 | 17.6% | $209,226 | 25.0% | 27.6% |
| 21 | Tarboro, NC | 10,770 | 18.5% | $152,776 | 33.0% | 21.61% |
| 22 | Mount Airy, NC | 10,633 | 26.9% | $210,208 | 22.0% | 27.3% |
| 23 | Carolina Beach, NC | 6,745 | 6.0% | $606,035 | 20.0% | 18.29% |
| 24 | Durham, NC | 291,467 | 11.7% | $396,394 | 11.0% | 24.89% |
| 25 | Carrboro, NC | 21,204 | 12.2% | $429,674 | 7.0% | 26.38% |
| 26 | Lewisville, NC | 13,828 | 10.2% | $404,563 | 30.0% | 38.01% |
| 27 | Walke, NC | 5,873 | 10.8% | $275,856 | 29.0% | 29.18% |
| 28 | New Bern, NC | 32,734 | 17.3% | $281,327 | 15.0% | 25.46% |
| 29 | Hillsborough, NC | 9,724 | 8.0% | $472,961 | 15.0% | 30.22% |
| 30 | Raleigh, NC | 481,031 | 11.9% | $433,996 | 12.0% | 26.26% |
| 31 | Conover, NC | 8,580 | 15.7% | $277,411 | 30.0% | 44.12% |
| 32 | Matthews, NC | 30,577 | 3.7% | $501,847 | 14.0% | 28.27% |
| 33 | Trinity, NC | 7,111 | 11.6% | $287,548 | 28.0% | 27.48% |
| 34 | Pinehurst, NC | 18,256 | 4.3% | $535,650 | 13.0% | 16.71% |
| 35 | Salisbury, NC | 35,825 | 26.3% | $280,645 | 19.0% | 28.75% |
| 36 | Clemmons, NC | 21,871 | 6.5% | $387,813 | 21.0% | 30.46% |
| 37 | Belmont, NC | 15,546 | 7.9% | $432,564 | 17.0% | 25.05% |
| 38 | Lincolnton, NC | 11,783 | 22.7% | $296,022 | 23.0% | 30.34% |
| 39 | Cornelius, NC | 32,783 | 5.4% | $527,117 | 8.0% | 29.17% |
| 40 | Archer Lodge, NC | 5,186 | 17.4% | $377,861 | 22.0% | 34.75% |
| 41 | Mocksville, NC | 6,068 | 19.2% | $280,267 | 20.0% | 29.99% |
| 42 | Winterville, NC | 10,725 | 9.8% | $278,291 | 24.0% | 29.89% |
| 43 | Stokesdale, NC | 6,004 | 5.6% | $386,451 | 28.0% | 35.09% |
| 44 | Dunn, NC | 8,559 | 19.7% | $227,475 | 23.0% | 26.67% |
| 45 | Southern Pines, NC | 16,420 | 9.6% | $456,115 | 13.0% | 23.02% |
| 46 | Archdale, NC | 12,087 | 5.2% | $248,494 | 26.0% | 25.02% |
| 47 | Boiling Spring Lakes, NC | 6,347 | 8.5% | $315,222 | 18.0% | 21.04% |
| 48 | Kill Devil Hills, NC | 7,761 | 9.1% | $521,722 | 10.0% | 23.7% |
| 49 | Cary, NC | 179,306 | 5.7% | $626,395 | 9.0% | 34.83% |
| 50 | Smithfield, NC | 12,116 | 27.3% | $293,390 | 20.0% | 25.63% |
| 51 | Clinton, NC | 8,304 | 23.6% | $154,112 | 22.0% | 29.59% |
| 52 | Winston-Salem, NC | 252,037 | 17.7% | $264,332 | 16.0% | 28.04% |
| 53 | Pleasant Garden, NC | 5,060 | 9.7% | $315,482 | 39.0% | 36.51% |
| 54 | Long View, NC | 5,011 | 11.3% | $183,166 | 28.0% | 18.91% |
| 55 | Greenville, NC | 92,857 | 24.6% | $235,821 | 13.0% | 24.47% |
| 56 | Davidson, NC | 15,660 | 7.0% | $655,967 | 8.0% | 30.77% |
| 57 | Mint Hill, NC | 27,556 | 8.4% | $513,193 | 19.0% | 28.81% |
| 58 | Greensboro, NC | 301,198 | 17.0% | $264,427 | 13.0% | 28.41% |
| 59 | Summerfield, NC | 11,116 | 7.1% | $519,609 | 16.0% | 37.68% |
| 60 | King, NC | 7,408 | 7.0% | $276,085 | 31.0% | 32.62% |
| 61 | Weddington, NC | 13,805 | 4.0% | $1,074,643 | 15.0% | 51.03% |
| 62 | Cramerton, NC | 5,450 | 6.2% | $305,443 | 25.0% | 33.79% |
| 63 | Leland, NC | 29,607 | 6.1% | $376,599 | 14.0% | 22.17% |
| 64 | Wilson, NC | 48,370 | 23.0% | $218,942 | 24.0% | 30.76% |
| 65 | Ayden, NC | 5,150 | 22.4% | $226,358 | 28.0% | 29.57% |
| 66 | Charlotte, NC | 903,844 | 11.7% | $397,125 | 9.0% | 28.58% |
| 67 | High Point, NC | 116,245 | 15.7% | $249,820 | 16.0% | 29.17% |
| 68 | Morrisville, NC | 31,422 | 3.1% | $480,925 | 5.0% | 36.86% |
| 69 | Unionville, NC | 6,954 | 9.4% | $419,700 | 37.0% | 33.32% |
| 70 | Thomasville, NC | 27,321 | 16.3% | $237,157 | 27.0% | 32.09% |
| 71 | Gibsonville, NC | 9,467 | 5.8% | $307,075 | 26.0% | 33.85% |
| 72 | Statesville, NC | 29,894 | 20.4% | $297,069 | 15.0% | 32.22% |
| 73 | Williamston, NC | 5,112 | 36.3% | $131,110 | 21.0% | 25.63% |
| 74 | Garner, NC | 34,473 | 8.4% | $384,100 | 17.0% | 27.07% |
| 75 | Reidsville, NC | 14,585 | 21.1% | $210,646 | 22.0% | 25.93% |
| 76 | Carolina Shores, NC | 5,017 | 3.9% | $319,365 | 8.0% | 5.9% |
| 77 | Albemarle, NC | 16,762 | 24.9% | $261,947 | 23.0% | 30.52% |
| 78 | Rocky Mount, NC | 54,297 | 19.7% | $185,886 | 19.0% | 25.4% |
| 79 | Marion, NC | 7,579 | 23.5% | $244,493 | 23.0% | 31.96% |
| 80 | Knightdale, NC | 20,214 | 5.3% | $370,204 | 18.0% | 41.48% |
| 81 | Aberdeen, NC | 9,228 | 10.5% | $352,796 | 17.0% | 30.06% |
| 82 | Asheboro, NC | 27,580 | 19.7% | $240,877 | 18.0% | 30.54% |
| 83 | Lenoir, NC | 18,299 | 14.6% | $215,174 | 20.0% | 21.99% |
| 84 | Graham, NC | 18,048 | 16.8% | $292,521 | 20.0% | 27.89% |
| 85 | Burlington, NC | 59,610 | 16.4% | $256,022 | 18.0% | 28.11% |
| 86 | Cherryville, NC | 6,226 | 12.4% | $249,357 | 38.0% | 37.44% |
| 87 | Sanford, NC | 31,478 | 22.0% | $291,206 | 19.0% | 38.64% |
| 88 | Butner, NC | 8,065 | 15.0% | $273,630 | 28.0% | 34.48% |
| 89 | St. James, NC | 7,072 | 4.3% | $694,376 | 4.0% | 2.21% |
| 90 | Locust, NC | 5,840 | 8.7% | $384,686 | 30.0% | 32.28% |
| 91 | Huntersville, NC | 63,969 | 3.1% | $550,754 | 11.0% | 36.06% |
| 92 | Goldsboro, NC | 34,383 | 22.8% | $194,176 | 18.0% | 29.21% |
| 93 | Pineville, NC | 11,055 | 13.8% | $403,663 | 6.0% | 31.12% |
| 94 | Roanoke Rapids, NC | 14,856 | 18.4% | $121,329 | 29.0% | 29.54% |
| 95 | Harrisburg, NC | 19,633 | 3.7% | $494,883 | 17.0% | 49.97% |
| 96 | Kannapolis, NC | 57,890 | 12.6% | $279,707 | 19.0% | 32.32% |
| 97 | Fuquay-Varina, NC | 40,485 | 8.2% | $525,746 | 14.0% | 40.21% |
| 98 | Nashville, NC | 5,729 | 16.9% | $257,559 | 26.0% | 29.16% |
| 99 | Marvin, NC | 6,692 | 7.6% | $1,251,046 | 9.0% | 59.36% |
| 100 | Apex, NC | 70,630 | 2.2% | $599,084 | 10.0% | 47.72% |


