Whitest cities in Oregon research summary. We analyzed Oregon’s most recent Census data to determine the whitest cities in Oregon based on the percentage of White residents.
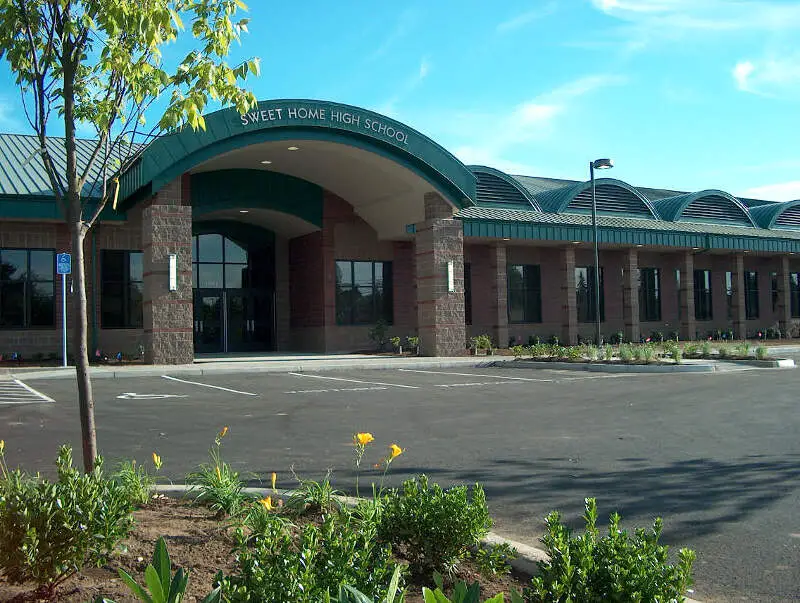
88.8% White · #1 whitest in Oregon
Sweet Home is a city in Linn County, Oregon, United States. The population was 8,925 at the 2010 census. According to the city, “Sweet Home is sometimes referred to as the ‘Gateway to the Santiam Playground’ due to its proximity to nearby lakes, rivers and the Cascade Mountains.”
Data | Crime | Cost of living | Movers
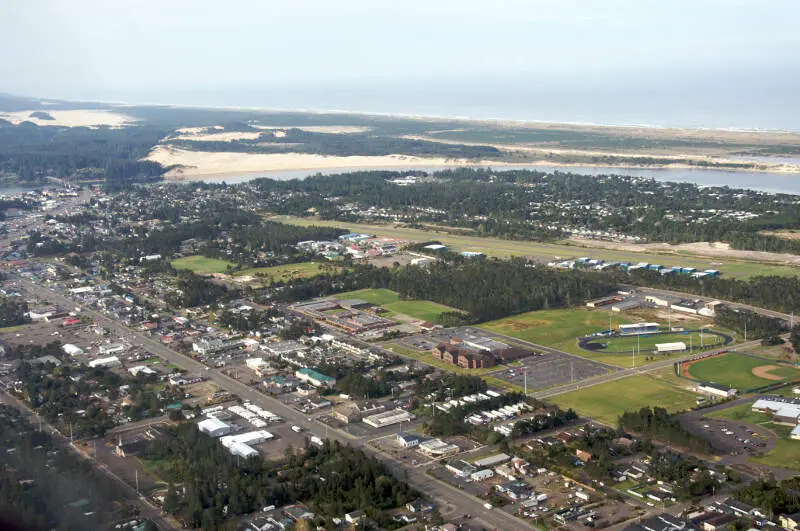
87.9% White · #2 whitest in Oregon
Florence is a coastal city in Lane County, in the U.S. state of Oregon. It lies at the mouth of the Siuslaw River on the Pacific Ocean and about midway between Newport and Coos Bay along U.S. Route 101. As of the 2010 census, the city had a total population of 8,466.
Data | Crime | Cost of living | Movers
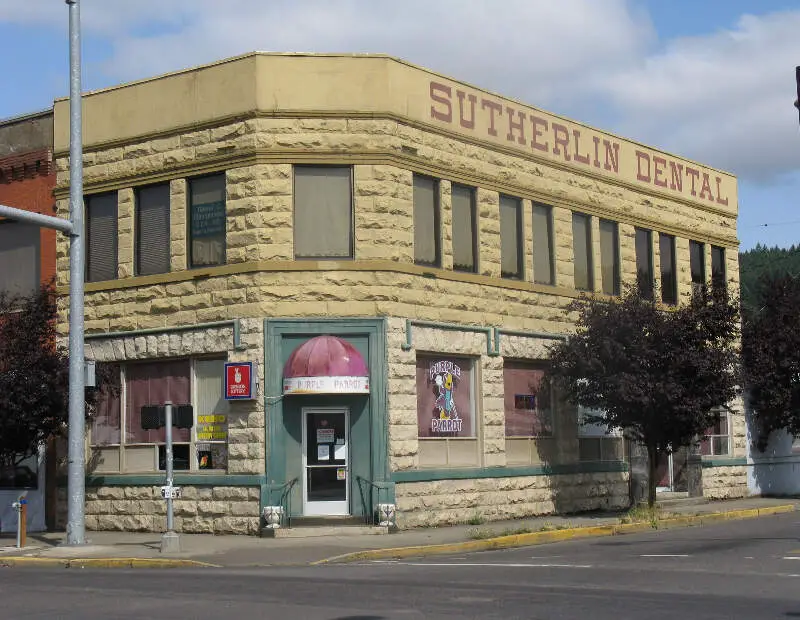
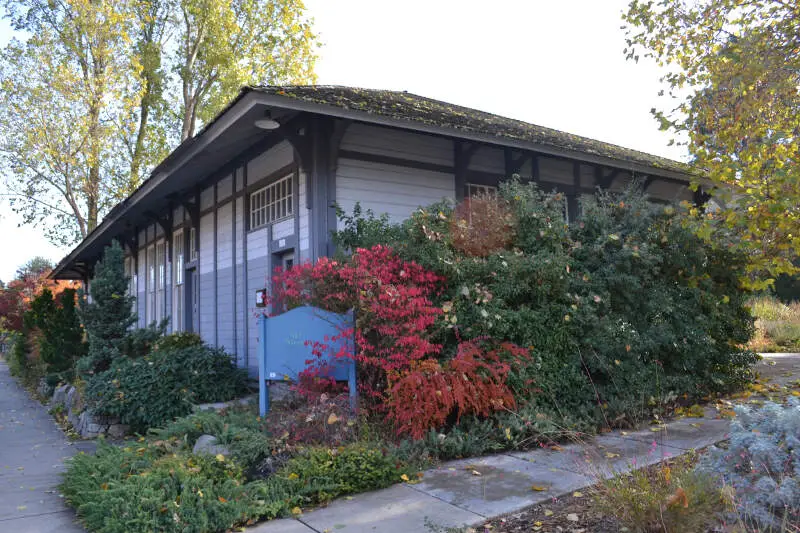
87.6% White · #3 whitest in Oregon
Data | Crime | Cost of living | Movers
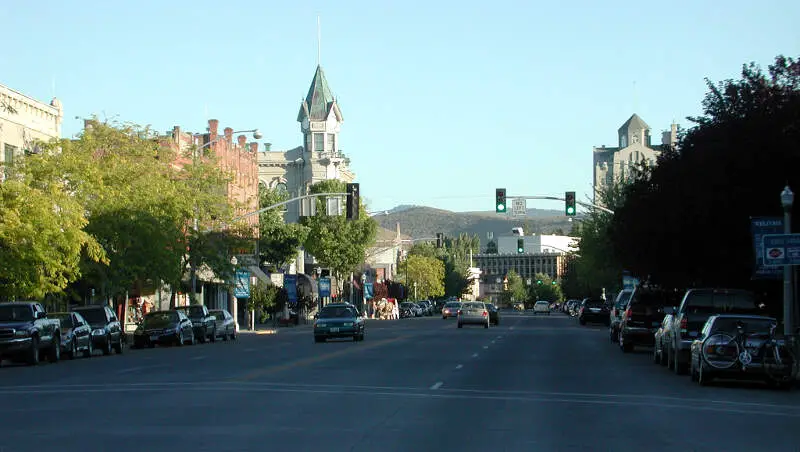
86.4% White · #4 whitest in Oregon
Baker City is a city in and the county seat of Baker County, Oregon, United States. It was named after Edward D. Baker, the only U.S. Senator ever killed in military combat. The population was 9,828 at the 2010 census.
Data | Crime | Cost of living | Movers
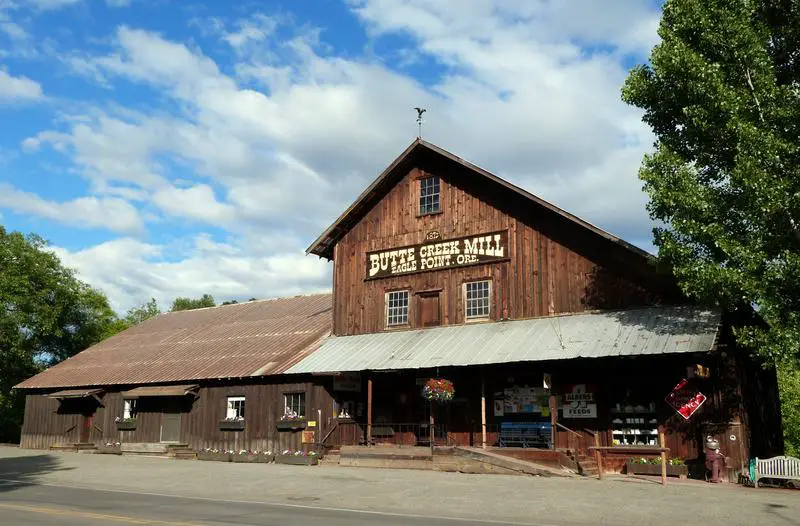
86.1% White · #5 whitest in Oregon
Eagle Point is a city in Jackson County, Oregon, United States. The population was estimated at 8,624 as of 2012.
Data | Crime | Cost of living | Movers
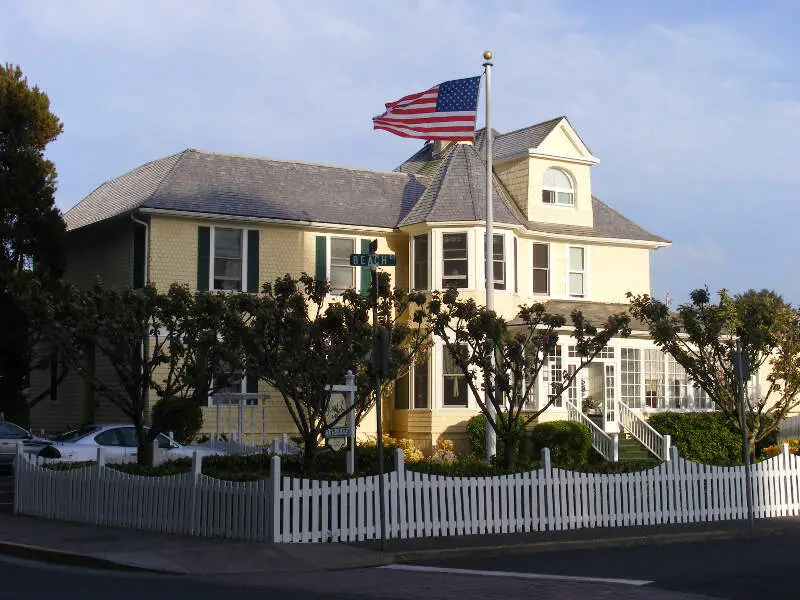
84.4% White · #6 whitest in Oregon
Seaside is a city in Clatsop County, Oregon, United States. The name Seaside is derived from Seaside House, a historic summer resort built in the 1870s by railroad magnate Ben Holladay. The city’s population was 6,457 at the 2010 census.
Data | Crime | Cost of living | Movers
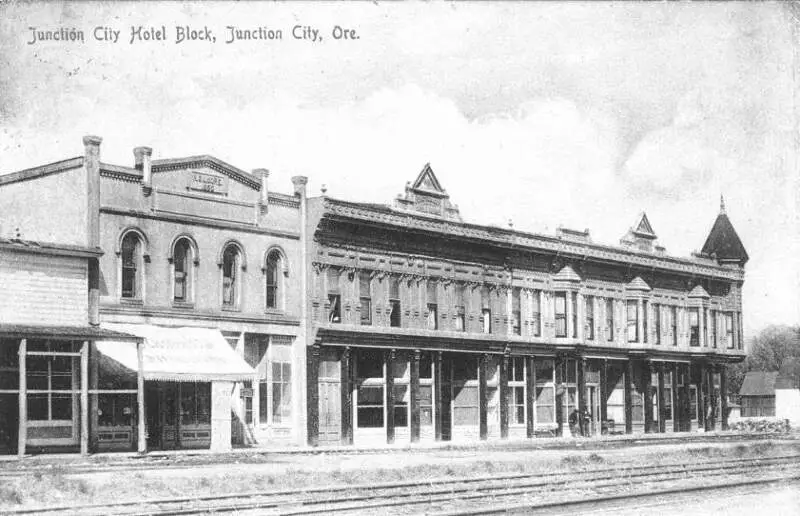
84.3% White · #7 whitest in Oregon
Junction City is a city in Lane County, Oregon, United States. Its population was 5,392 at the 2010 census.
Data | Crime | Cost of living | Movers
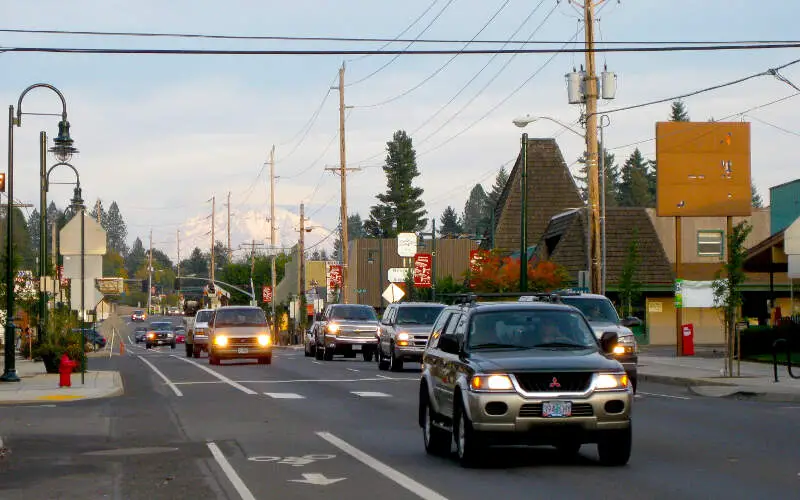
84.2% White · #8 whitest in Oregon
Sandy is a city located in Clackamas County, Oregon, United States, and named after the nearby Sandy River. The city serves as the western gateway to the Mount Hood Corridor, 25 miles east of Portland. As of the 2010 census, the city had a total population of 9,570.
Data | Crime | Cost of living | Movers
83.7% White · #9 whitest in Oregon
Ashland is a city in Jackson County, in the State of Oregon. It lies along Interstate 5 approximately 16 miles north of the California border and near the south end of the Rogue Valley. As of 2015, the city’s population was approaching 21,000.
Data | Crime | Cost of living | Movers
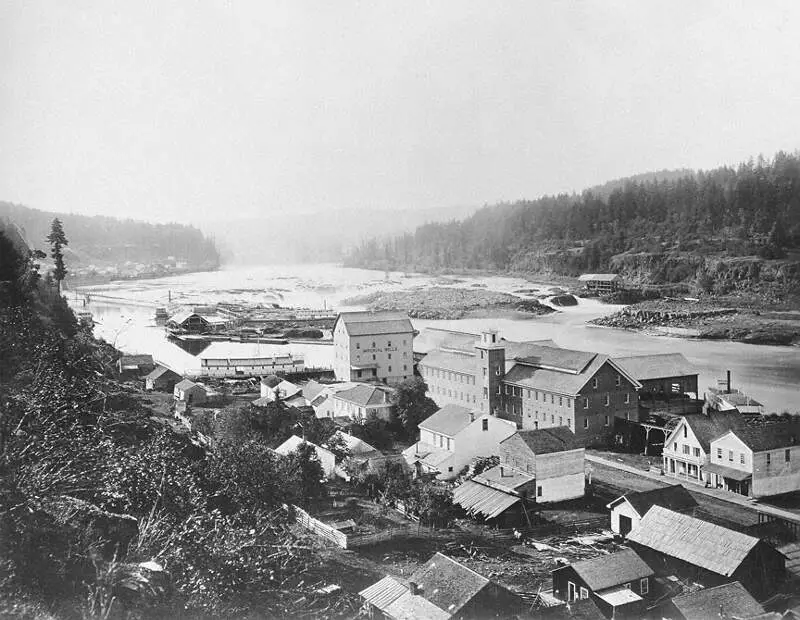
83.6% White · #10 whitest in Oregon
Oregon City is the county seat of Clackamas County, Oregon, United States, located on the Willamette River near the southern limits of the Portland metropolitan area. Established in 1829 by the Hudson’s Bay Company, in 1844 it became the first U.S. city west of the Rocky Mountains to be incorporated. As of the 2010 census, the city population was 31,859.
Data | Crime | Cost of living | Movers
The receipts
Compare the top ten
Pick a metric. The bars rescale. The red line is Oregon’s statewide median.
On the map
Where Oregon’s White population is concentrated
Saturday Night Science
Methodology: How we determined the whitest places in Oregon for 2026
To rank the whitest places in Oregon, we used Saturday Night Science to look at Census demographic data.
We had to look at the number of white people living in each city in Oregon on a per capita basis. In other words, the percentage of white people living in each city in Oregon.
We looked at table B03002: Hispanic OR LATINO ORIGIN BY RACE. Here are the category names as defined by the Census:
- Hispanic or Latino
- White alone*
- Black or African American alone*
- American Indian and Alaska Native alone*
- Asian alone*
- Native Hawaiian and Other Pacific Islander alone*
- Some other race alone*
- Two or more races*
Our particular column of interest here was the number of people who identified as White alone.
We limited our analysis to places with a population greater than 5,000 people. That left us with 73 cities.
We then calculated the percentage of residents that are White. The percentages ranked from 88.8% to 33.7%.
Finally, we ranked each city based on the percentage of the White population, with a higher percentage being more White. Sweet Home took the distinction of being the most White, while Woodburn was the least White city.
We updated this article for 2026. This report represents our eleventh time ranking the whitest cities in Oregon.
The full plate
Cities In Oregon By White Population
Click any column to sort. Search by city name.
| Rank | City | Population | White Population | % White |
|---|---|---|---|---|
| 1 | Sweet Home | 10,078 | 8,948 | 88.8% |
| 2 | Florence | 9,482 | 8,339 | 87.9% |
| 3 | Sutherlin | 8,599 | 7,534 | 87.6% |
| 4 | Baker City | 10,210 | 8,817 | 86.4% |
| 5 | Eagle Point | 9,839 | 8,470 | 86.1% |
| 6 | Seaside | 7,192 | 6,067 | 84.4% |
| 7 | Junction City | 6,947 | 5,855 | 84.3% |
| 8 | Sandy | 12,854 | 10,826 | 84.2% |
| 9 | Ashland | 21,259 | 17,802 | 83.7% |
| 10 | Oregon City | 37,755 | 31,568 | 83.6% |
| 11 | La Grande | 13,058 | 10,854 | 83.1% |
| 12 | Coos Bay | 15,925 | 13,160 | 82.6% |
| 13 | Bend | 103,390 | 85,363 | 82.6% |
| 14 | Lebanon | 19,344 | 15,966 | 82.5% |
| 15 | Scappoose | 8,179 | 6,743 | 82.4% |
| 16 | Molalla | 10,186 | 8,347 | 81.9% |
| 17 | Roseburg | 23,778 | 19,420 | 81.7% |
| 18 | Winston | 5,690 | 4,644 | 81.6% |
| 19 | Grants Pass | 39,311 | 31,933 | 81.2% |
| 20 | Brookings | 6,703 | 5,421 | 80.9% |
| 21 | St. Helens | 14,258 | 11,507 | 80.7% |
| 22 | Prineville | 11,470 | 9,224 | 80.4% |
| 23 | West Linn | 26,935 | 21,531 | 79.9% |
| 24 | Cottage Grove | 10,698 | 8,517 | 79.6% |
| 25 | North Bend | 10,171 | 8,080 | 79.4% |
| 26 | Pendleton | 16,950 | 13,396 | 79.0% |
| 27 | Redmond | 36,092 | 28,512 | 79.0% |
| 28 | Milwaukie | 21,392 | 16,814 | 78.6% |
| 29 | Dallas | 17,531 | 13,745 | 78.4% |
| 30 | Silverton | 10,456 | 8,128 | 77.7% |
| 31 | Talent | 6,254 | 4,855 | 77.6% |
| 32 | Lincoln City | 9,968 | 7,645 | 76.7% |
| 33 | Gladstone | 11,977 | 9,170 | 76.6% |
| 34 | Sherwood | 20,307 | 15,447 | 76.1% |
| 35 | Lake Oswego | 40,381 | 30,647 | 75.9% |
| 36 | Newport | 10,583 | 7,987 | 75.5% |
| 37 | Canby | 18,134 | 13,664 | 75.4% |
| 38 | Astoria | 10,109 | 7,611 | 75.3% |
| 39 | Albany | 56,839 | 42,692 | 75.1% |
| 40 | Springfield | 61,499 | 46,012 | 74.8% |
| 41 | Eugene | 179,591 | 133,200 | 74.2% |
| 42 | Stayton | 8,292 | 6,133 | 74.0% |
| 43 | Central Point | 19,216 | 14,199 | 73.9% |
| 44 | Newberg | 26,066 | 18,978 | 72.8% |
| 45 | Corvallis | 59,960 | 43,463 | 72.5% |
| 46 | Medford | 86,315 | 62,251 | 72.1% |
| 47 | Troutdale | 15,923 | 11,389 | 71.5% |
| 48 | Wilsonville | 26,974 | 19,255 | 71.4% |
| 49 | McMinnville | 34,596 | 24,655 | 71.3% |
| 50 | Klamath Falls | 22,115 | 15,677 | 70.9% |
| 51 | The Dalles | 15,917 | 11,249 | 70.7% |
| 52 | Monmouth | 11,428 | 8,021 | 70.2% |
| 53 | Keizer | 39,082 | 26,576 | 68.0% |
| 54 | Tigard | 56,011 | 37,765 | 67.4% |
| 55 | Portland | 641,165 | 421,689 | 65.8% |
| 56 | Hood River | 8,361 | 5,452 | 65.2% |
| 57 | Sheridan | 6,339 | 4,003 | 63.1% |
| 58 | Happy Valley | 26,738 | 16,769 | 62.7% |
| 59 | Tualatin | 27,763 | 17,210 | 62.0% |
| 60 | Salem | 178,865 | 109,605 | 61.3% |
| 61 | Gresham | 112,378 | 68,009 | 60.5% |
| 62 | Forest Grove | 26,529 | 15,561 | 58.7% |
| 63 | Beaverton | 97,812 | 56,523 | 57.8% |
| 64 | Milton-Freewater | 7,036 | 3,858 | 54.8% |
| 65 | Independence | 10,199 | 5,412 | 53.1% |
| 66 | Hillsboro | 108,231 | 56,307 | 52.0% |
| 67 | Umatilla | 7,508 | 3,870 | 51.5% |
| 68 | Fairview | 10,735 | 5,532 | 51.5% |
| 69 | Ontario | 11,842 | 5,840 | 49.3% |
| 70 | Madras | 7,676 | 3,574 | 46.6% |
| 71 | Cornelius | 14,255 | 6,035 | 42.3% |
| 72 | Hermiston | 19,546 | 7,737 | 39.6% |
| 73 | Woodburn | 27,875 | 9,387 | 33.7% |
Source: U.S. Census ACS 2020-2024. 73 cities with more than 5,000 residents.
Summary
Summary: White Populations Across Oregon
We measured the locations with the highest percentage of white people in Oregon. According to the most recent data, this list provides accurate information on the whitest places in Oregon.
The most White cities in Oregon are Sweet Home, Florence, Sutherlin, Baker City, Eagle Point, Seaside, Junction City, Sandy, Ashland, and Oregon City. Not sold on Oregon? Take the two-minute Find Your Place quiz and see which state actually fits you.


