Chandler, AZ
Demographics And Statistics
Living In Chandler, Arizona Summary
Life in Chandler research summary. HomeSnacks has been using Saturday Night Science to research the quality of life in Chandler over the past nine years using Census, FBI, Zillow, and other primary data sources. Based on the most recently available data, we found the following about life in Chandler:
The population in Chandler is 278,123.
The median home value in Chandler is $522,553.
The median income in Chandler is $103,691.
The cost of living in Chandler is 128 which is 1.3x higher than the national average.
The median rent in Chandler is $1,806.
The unemployment rate in Chandler is 3.6%.
The poverty rate in Chandler is 7.7%.
The average high in Chandler is 85.8° and the average low is 58.1°.
Chandler SnackAbility
Overall SnackAbility
Chandler, AZ Crime Report
Crime in Chandler summary. We use data from the FBI to determine the crime rates in Chandler. Key points include:
There were 4,604 total crimes in Chandler in the last reporting year.
The overall crime rate per 100,000 people in Chandler is 1,637.8 / 100k people.
The violent crime rate per 100,000 people in Chandler is 133.4 / 100k people.
The property crime rate per 100,000 people in Chandler is 1,504.4 / 100k people.
Overall, crime in Chandler is -22.72% below the national average.
Total Crimes
Below National Average
Crime In Chandler Comparison Table
| Statistic | Count Raw |
Chandler / 100k People |
Arizona / 100k People |
National / 100k People |
|---|---|---|---|---|
| Total Crimes Per 100K | 4,604 | 1,637.8 | 2,214.0 | 2,119.2 |
| Violent Crime | 375 | 133.4 | 421.9 | 359.0 |
| Murder | 2 | 0.7 | 4.9 | 5.0 |
| Robbery | 66 | 23.5 | 64.6 | 61.0 |
| Aggravated Assault | 258 | 91.8 | 312.4 | 256.0 |
| Property Crime | 4,229 | 1,504.4 | 1,792.1 | 1,760.0 |
| Burglary | 339 | 120.6 | 217.8 | 229.0 |
| Larceny | 3,633 | 1,292.3 | 1,329.9 | 1,272.0 |
| Car Theft | 257 | 91.4 | 244.4 | 259.0 |
Chandler, AZ Cost Of Living
Cost of living in Chandler summary. We use data on the cost of living to determine how expensive it is to live in Chandler. Real estate prices drive most of the variance in cost of living around Arizona. Key points include:
The cost of living in Chandler is 128 with 100 being average.
The cost of living in Chandler is 1.3x higher than the national average.
The median home value in Chandler is $522,553.
The median income in Chandler is $103,691.
Chandler's Overall Cost Of Living
Higher Than The National Average
Cost Of Living In Chandler Comparison Table
| Living Expense | Chandler | Arizona | National Average | |
|---|---|---|---|---|
| Overall | 128 | 102 | 100 | |
| Services | 116 | 102 | 100 | |
| Groceries | 102 | 103 | 100 | |
| Health | 98 | 95 | 100 | |
| Housing | 166 | 99 | 100 | |
| Transportation | 122 | 107 | 100 | |
| Utilities | 96 | 96 | 100 | |
Chandler, AZ Weather
The average high in Chandler is 85.8° and the average low is 58.1°.
There are 20.6 days of precipitation each year.
Expect an average of 9.3 inches of precipitation each year with 0.0 inches of snow.
| Stat | Chandler |
|---|---|
| Average Annual High | 85.8 |
| Average Annual Low | 58.1 |
| Annual Precipitation Days | 20.6 |
| Average Annual Precipitation | 9.3 |
| Average Annual Snowfall | 0.0 |
Average High
Days of Rain
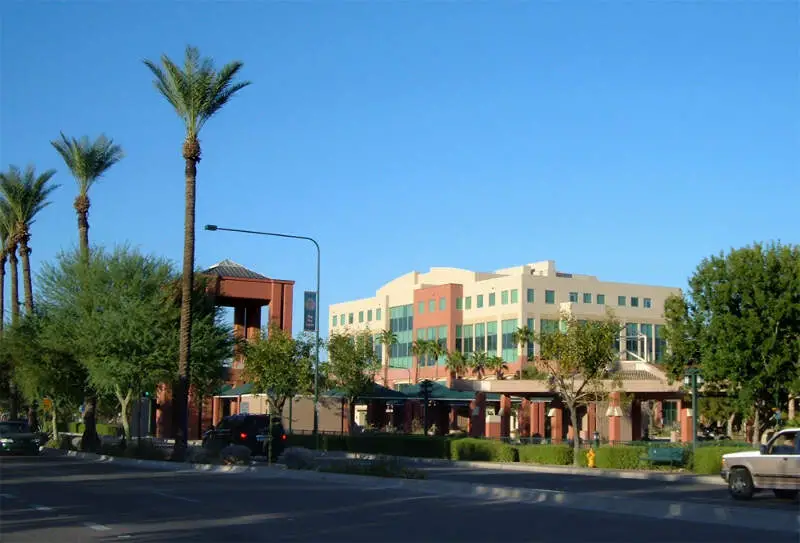
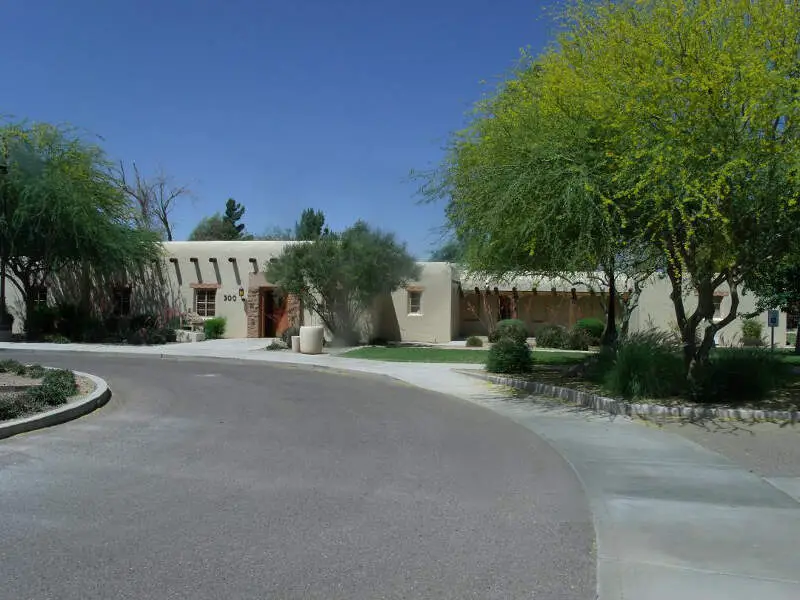
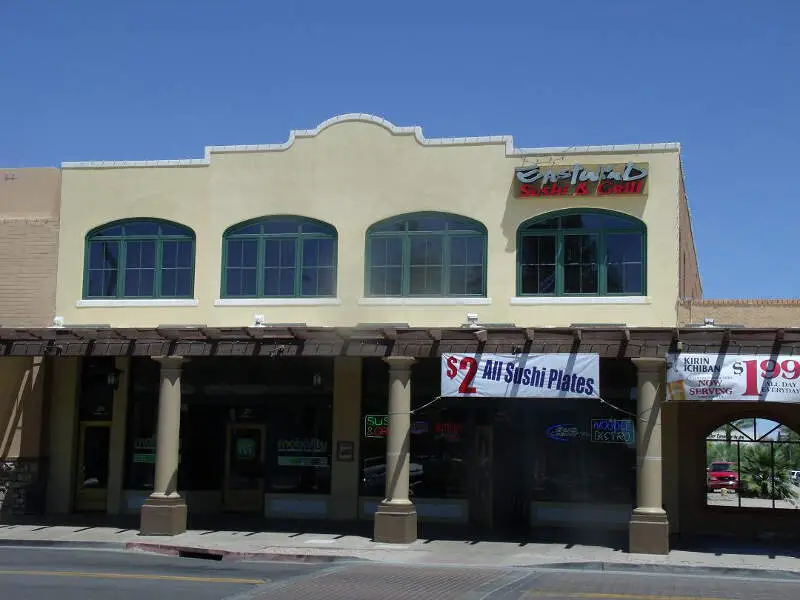
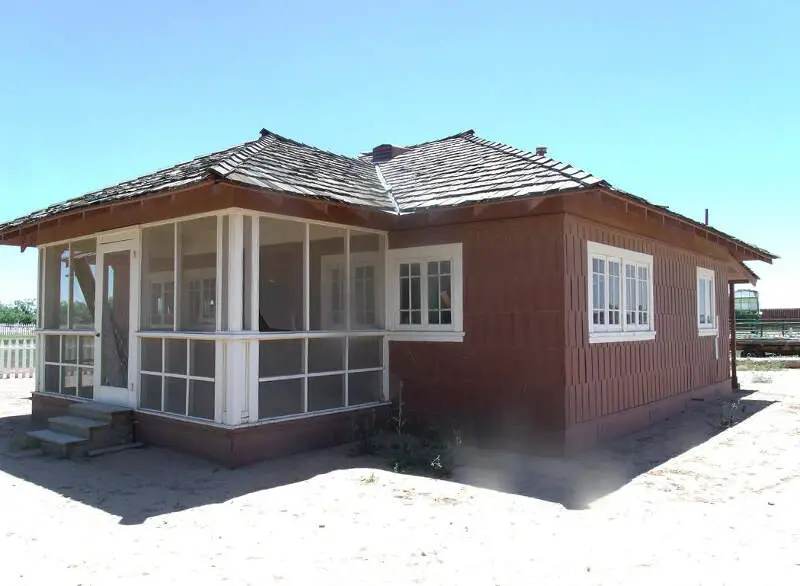
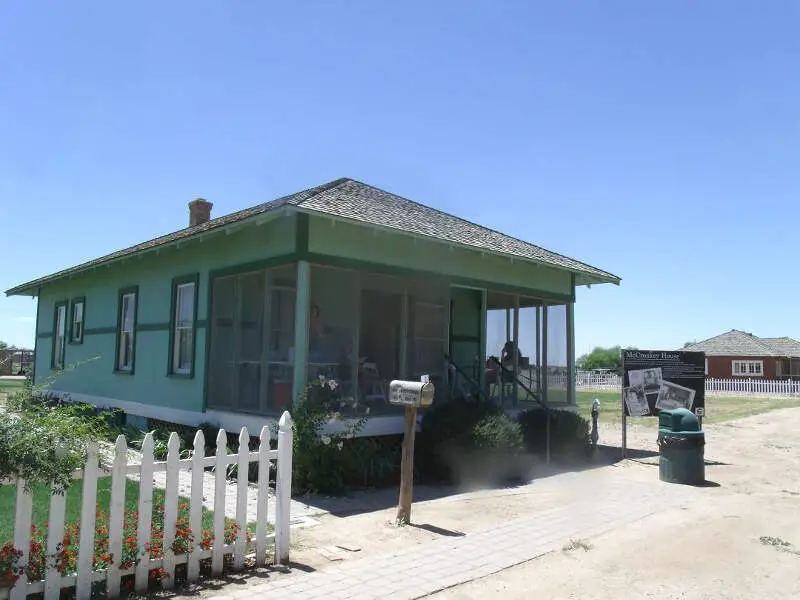
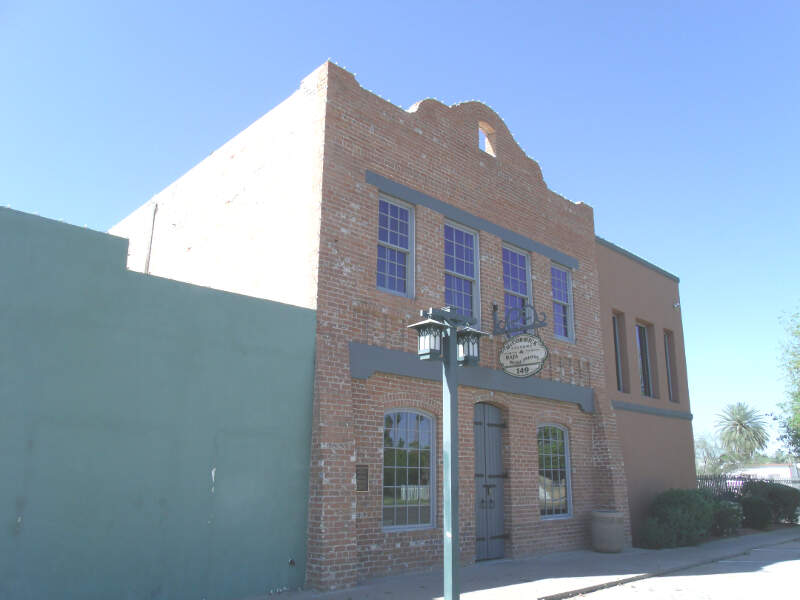
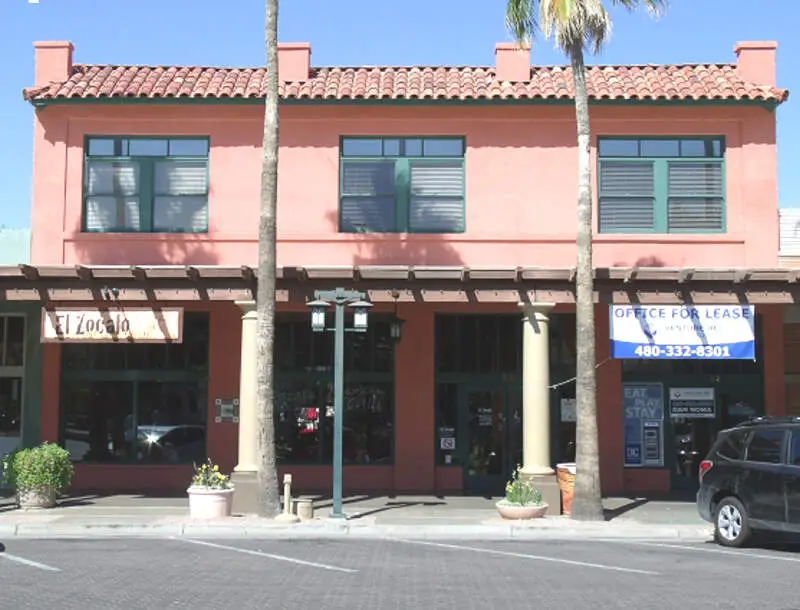
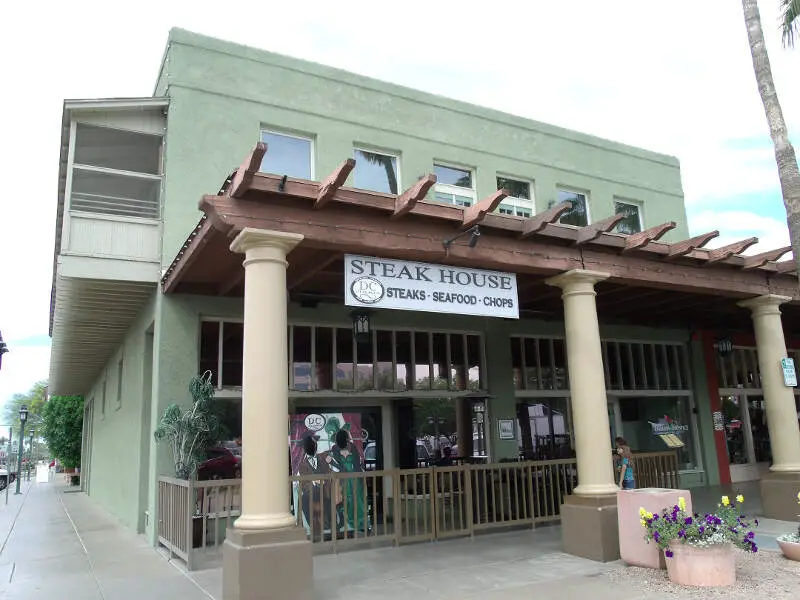
Chandler, AZ Photos
Chandler Articles


Rankings for Chandler in Arizona
Locations Around Chandler
Map Of Chandler, AZ
Best Places Around Chandler
Santa Cruz, CA
Population 60,953
Gilbert, AZ
Population 271,118
Sun Lakes, AZ
Population 14,079
Queen Creek, AZ
Population 66,369
Tempe, AZ
Population 186,419
Maricopa, AZ
Population 62,986
Paradise Valley, AZ
Population 12,621
Mesa, AZ
Population 507,478
San Tan Valley, AZ
Population 105,231
Goodyear, AZ
Population 102,891
Chandler Demographics And Statistics
Population over time in Chandler
The current population in Chandler is 278,123. The population has increased 21.2% from 2010.
| Year | Population | % Change |
|---|---|---|
| 2023 | 278,123 | 0.9% |
| 2022 | 275,618 | 1.2% |
| 2021 | 272,439 | 6.0% |
| 2020 | 257,076 | 1.7% |
| 2019 | 252,692 | 1.6% |
| 2018 | 248,631 | 1.4% |
| 2017 | 245,160 | 1.3% |
| 2016 | 242,131 | -3.2% |
| 2015 | 250,202 | 2.0% |
| 2014 | 245,231 | 1.7% |
| 2013 | 241,096 | 1.5% |
| 2012 | 237,456 | 1.7% |
| 2011 | 233,509 | 1.7% |
| 2010 | 229,531 | - |
Race / Ethnicity in Chandler
Chandler is:
55.3% White with 153,743 White residents.
5.1% African American with 14,118 African American residents.
1.5% American Indian with 4,078 American Indian residents.
11.3% Asian with 31,357 Asian residents.
0.2% Hawaiian with 464 Hawaiian residents.
0.5% Other with 1,266 Other residents.
4.8% Two Or More with 13,482 Two Or More residents.
21.4% Hispanic with 59,615 Hispanic residents.
| Race | Chandler | AZ | USA |
|---|---|---|---|
| White | 55.3% | 53.4% | 58.2% |
| African American | 5.1% | 4.4% | 12.0% |
| American Indian | 1.5% | 3.4% | 0.5% |
| Asian | 11.3% | 3.3% | 5.7% |
| Hawaiian | 0.2% | 0.2% | 0.2% |
| Other | 0.5% | 0.4% | 0.5% |
| Two Or More | 4.8% | 3.9% | 3.9% |
| Hispanic | 21.4% | 31.0% | 19.0% |
Gender in Chandler
Chandler is 49.8% female with 138,615 female residents.
Chandler is 50.2% male with 139,508 male residents.
| Gender | Chandler | AZ | USA |
|---|---|---|---|
| Female | 49.8% | 50.1% | 50.5% |
| Male | 50.2% | 49.9% | 49.5% |
Highest level of educational attainment in Chandler for adults over 25
4.0% of adults in Chandler completed < 9th grade.
3.0% of adults in Chandler completed 9-12th grade.
16.0% of adults in Chandler completed high school / ged.
21.0% of adults in Chandler completed some college.
9.0% of adults in Chandler completed associate's degree.
29.0% of adults in Chandler completed bachelor's degree.
14.0% of adults in Chandler completed master's degree.
2.0% of adults in Chandler completed professional degree.
2.0% of adults in Chandler completed doctorate degree.
| Education | Chandler | AZ | USA |
|---|---|---|---|
| < 9th Grade | 4.0% | 6.0% | 5.0% |
| 9-12th Grade | 3.0% | 6.0% | 6.0% |
| High School / GED | 16.0% | 23.0% | 26.0% |
| Some College | 21.0% | 24.0% | 19.0% |
| Associate's Degree | 9.0% | 9.0% | 9.0% |
| Bachelor's Degree | 29.0% | 20.0% | 21.0% |
| Master's Degree | 14.0% | 9.0% | 10.0% |
| Professional Degree | 2.0% | 2.0% | 2.0% |
| Doctorate Degree | 2.0% | 1.0% | 2.0% |
Household Income For Chandler, Arizona
3.0% of households in Chandler earn Less than $10,000.
1.6% of households in Chandler earn $10,000 to $14,999.
3.2% of households in Chandler earn $15,000 to $24,999.
3.5% of households in Chandler earn $25,000 to $34,999.
7.0% of households in Chandler earn $35,000 to $49,999.
15.1% of households in Chandler earn $50,000 to $74,999.
14.2% of households in Chandler earn $75,000 to $99,999.
20.8% of households in Chandler earn $100,000 to $149,999.
13.6% of households in Chandler earn $150,000 to $199,999.
17.9% of households in Chandler earn $200,000 or more.
| Income | Chandler | AZ | USA |
|---|---|---|---|
| Less than $10,000 | 3.0% | 4.9% | 4.9% |
| $10,000 to $14,999 | 1.6% | 2.9% | 3.6% |
| $15,000 to $24,999 | 3.2% | 6.1% | 6.6% |
| $25,000 to $34,999 | 3.5% | 6.9% | 6.8% |
| $35,000 to $49,999 | 7.0% | 10.9% | 10.4% |
| $50,000 to $74,999 | 15.1% | 17.0% | 15.7% |
| $75,000 to $99,999 | 14.2% | 13.6% | 12.7% |
| $100,000 to $149,999 | 20.8% | 18.1% | 17.4% |
| $150,000 to $199,999 | 13.6% | 9.0% | 9.3% |
| $200,000 or more | 17.9% | 10.6% | 12.6% |


