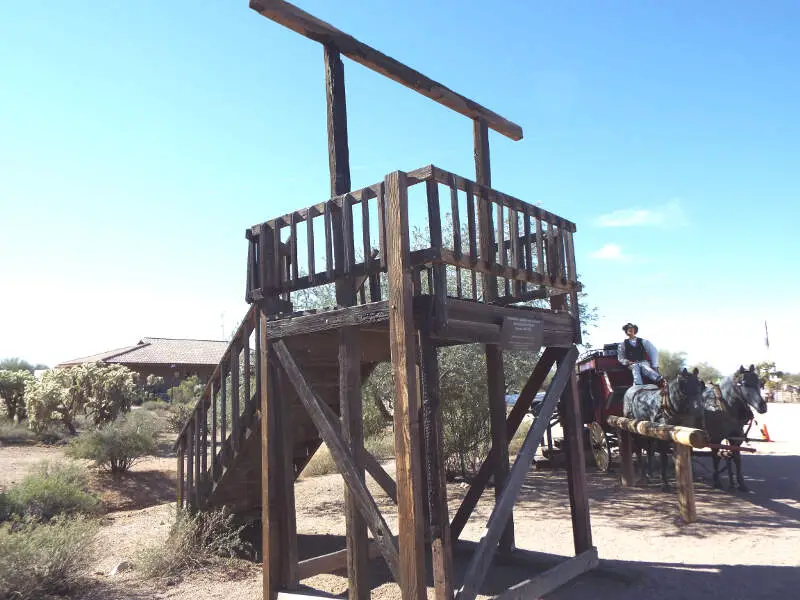

Life in Maricopa County research summary. HomeSnacks has been researching the quality of life in Maricopa County over the past eight years using Census data, FBI crime data, cost of living data, and other primary sources. Based on the most recently available data, we found the following about life in Maricopa County:
The population in Maricopa County is 4,430,871.
The median home value in Maricopa County is $462,437.
The median income in Maricopa County is $80,675.
The median rent in Maricopa County is $1,437.
The unemployment rate in Maricopa County is 4.8%.
The poverty rate in Maricopa County is 11.5%.
The average high in Maricopa County is 91.2° and there are 23.6 inches of rainfall annually.
The average high in Maricopa County is 91.2°.
There are 54.36 nice days each year.
Expect an average of 23.6 inches of rain each year with 0.0 inches of snow.
There is an average of 8:50 hours of sun each day in Maricopa County.
| Stat | Maricopa County |
|---|---|
| Mean High | 91.2 |
| Nice Days | 54.36 |
| Rainfall | 23.6 |
| Snowfall | 0.0 |
| Sunny_hours | 8:50 |


The current population in Maricopa County is 4,430,871. The population has increased 0.9% from 2019.
| Year | Population | % Change |
|---|---|---|
| 2022 | 4,367,186 | -1.0% |
| 2021 | 4,412,779 | 1.9% |
| 2020 | 4,328,810 | - |
Maricopa County is 50.2% female with 2,222,721 female residents.
Maricopa County is 49.8% male with 2,208,150 male residents.
| Gender | Maricopa County | AZ | USA |
|---|---|---|---|
| Female | 50.2% | 50.0% | 50.4% |
| Male | 49.8% | 50.0% | 49.6% |
Maricopa County is:
53.2% White with 2,359,261 White residents.
5.4% African American with 239,826 African American residents.
1.4% American Indian with 60,562 American Indian residents.
4.2% Asian with 184,817 Asian residents.
0.2% Hawaiian with 8,260 Hawaiian residents.
0.4% Other with 16,505 Other residents.
3.6% Two Or More with 158,887 Two Or More residents.
31.7% Hispanic with 1,402,753 Hispanic residents.
| Race | Maricopa County | AZ | USA |
|---|---|---|---|
| White | 53.2% | 53.0% | 58.9% |
| African American | 5.4% | 4.3% | 12.1% |
| American Indian | 1.4% | 3.5% | 0.6% |
| Asian | 4.2% | 3.3% | 5.7% |
| Hawaiian | 0.2% | 0.2% | 0.2% |
| Other | 0.4% | 0.3% | 0.4% |
| Two Or More | 3.6% | 3.4% | 3.5% |
| Hispanic | 31.7% | 32.0% | 18.7% |
4.2% of households in Maricopa County earn Less than $10,000.
2.5% of households in Maricopa County earn $10,000 to $14,999.
5.5% of households in Maricopa County earn $15,000 to $24,999.
6.6% of households in Maricopa County earn $25,000 to $34,999.
10.6% of households in Maricopa County earn $35,000 to $49,999.
17.1% of households in Maricopa County earn $50,000 to $74,999.
13.9% of households in Maricopa County earn $75,000 to $99,999.
18.6% of households in Maricopa County earn $100,000 to $149,999.
9.5% of households in Maricopa County earn $150,000 to $199,999.
11.3% of households in Maricopa County earn $200,000 or more.
| Income | Maricopa County | AZ | USA |
|---|---|---|---|
| Less than $10,000 | 4.2% | 4.9% | 4.9% |
| $10,000 to $14,999 | 2.5% | 3.1% | 3.8% |
| $15,000 to $24,999 | 5.5% | 6.7% | 7.0% |
| $25,000 to $34,999 | 6.6% | 7.7% | 7.4% |
| $35,000 to $49,999 | 10.6% | 11.5% | 10.7% |
| $50,000 to $74,999 | 17.1% | 17.6% | 16.1% |
| $75,000 to $99,999 | 13.9% | 13.7% | 12.8% |
| $100,000 to $149,999 | 18.6% | 17.3% | 17.1% |
| $150,000 to $199,999 | 9.5% | 8.3% | 8.8% |
| $200,000 or more | 11.3% | 9.2% | 11.4% |
6.0% of adults in Maricopa County completed < 9th grade.
6.0% of adults in Maricopa County completed 9-12th grade.
22.0% of adults in Maricopa County completed high school / ged.
23.0% of adults in Maricopa County completed some college.
9.0% of adults in Maricopa County completed associate's degree.
22.0% of adults in Maricopa County completed bachelor's degree.
9.0% of adults in Maricopa County completed master's degree.
2.0% of adults in Maricopa County completed professional degree.
1.0% of adults in Maricopa County completed doctorate degree.
| Education | Maricopa County | AZ | USA |
|---|---|---|---|
| < 9th Grade | 6% | 5% | 3% |
| 9-12th Grade | 6% | 6% | 6% |
| High School / GED | 22% | 24% | 26% |
| Some College | 23% | 24% | 20% |
| Associate's Degree | 9% | 9% | 9% |
| Bachelor's Degree | 22% | 20% | 21% |
| Master's Degree | 9% | 9% | 10% |
| Professional Degree | 2% | 2% | 2% |
| Doctorate Degree | 1% | 1% | 2% |
HomeSnacks is based in Durham, NC.
We aim to deliver bite-sized pieces of infotainment about where you live.
We use data, analytics, and a sense of humor to determine quality of life for places across the nation.