Queen Creek, AZ
Demographics And Statistics
Living In Queen Creek, Arizona Summary
Life in Queen Creek research summary. HomeSnacks has been using Saturday Night Science to research the quality of life in Queen Creek over the past nine years using Census, FBI, Zillow, and other primary data sources. Based on the most recently available data, we found the following about life in Queen Creek:
The population in Queen Creek is 66,369.
The median home value in Queen Creek is $633,971.
The median income in Queen Creek is $134,719.
The cost of living in Queen Creek is 135 which is 1.4x higher than the national average.
The median rent in Queen Creek is $2,176.
The unemployment rate in Queen Creek is 4.0%.
The poverty rate in Queen Creek is 3.6%.
The average high in Queen Creek is 85.8° and the average low is 58.1°.
Table Of Contents
Queen Creek SnackAbility
Overall SnackAbility
Queen Creek, AZ Cost Of Living
Cost of living in Queen Creek summary. We use data on the cost of living to determine how expensive it is to live in Queen Creek. Real estate prices drive most of the variance in cost of living around Arizona. Key points include:
The cost of living in Queen Creek is 135 with 100 being average.
The cost of living in Queen Creek is 1.4x higher than the national average.
The median home value in Queen Creek is $633,971.
The median income in Queen Creek is $134,719.
Queen Creek's Overall Cost Of Living
Higher Than The National Average
Cost Of Living In Queen Creek Comparison Table
| Living Expense | Queen Creek | Arizona | National Average | |
|---|---|---|---|---|
| Overall | 135 | 102 | 100 | |
| Services | 116 | 102 | 100 | |
| Groceries | 104 | 103 | 100 | |
| Health | 98 | 95 | 100 | |
| Housing | 192 | 99 | 100 | |
| Transportation | 124 | 107 | 100 | |
| Utilities | 99 | 96 | 100 | |
Queen Creek, AZ Weather
The average high in Queen Creek is 85.8° and the average low is 58.1°.
There are 20.6 days of precipitation each year.
Expect an average of 9.3 inches of precipitation each year with 0.0 inches of snow.
| Stat | Queen Creek |
|---|---|
| Average Annual High | 85.8 |
| Average Annual Low | 58.1 |
| Annual Precipitation Days | 20.6 |
| Average Annual Precipitation | 9.3 |
| Average Annual Snowfall | 0.0 |
Average High
Days of Rain
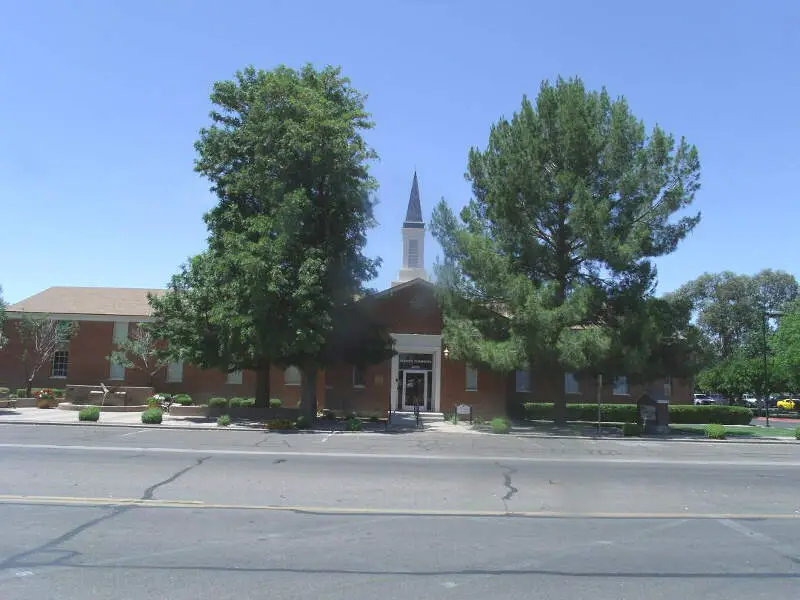
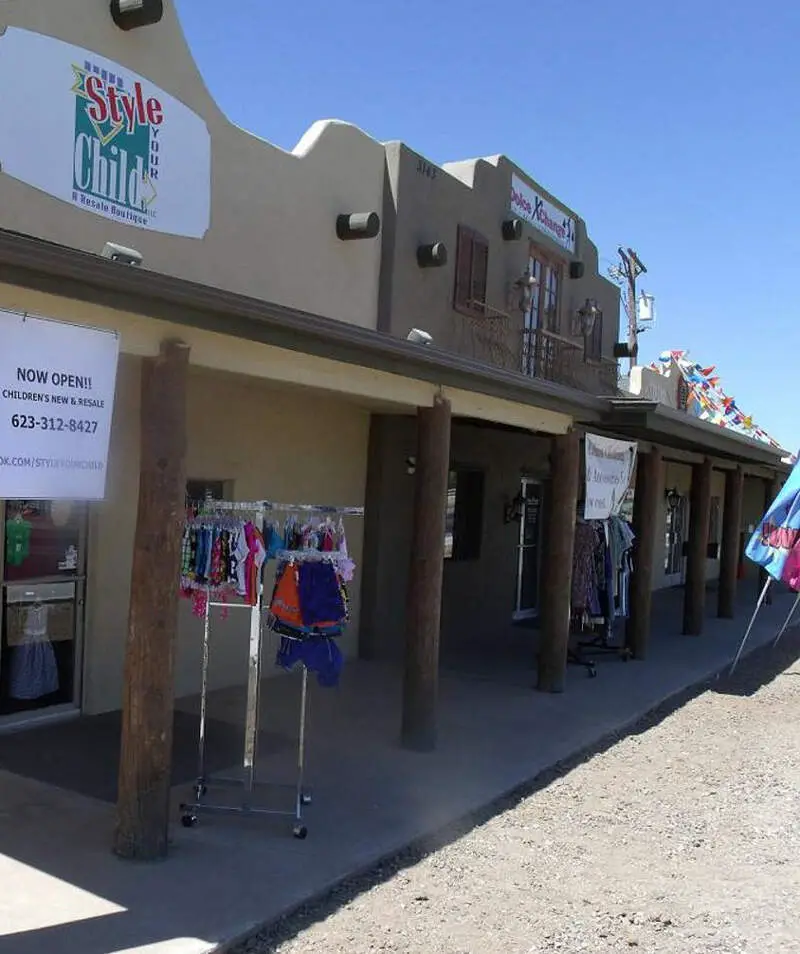
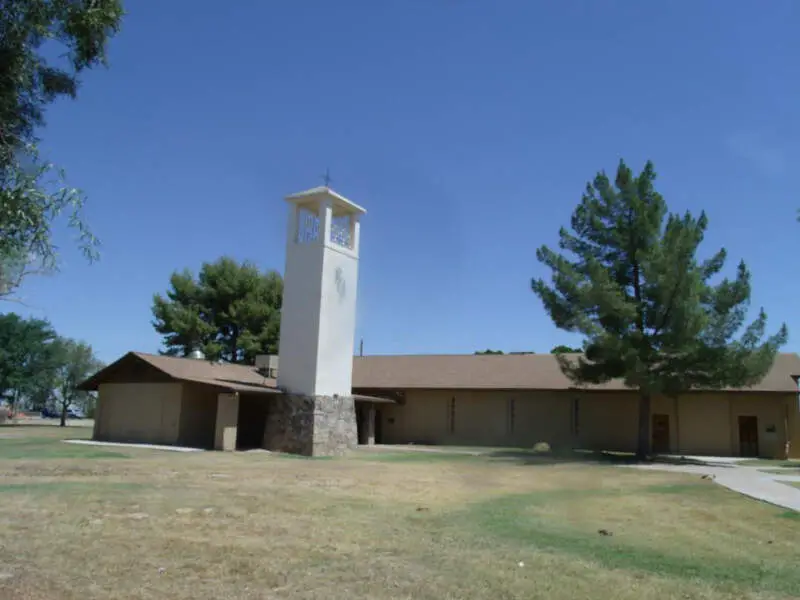
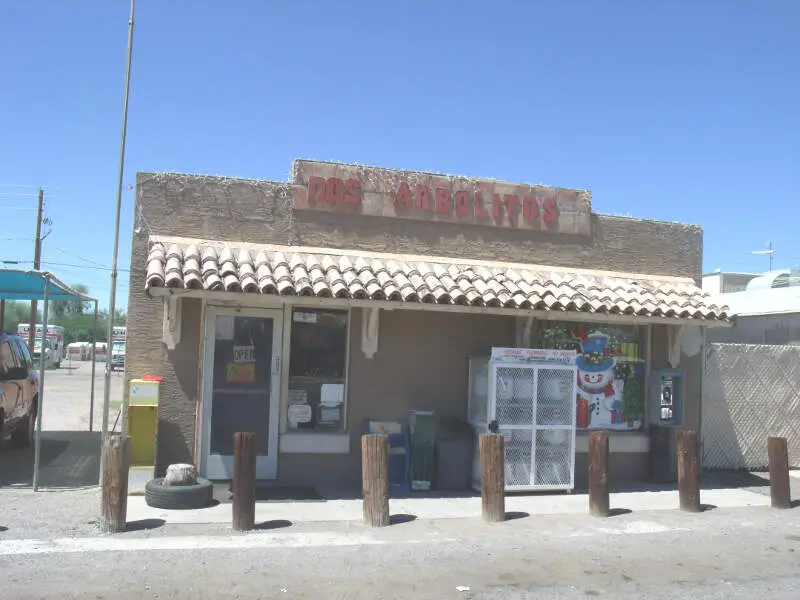
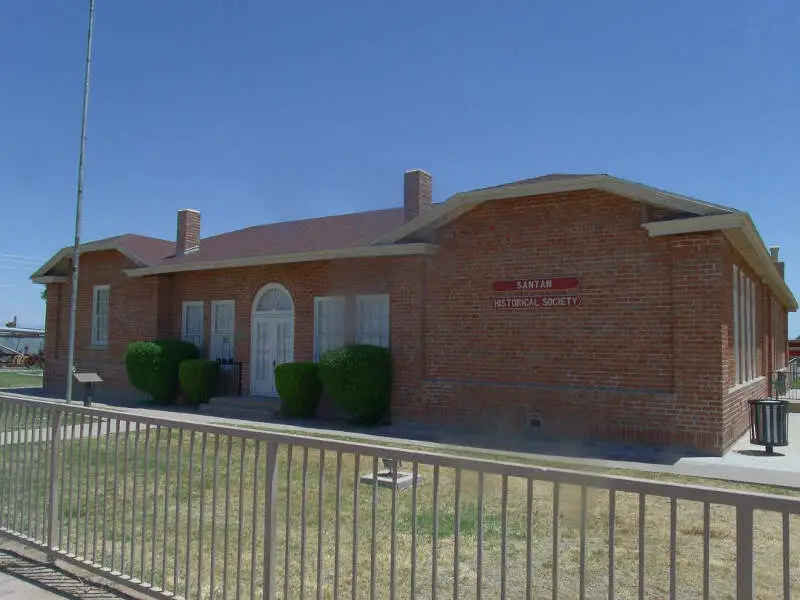
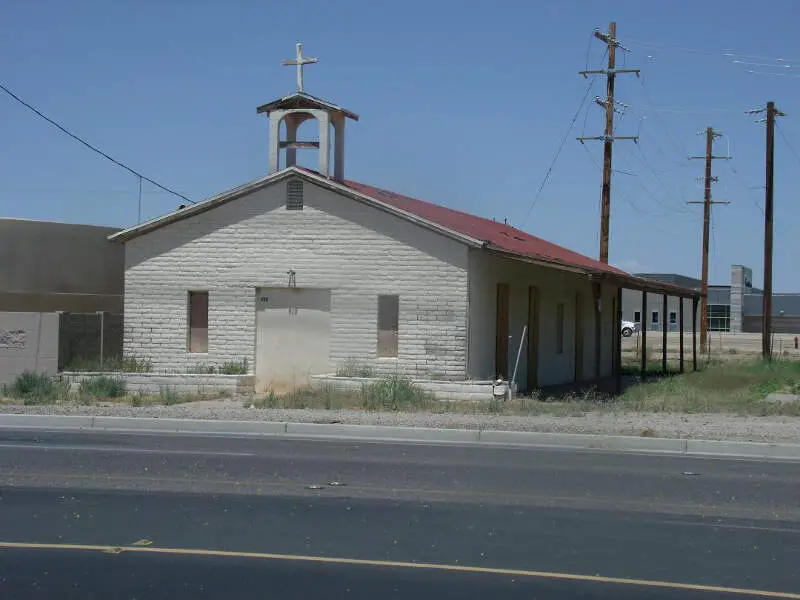
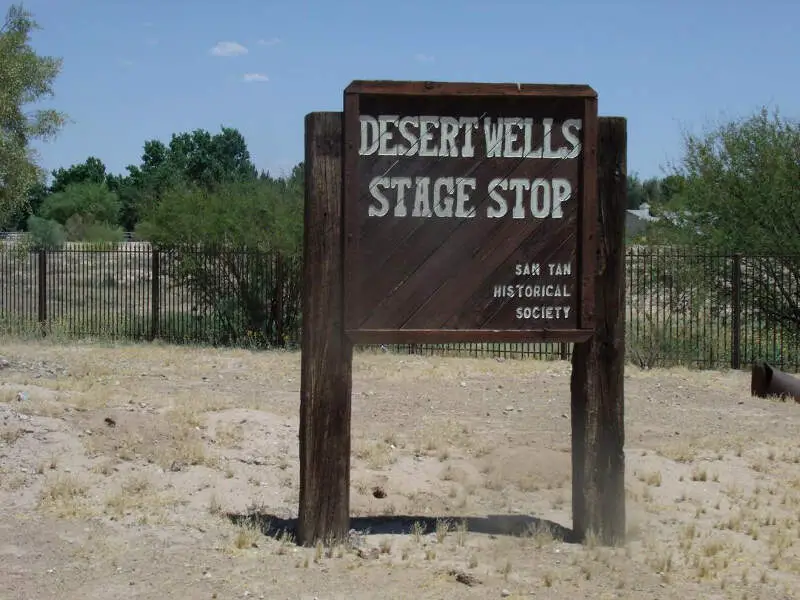
Queen Creek, AZ Photos

1 Reviews & Comments About Queen Creek
/5

HomeSnacks User - 2018-09-06 00:46:28.072842
Very low crime rate; neighborhoods are all tree lined; and there are lots of cafes and shopping.
The movie theater is my favorite place. You don't have to fight for a seat. However, the traffic is horrible. You can't get anywhere quickly. It takes along time to get anywhere. Theres street lights at every quarter mile I think
Rankings for Queen Creek in Arizona


Locations Around Queen Creek
Map Of Queen Creek, AZ
Best Places Around Queen Creek
Gilbert, AZ
Population 271,118
Chandler, AZ
Population 278,123
Sun Lakes, AZ
Population 14,079
Tempe, AZ
Population 186,419
Gold Canyon, AZ
Population 12,488
Mesa, AZ
Population 507,478
San Tan Valley, AZ
Population 105,231
Goodyear, AZ
Population 102,891
Florence, AZ
Population 25,961
Apache Junction, AZ
Population 39,746
Queen Creek Demographics And Statistics
Population over time in Queen Creek
The current population in Queen Creek is 66,369. The population has increased 187.9% from 2010.
| Year | Population | % Change |
|---|---|---|
| 2023 | 66,369 | 7.4% |
| 2022 | 61,788 | 7.0% |
| 2021 | 57,728 | 10.7% |
| 2020 | 52,162 | 20.9% |
| 2019 | 43,129 | 19.6% |
| 2018 | 36,053 | 8.3% |
| 2017 | 33,298 | 7.9% |
| 2016 | 30,849 | 2.3% |
| 2015 | 30,143 | 5.7% |
| 2014 | 28,529 | 5.2% |
| 2013 | 27,120 | 4.9% |
| 2012 | 25,849 | 6.8% |
| 2011 | 24,207 | 5.0% |
| 2010 | 23,055 | - |
Race / Ethnicity in Queen Creek
Queen Creek is:
72.0% White with 47,769 White residents.
3.0% African American with 2,002 African American residents.
0.3% American Indian with 189 American Indian residents.
2.8% Asian with 1,859 Asian residents.
0.5% Hawaiian with 310 Hawaiian residents.
0.6% Other with 396 Other residents.
4.0% Two Or More with 2,664 Two Or More residents.
16.8% Hispanic with 11,180 Hispanic residents.
| Race | Queen Creek | AZ | USA |
|---|---|---|---|
| White | 72.0% | 53.4% | 58.2% |
| African American | 3.0% | 4.4% | 12.0% |
| American Indian | 0.3% | 3.4% | 0.5% |
| Asian | 2.8% | 3.3% | 5.7% |
| Hawaiian | 0.5% | 0.2% | 0.2% |
| Other | 0.6% | 0.4% | 0.5% |
| Two Or More | 4.0% | 3.9% | 3.9% |
| Hispanic | 16.8% | 31.0% | 19.0% |
Gender in Queen Creek
Queen Creek is 51.3% female with 34,068 female residents.
Queen Creek is 48.7% male with 32,301 male residents.
| Gender | Queen Creek | AZ | USA |
|---|---|---|---|
| Female | 51.3% | 50.1% | 50.5% |
| Male | 48.7% | 49.9% | 49.5% |
Highest level of educational attainment in Queen Creek for adults over 25
1.0% of adults in Queen Creek completed < 9th grade.
2.0% of adults in Queen Creek completed 9-12th grade.
19.0% of adults in Queen Creek completed high school / ged.
23.0% of adults in Queen Creek completed some college.
10.0% of adults in Queen Creek completed associate's degree.
30.0% of adults in Queen Creek completed bachelor's degree.
11.0% of adults in Queen Creek completed master's degree.
2.0% of adults in Queen Creek completed professional degree.
2.0% of adults in Queen Creek completed doctorate degree.
| Education | Queen Creek | AZ | USA |
|---|---|---|---|
| < 9th Grade | 1.0% | 6.0% | 5.0% |
| 9-12th Grade | 2.0% | 6.0% | 6.0% |
| High School / GED | 19.0% | 23.0% | 26.0% |
| Some College | 23.0% | 24.0% | 19.0% |
| Associate's Degree | 10.0% | 9.0% | 9.0% |
| Bachelor's Degree | 30.0% | 20.0% | 21.0% |
| Master's Degree | 11.0% | 9.0% | 10.0% |
| Professional Degree | 2.0% | 2.0% | 2.0% |
| Doctorate Degree | 2.0% | 1.0% | 2.0% |
Household Income For Queen Creek, Arizona
2.3% of households in Queen Creek earn Less than $10,000.
0.7% of households in Queen Creek earn $10,000 to $14,999.
0.9% of households in Queen Creek earn $15,000 to $24,999.
2.4% of households in Queen Creek earn $25,000 to $34,999.
3.1% of households in Queen Creek earn $35,000 to $49,999.
9.9% of households in Queen Creek earn $50,000 to $74,999.
11.1% of households in Queen Creek earn $75,000 to $99,999.
26.9% of households in Queen Creek earn $100,000 to $149,999.
19.0% of households in Queen Creek earn $150,000 to $199,999.
23.7% of households in Queen Creek earn $200,000 or more.
| Income | Queen Creek | AZ | USA |
|---|---|---|---|
| Less than $10,000 | 2.3% | 4.9% | 4.9% |
| $10,000 to $14,999 | 0.7% | 2.9% | 3.6% |
| $15,000 to $24,999 | 0.9% | 6.1% | 6.6% |
| $25,000 to $34,999 | 2.4% | 6.9% | 6.8% |
| $35,000 to $49,999 | 3.1% | 10.9% | 10.4% |
| $50,000 to $74,999 | 9.9% | 17.0% | 15.7% |
| $75,000 to $99,999 | 11.1% | 13.6% | 12.7% |
| $100,000 to $149,999 | 26.9% | 18.1% | 17.4% |
| $150,000 to $199,999 | 19.0% | 9.0% | 9.3% |
| $200,000 or more | 23.7% | 10.6% | 12.6% |


