Wickenburg, AZ
Demographics And Statistics
Living In Wickenburg, Arizona Summary
Life in Wickenburg research summary. HomeSnacks has been using Saturday Night Science to research the quality of life in Wickenburg over the past nine years using Census, FBI, Zillow, and other primary data sources. Based on the most recently available data, we found the following about life in Wickenburg:
The population in Wickenburg is 7,468.
The median home value in Wickenburg is $523,704.
The median income in Wickenburg is $65,253.
The cost of living in Wickenburg is 103 which is 1.0x higher than the national average.
The median rent in Wickenburg is $975.
The unemployment rate in Wickenburg is 0.5%.
The poverty rate in Wickenburg is 16.4%.
The average high in Wickenburg is 85.8° and the average low is 58.1°.
Wickenburg SnackAbility
Overall SnackAbility
Wickenburg, AZ Crime Report
Crime in Wickenburg summary. We use data from the FBI to determine the crime rates in Wickenburg. Key points include:
There were 81 total crimes in Wickenburg in the last reporting year.
The overall crime rate per 100,000 people in Wickenburg is 970.9 / 100k people.
The violent crime rate per 100,000 people in Wickenburg is 107.9 / 100k people.
The property crime rate per 100,000 people in Wickenburg is 863.0 / 100k people.
Overall, crime in Wickenburg is -54.19% below the national average.
Total Crimes
Below National Average
Crime In Wickenburg Comparison Table
| Statistic | Count Raw |
Wickenburg / 100k People |
Arizona / 100k People |
National / 100k People |
|---|---|---|---|---|
| Total Crimes Per 100K | 81 | 970.9 | 2,214.0 | 2,119.2 |
| Violent Crime | 9 | 107.9 | 421.9 | 359.0 |
| Murder | 0 | 0.0 | 4.9 | 5.0 |
| Robbery | 0 | 0.0 | 64.6 | 61.0 |
| Aggravated Assault | 9 | 107.9 | 312.4 | 256.0 |
| Property Crime | 72 | 863.0 | 1,792.1 | 1,760.0 |
| Burglary | 17 | 203.8 | 217.8 | 229.0 |
| Larceny | 46 | 551.4 | 1,329.9 | 1,272.0 |
| Car Theft | 9 | 107.9 | 244.4 | 259.0 |
Wickenburg, AZ Cost Of Living
Cost of living in Wickenburg summary. We use data on the cost of living to determine how expensive it is to live in Wickenburg. Real estate prices drive most of the variance in cost of living around Arizona. Key points include:
The cost of living in Wickenburg is 103 with 100 being average.
The cost of living in Wickenburg is 1.0x higher than the national average.
The median home value in Wickenburg is $523,704.
The median income in Wickenburg is $65,253.
Wickenburg's Overall Cost Of Living
Higher Than The National Average
Cost Of Living In Wickenburg Comparison Table
| Living Expense | Wickenburg | Arizona | National Average | |
|---|---|---|---|---|
| Overall | 103 | 102 | 100 | |
| Services | 100 | 102 | 100 | |
| Groceries | 98 | 103 | 100 | |
| Health | 88 | 95 | 100 | |
| Housing | 111 | 99 | 100 | |
| Transportation | 93 | 107 | 100 | |
| Utilities | 125 | 96 | 100 | |
Wickenburg, AZ Weather
The average high in Wickenburg is 85.8° and the average low is 58.1°.
There are 20.6 days of precipitation each year.
Expect an average of 9.3 inches of precipitation each year with 0.0 inches of snow.
| Stat | Wickenburg |
|---|---|
| Average Annual High | 85.8 |
| Average Annual Low | 58.1 |
| Annual Precipitation Days | 20.6 |
| Average Annual Precipitation | 9.3 |
| Average Annual Snowfall | 0.0 |
Average High
Days of Rain
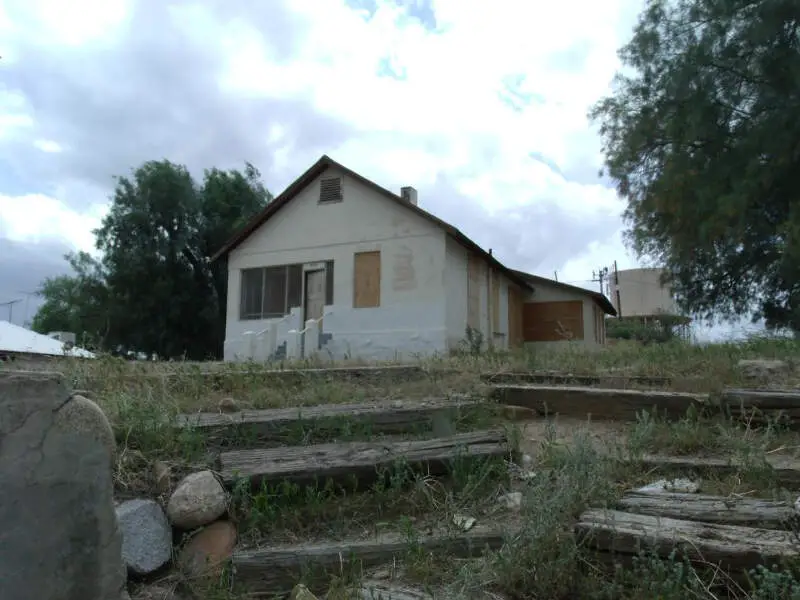
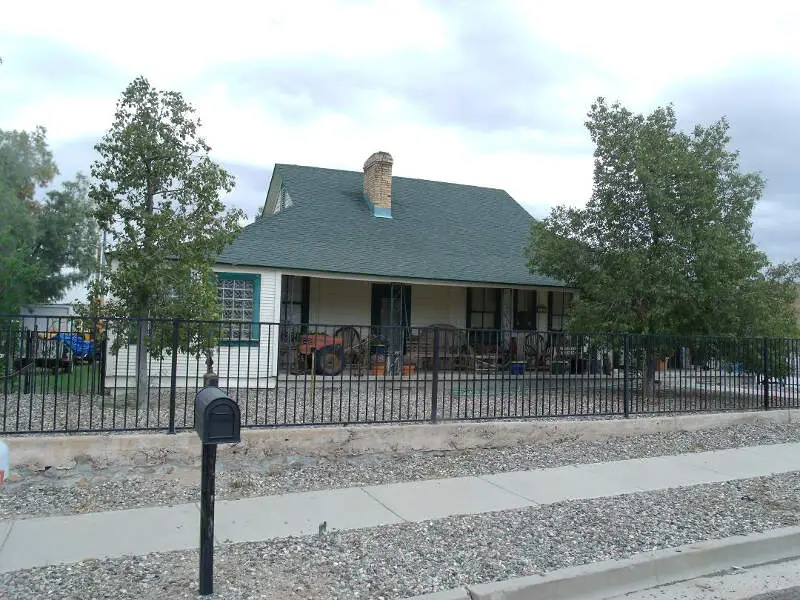
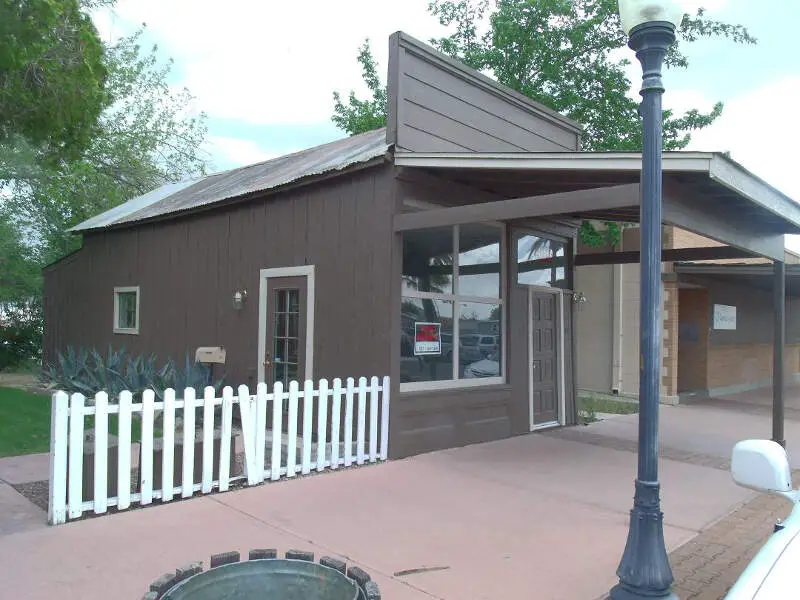
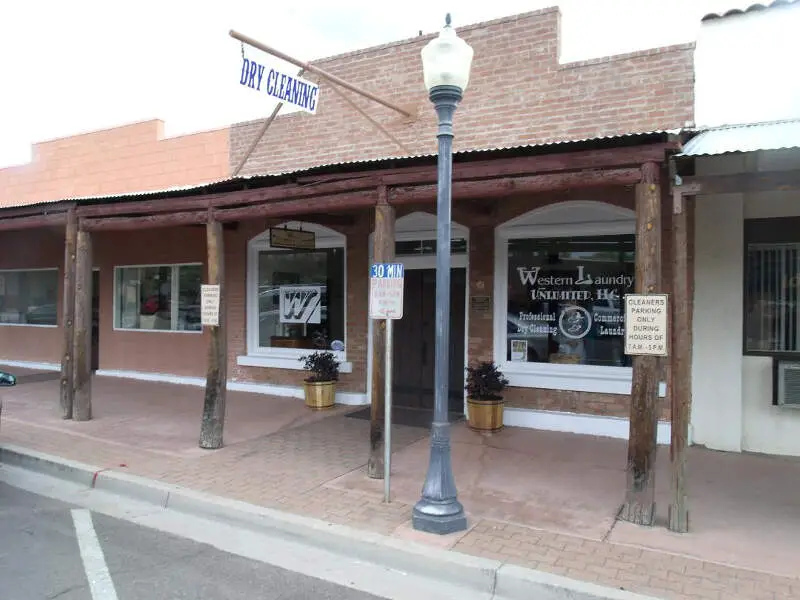
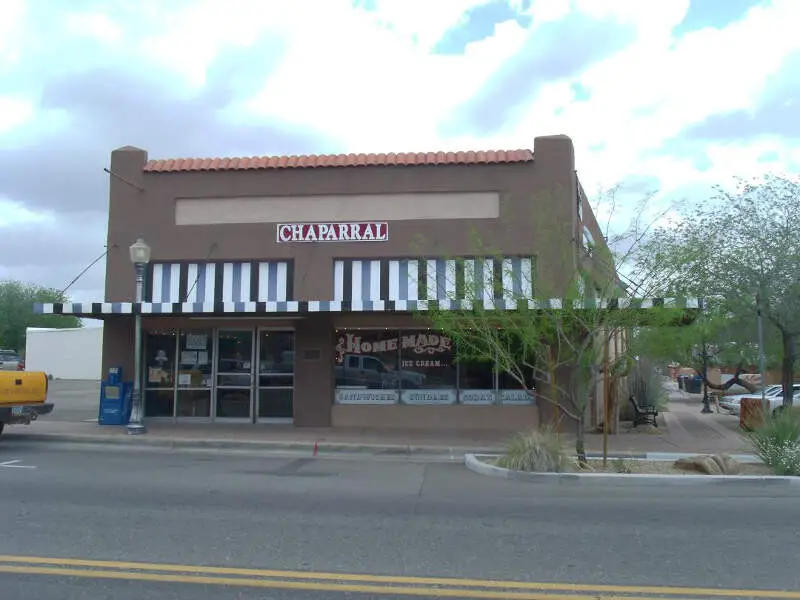
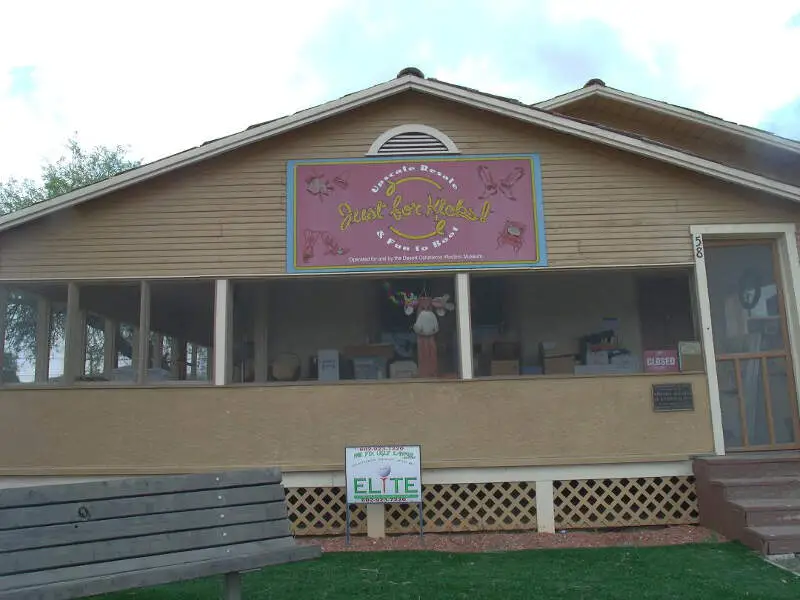
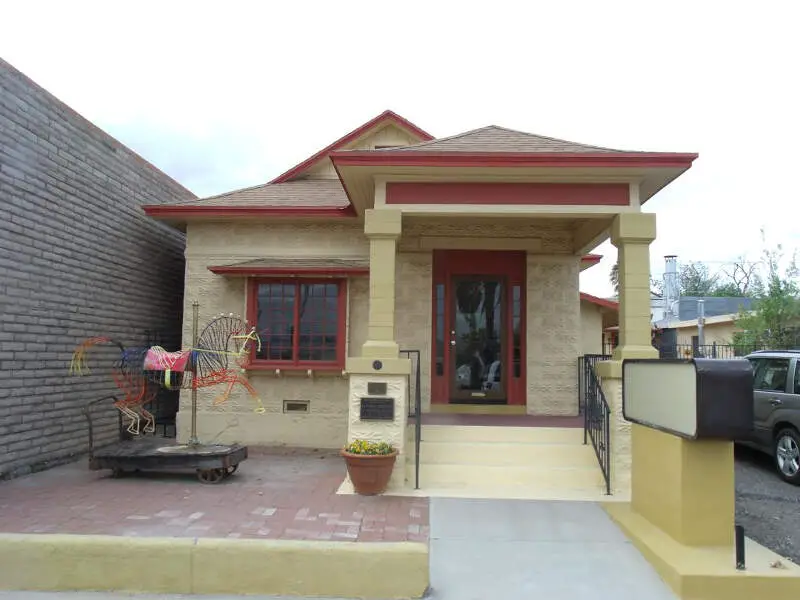
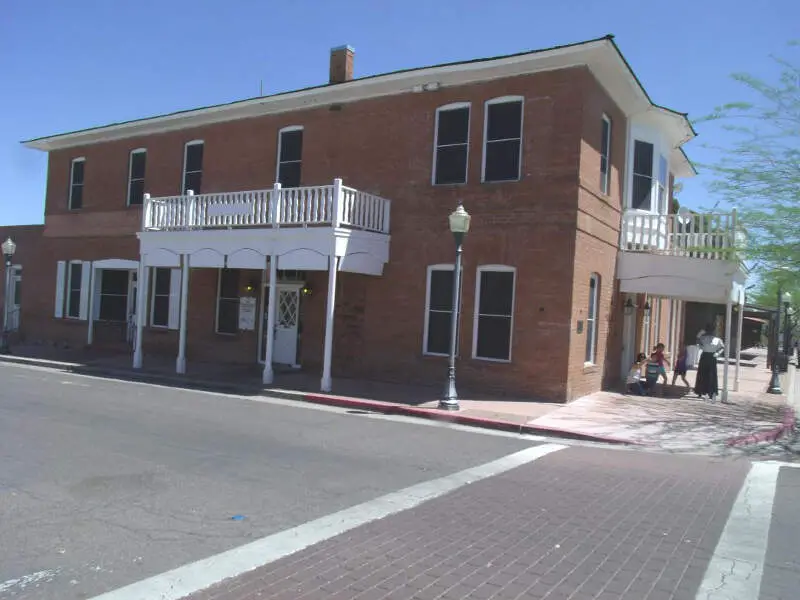
Wickenburg, AZ Photos

Rankings for Wickenburg in Arizona


Locations Around Wickenburg
Map Of Wickenburg, AZ
Best Places Around Wickenburg
Litchfield Park, AZ
Population 6,871
New River, AZ
Population 18,365
Peoria, AZ
Population 194,338
Surprise, AZ
Population 149,519
Cave Creek, AZ
Population 5,033
Glendale, AZ
Population 250,193
Phoenix, AZ
Population 1,624,832
Prescott Valley, AZ
Population 48,048
El Mirage, AZ
Population 35,823
Wickenburg Demographics And Statistics
Population over time in Wickenburg
The current population in Wickenburg is 7,468. The population has increased 14.6% from 2010.
| Year | Population | % Change |
|---|---|---|
| 2023 | 7,468 | -1.7% |
| 2022 | 7,600 | 3.3% |
| 2021 | 7,359 | -4.5% |
| 2020 | 7,708 | 2.8% |
| 2019 | 7,495 | 6.8% |
| 2018 | 7,021 | 1.7% |
| 2017 | 6,906 | 2.1% |
| 2016 | 6,766 | 2.2% |
| 2015 | 6,620 | -0.1% |
| 2014 | 6,629 | 1.0% |
| 2013 | 6,564 | 0.6% |
| 2012 | 6,525 | 0.2% |
| 2011 | 6,509 | -0.1% |
| 2010 | 6,517 | - |
Race / Ethnicity in Wickenburg
Wickenburg is:
87.3% White with 6,521 White residents.
0.6% African American with 47 African American residents.
1.2% American Indian with 90 American Indian residents.
0.2% Asian with 16 Asian residents.
0.0% Hawaiian with 0 Hawaiian residents.
0.0% Other with 0 Other residents.
2.5% Two Or More with 186 Two Or More residents.
8.1% Hispanic with 608 Hispanic residents.
| Race | Wickenburg | AZ | USA |
|---|---|---|---|
| White | 87.3% | 53.4% | 58.2% |
| African American | 0.6% | 4.4% | 12.0% |
| American Indian | 1.2% | 3.4% | 0.5% |
| Asian | 0.2% | 3.3% | 5.7% |
| Hawaiian | 0.0% | 0.2% | 0.2% |
| Other | 0.0% | 0.4% | 0.5% |
| Two Or More | 2.5% | 3.9% | 3.9% |
| Hispanic | 8.1% | 31.0% | 19.0% |
Gender in Wickenburg
Wickenburg is 52.9% female with 3,952 female residents.
Wickenburg is 47.1% male with 3,516 male residents.
| Gender | Wickenburg | AZ | USA |
|---|---|---|---|
| Female | 52.9% | 50.1% | 50.5% |
| Male | 47.1% | 49.9% | 49.5% |
Highest level of educational attainment in Wickenburg for adults over 25
-0.0% of adults in Wickenburg completed < 9th grade.
3.0% of adults in Wickenburg completed 9-12th grade.
29.0% of adults in Wickenburg completed high school / ged.
24.0% of adults in Wickenburg completed some college.
7.0% of adults in Wickenburg completed associate's degree.
19.0% of adults in Wickenburg completed bachelor's degree.
14.0% of adults in Wickenburg completed master's degree.
3.0% of adults in Wickenburg completed professional degree.
1.0% of adults in Wickenburg completed doctorate degree.
| Education | Wickenburg | AZ | USA |
|---|---|---|---|
| < 9th Grade | -0.0% | 6.0% | 5.0% |
| 9-12th Grade | 3.0% | 6.0% | 6.0% |
| High School / GED | 29.0% | 23.0% | 26.0% |
| Some College | 24.0% | 24.0% | 19.0% |
| Associate's Degree | 7.0% | 9.0% | 9.0% |
| Bachelor's Degree | 19.0% | 20.0% | 21.0% |
| Master's Degree | 14.0% | 9.0% | 10.0% |
| Professional Degree | 3.0% | 2.0% | 2.0% |
| Doctorate Degree | 1.0% | 1.0% | 2.0% |
Household Income For Wickenburg, Arizona
8.6% of households in Wickenburg earn Less than $10,000.
6.5% of households in Wickenburg earn $10,000 to $14,999.
8.0% of households in Wickenburg earn $15,000 to $24,999.
7.0% of households in Wickenburg earn $25,000 to $34,999.
10.8% of households in Wickenburg earn $35,000 to $49,999.
17.9% of households in Wickenburg earn $50,000 to $74,999.
14.1% of households in Wickenburg earn $75,000 to $99,999.
13.2% of households in Wickenburg earn $100,000 to $149,999.
6.1% of households in Wickenburg earn $150,000 to $199,999.
7.7% of households in Wickenburg earn $200,000 or more.
| Income | Wickenburg | AZ | USA |
|---|---|---|---|
| Less than $10,000 | 8.6% | 4.9% | 4.9% |
| $10,000 to $14,999 | 6.5% | 2.9% | 3.6% |
| $15,000 to $24,999 | 8.0% | 6.1% | 6.6% |
| $25,000 to $34,999 | 7.0% | 6.9% | 6.8% |
| $35,000 to $49,999 | 10.8% | 10.9% | 10.4% |
| $50,000 to $74,999 | 17.9% | 17.0% | 15.7% |
| $75,000 to $99,999 | 14.1% | 13.6% | 12.7% |
| $100,000 to $149,999 | 13.2% | 18.1% | 17.4% |
| $150,000 to $199,999 | 6.1% | 9.0% | 9.3% |
| $200,000 or more | 7.7% | 10.6% | 12.6% |


