Are you looking for love in Illinois?
Or are you just hoping to hook up with a hot Illinoisan?
Either way, we’ve got you covered here.
If you live in Illinois, there’s a pretty good chance there are a lot of singles in your area. The Prairie State has plenty of people over 18 who aren’t married or in a serious relationship.
That’s great news for people who are single and looking to mingle.
So, where are the best cities for singles in Illinois? We used Saturday Night Science to find out.
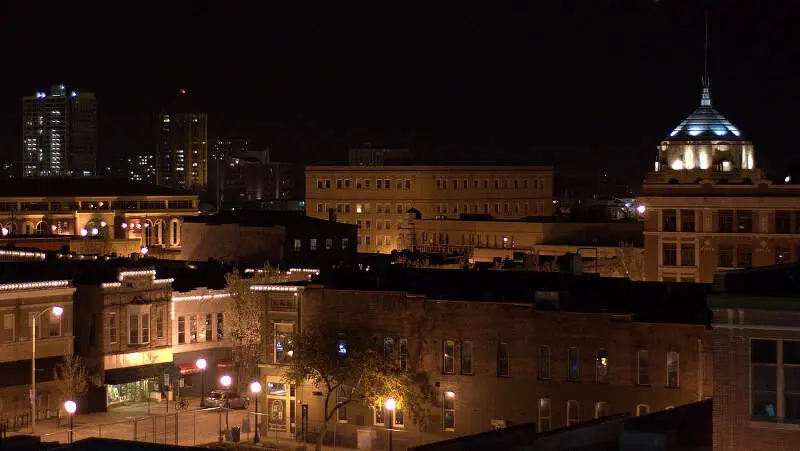
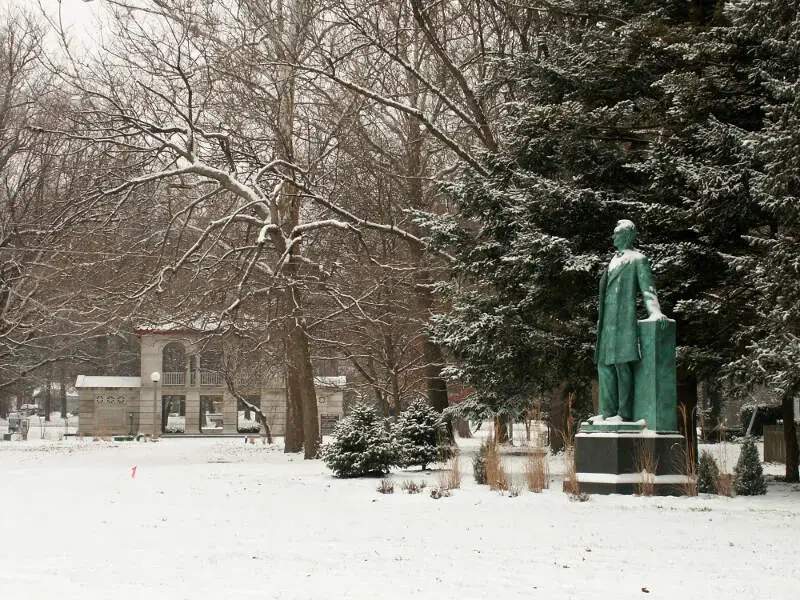
26.6 median age · 15.0% married households
Champaign is a city in Champaign County, Illinois, United States. The city is 135 miles south of Chicago, 124 miles west of Indianapolis, Indiana, and 178mi northeast of St. Louis, Missouri. The United States Census Bureau estimates the city was home to 84,513 people as of July 1, 2014. Champaign is the tenth-most populous city in Illinois, and the state’s fourth-most populous city outside the Chicago metropolitan area.
Data | Crime | Cost of living | Movers
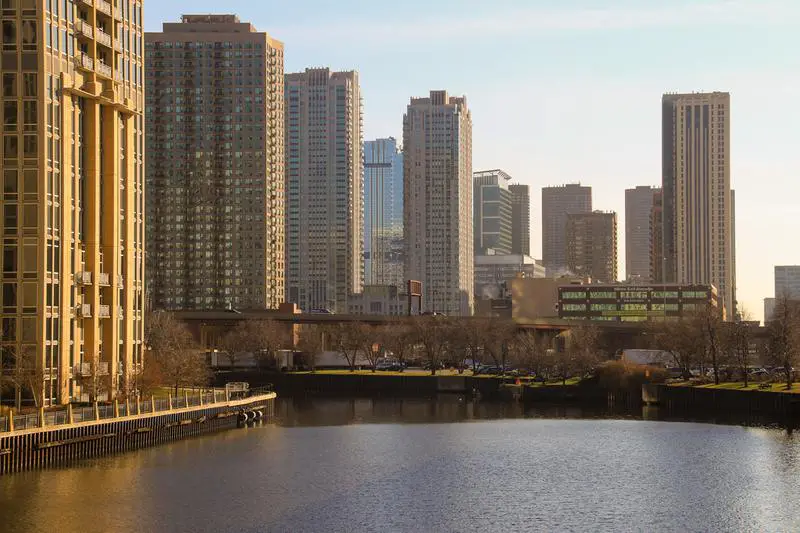
35.8 median age · 14.0% married households
Chicago or ), officially the City of Chicago, is the third-most populous city in the United States. With over 2.7million residents, it is also the most populous city in both the state of Illinois and the Midwestern United States. It is the county seat of Cook County. The Chicago metropolitan area, often referred to as Chicagoland, has nearly 10million people and is the third-largest in the United States. Chicago has often been called a global architecture capital and is considered one of the most important business centers in the world.
Data | Crime | Cost of living | Movers
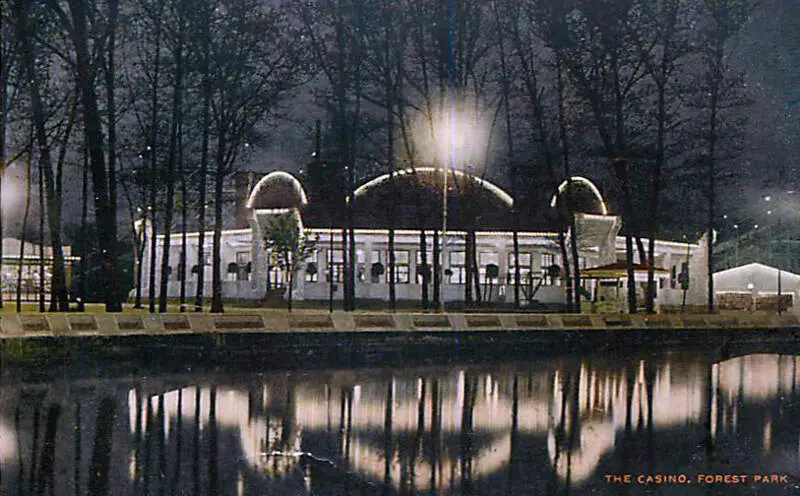
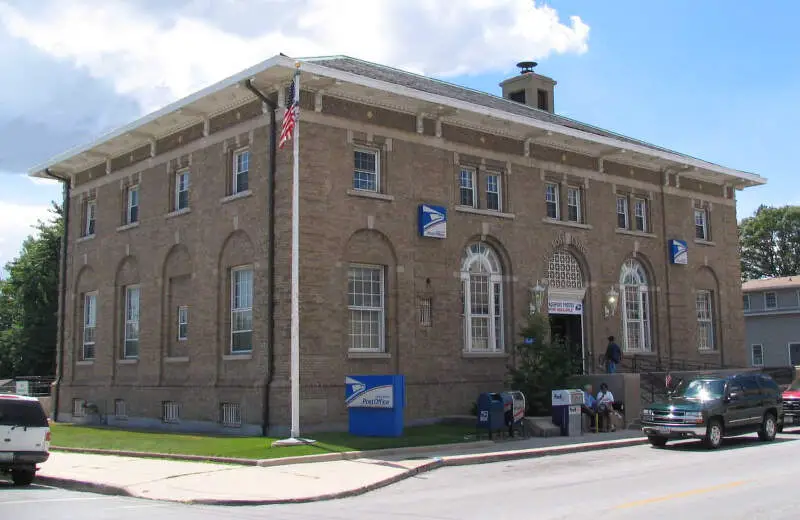
40.0 median age · 17.0% married households
Forest Park is a village in Cook County, Illinois, a suburb of Chicago, United States. The population was 14,167 at the 2010 census. The Forest Park terminal on the CTA Blue Line is the line’s western terminus, located on the Eisenhower Expressway at Des Plaines Avenue.
Data | Crime | Cost of living | Movers
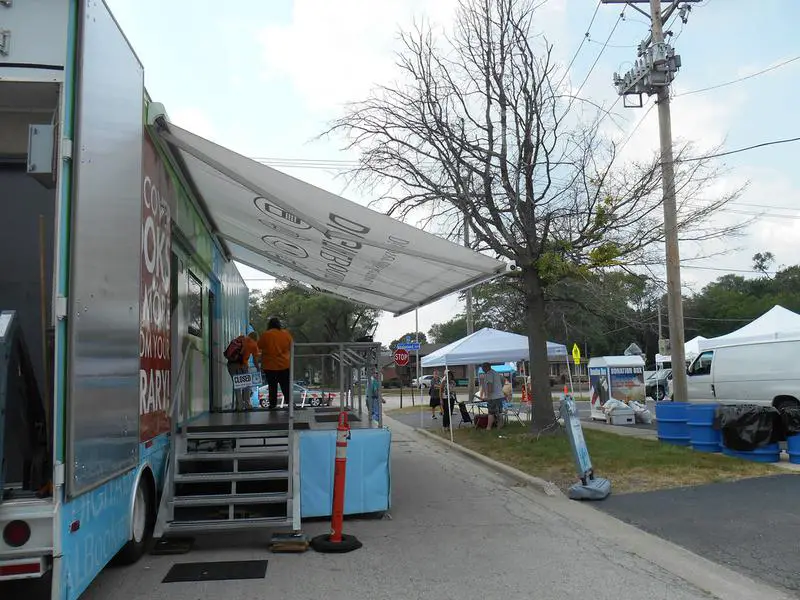
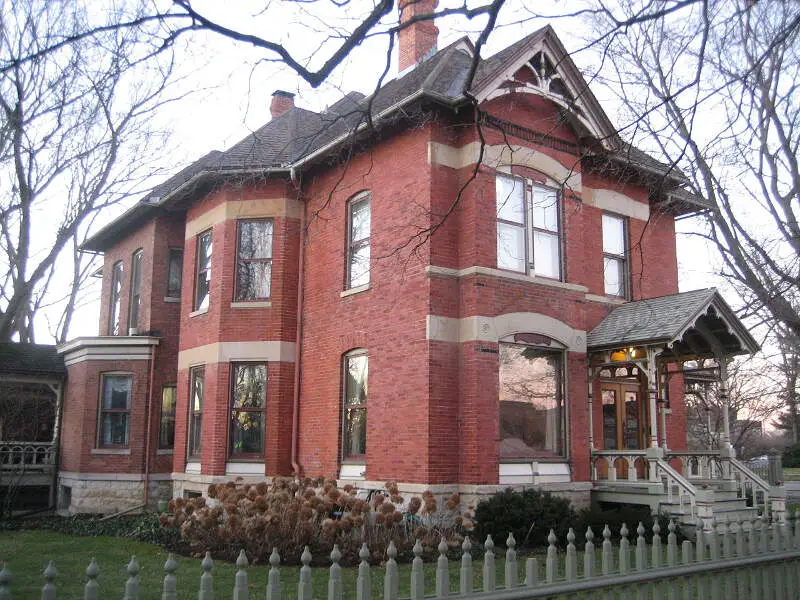
34.0 median age · 19.0% married households
Chicago Ridge is a village in Cook County, Illinois, United States. The population was 14,305 at the 2010 census.
Data | Crime | Cost of living | Movers
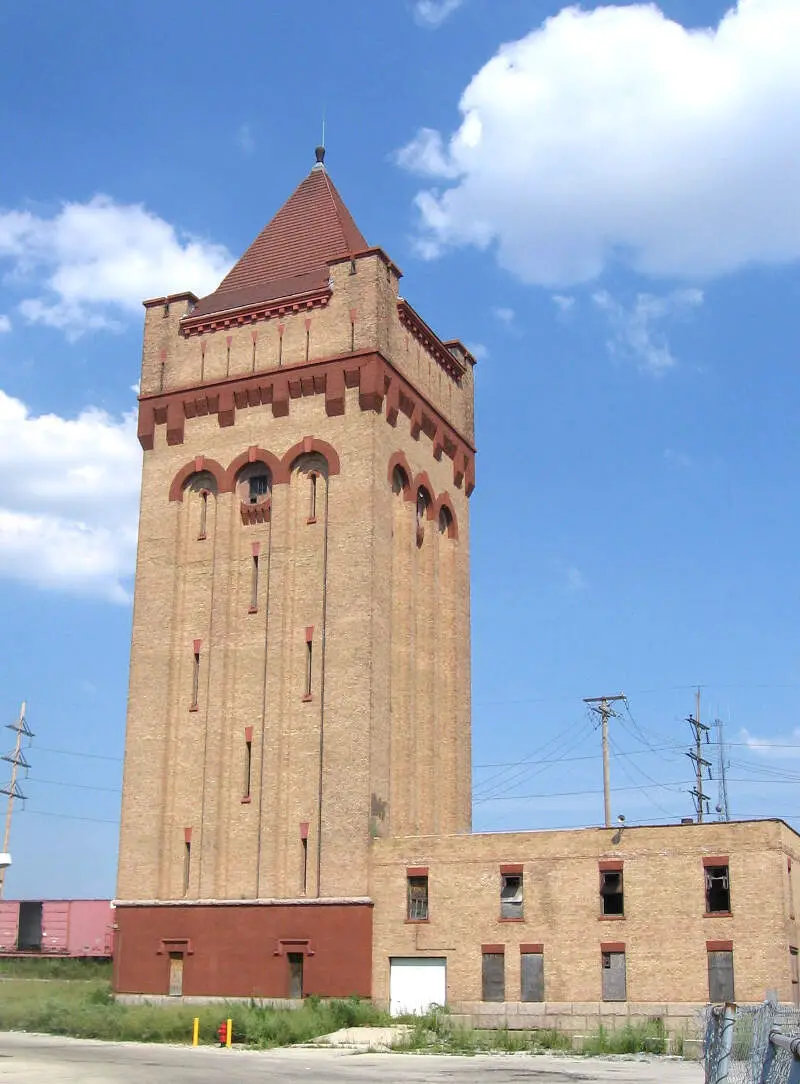
26.1 median age · 11.0% married households
Urbana is a city in and the county seat of Champaign County, Illinois, United States. The population was 41,250 at the 2010 census. Urbana is the tenth-most populous city in Illinois outside of the Chicago metropolitan area.
Data | Crime | Cost of living | Movers
38.1 median age · 13.0% married households
Blue Island is a city in Cook County, Illinois, located approximately 16 miles south of Chicago’s Loop. Blue Island is adjacent to the city of Chicago and shares its northern boundary with that city’s Morgan Park neighborhood. The population was 23,706 at the 2010 United States Census.
Data | Crime | Cost of living | Movers
36.1 median age · 14.0% married households
Glendale Heights is a village in DuPage County, Illinois, United States. The population was 34,208 at the 2010 census. It is best known nationally as the hometown of Smashing Pumpkins founder Billy Corgan, but known more locally for its ethnically diverse population. The town elected Dupage County’s first Asian mayor in 1995.
Data | Crime | Cost of living | Movers
26.1 median age · 16.0% married households
DeKalb is a city in DeKalb County, Illinois, United States. The population was 43,862 according to the 2010 census, up from 39,018 at the 2000 census. The city is named after decorated German war hero Johann de Kalb, who died during the American Revolutionary War.
Data | Crime | Cost of living | Movers
34.4 median age · 9.0% married households
Cicero is a suburb of Chicago and an incorporated town in Cook County, Illinois, United States. The population was 83,891 at the 2010 census. As of 2013, the town had a total population of 84,103, making it the 11th largest municipality in Illinois. Cicero is named for the town of Cicero, New York, which in turn was named for Marcus Tullius Cicero, the Roman statesman and orator.
Data | Crime | Cost of living | Movers
36.6 median age · 17.0% married households
Data | Crime | Cost of living | Movers
The receipts
Compare the top ten
Pick a metric. The bars rescale. The red line is Illinois’s statewide median.
On the map
Where Illinois’s singles cluster
Saturday Night Science
Methodology: How do you determine which city is best for singles in Illinois anyways?
To give you the places in Illinois which are best for singles to find one another, we used Saturday Night Science to look at a handful of metrics. Of course, we want to measure the type of people who live in each city and make some assumptions about what single people like.
So we researched the internet for a database that contains all that information.
We threw a lot of criteria at this one to get the best, most complete results possible. Using the 2020-2024 American Community Survey Census data produced for the state of Illinois, we looked at every single city in the state. We paid particular attention to:
- Population density
- % of population that’s male vs. female (closer to a 50-50 ratio is better)
- % of households with kids
- Median age
- Number of unmarried people in each city
We then gave each city a “Singles Score.”
The higher the score, the better the city is for singles to find one another. We also limited our results to cities with over 10,000 people. For Illinois, that meant a total of 221 cities.
We updated this article for 2026. This is our eleventh time ranking the best cities for singles in Illinois.
Read on to see why Champaign is the talk of the town while Campton Hills is probably a bit on the bland side.
The full plate
Best Cities For Singles In Illinois
Click any column to sort. Search by city name.
| Rank | City | Singles Score | Population | Median Age | % Married Households | % Households w/ Kids |
|---|---|---|---|---|---|---|
| 1 | Champaign | 29.30 | 89,996 | 26.6 | 15.0% | 18.9% |
| 2 | Chicago | 38.70 | 2,711,226 | 35.8 | 14.0% | 23.3% |
| 3 | Forest Park | 38.70 | 13,943 | 40.0 | 17.0% | 19.3% |
| 4 | Chicago Ridge | 40.00 | 14,099 | 34.0 | 19.0% | 29.3% |
| 5 | Urbana | 44.90 | 39,341 | 26.1 | 11.0% | 14.2% |
| 6 | Blue Island | 46.10 | 21,741 | 38.1 | 13.0% | 26.7% |
| 7 | Glendale Heights | 48.30 | 32,808 | 36.1 | 14.0% | 31.5% |
| 8 | DeKalb | 50.70 | 40,443 | 26.1 | 16.0% | 25.6% |
| 9 | Cicero | 50.90 | 82,797 | 34.4 | 9.0% | 42.3% |
| 10 | Justice | 53.40 | 12,324 | 36.6 | 17.0% | 32.5% |
| 11 | Evanston | 53.50 | 76,340 | 38.4 | 15.0% | 23.3% |
| 12 | Carbondale | 53.50 | 22,158 | 24.6 | 7.0% | 15.6% |
| 13 | Rock Island | 57.80 | 36,151 | 37.4 | 21.0% | 24.2% |
| 14 | Maywood | 58.10 | 23,201 | 34.6 | 15.0% | 37.7% |
| 15 | Carpentersville | 61.80 | 37,346 | 33.8 | 15.0% | 43.2% |
| 16 | Burbank | 61.90 | 28,739 | 38.6 | 19.0% | 35.6% |
| 17 | Hanover Park | 62.10 | 36,732 | 35.3 | 16.0% | 40.6% |
| 18 | Streamwood | 63.10 | 39,001 | 40.0 | 16.0% | 32.7% |
| 19 | Harvey | 63.30 | 20,230 | 36.6 | 13.0% | 31.5% |
| 20 | Aurora | 65.00 | 179,898 | 35.2 | 18.0% | 40.9% |
| 21 | Wheaton | 67.00 | 53,557 | 36.8 | 27.0% | 28.9% |
| 22 | Waukegan | 67.40 | 89,076 | 35.5 | 11.0% | 33.0% |
| 23 | Normal | 68.80 | 53,569 | 25.0 | 20.0% | 21.9% |
| 24 | Riverdale | 69.40 | 10,340 | 32.8 | 15.0% | 33.3% |
| 25 | Dolton | 70.20 | 20,825 | 40.3 | 19.0% | 27.6% |
| 26 | Northlake | 70.20 | 12,513 | 41.9 | 15.0% | 27.0% |
| 27 | Warrenville | 71.60 | 14,718 | 36.5 | 25.0% | 27.6% |
| 28 | Midlothian | 71.80 | 13,948 | 38.3 | 31.0% | 27.0% |
| 29 | Jacksonville | 72.10 | 18,014 | 37.6 | 27.0% | 21.2% |
| 30 | Rolling Meadows | 72.50 | 24,027 | 39.5 | 21.0% | 30.3% |
| 31 | Lisle | 73.80 | 23,407 | 36.5 | 27.0% | 27.2% |
| 32 | Berwyn | 75.70 | 55,595 | 37.8 | 18.0% | 35.4% |
| 33 | Moline | 77.10 | 42,197 | 38.0 | 25.0% | 28.6% |
| 34 | Summit | 78.30 | 10,846 | 38.1 | 8.0% | 33.5% |
| 35 | Macomb | 78.70 | 14,894 | 27.6 | 17.0% | 17.6% |
| 36 | Wheeling | 78.90 | 38,433 | 39.9 | 13.0% | 26.3% |
| 37 | Carol Stream | 79.20 | 39,460 | 40.4 | 24.0% | 29.4% |
| 38 | Elmwood Park | 80.30 | 23,868 | 41.5 | 21.0% | 27.0% |
| 39 | Lyons | 80.80 | 10,339 | 40.8 | 22.0% | 29.6% |
| 40 | Hickory Hills | 81.20 | 14,526 | 38.8 | 19.0% | 33.4% |
| 41 | Worth | 82.80 | 10,700 | 39.4 | 25.0% | 27.4% |
| 42 | Lombard | 83.00 | 43,619 | 39.2 | 30.0% | 26.9% |
| 43 | Schaumburg | 83.90 | 76,868 | 39.6 | 23.0% | 30.9% |
| 44 | Franklin Park | 84.10 | 18,197 | 38.3 | 14.0% | 35.1% |
| 45 | Charleston | 85.30 | 17,062 | 29.6 | 27.0% | 17.5% |
| 46 | Bloomington | 86.10 | 78,907 | 36.2 | 27.0% | 26.6% |
| 47 | Mundelein | 87.60 | 31,915 | 38.1 | 23.0% | 32.0% |
| 48 | Rockford | 87.80 | 147,521 | 37.7 | 21.0% | 27.4% |
| 49 | Peoria | 88.50 | 112,169 | 35.5 | 23.0% | 26.1% |
| 50 | Bridgeview | 88.60 | 16,849 | 39.4 | 17.0% | 28.4% |
| 51 | Niles | 89.10 | 30,064 | 48.2 | 15.0% | 27.8% |
| 52 | River Grove | 89.50 | 10,451 | 36.3 | 20.0% | 30.3% |
| 53 | Palatine | 90.00 | 66,293 | 40.7 | 23.0% | 27.6% |
| 54 | Streator | 90.20 | 12,330 | 37.6 | 32.0% | 25.9% |
| 55 | Park Forest | 90.30 | 21,156 | 36.9 | 19.0% | 29.0% |
| 56 | Oak Park | 90.40 | 53,292 | 40.3 | 21.0% | 28.5% |
| 57 | Palos Hills | 91.60 | 18,081 | 41.7 | 23.0% | 26.3% |
| 58 | North Chicago | 91.80 | 30,643 | 23.2 | 5.0% | 36.0% |
| 59 | Round Lake Beach | 92.20 | 27,079 | 33.8 | 19.0% | 40.8% |
| 60 | Melrose Park | 92.40 | 24,549 | 37.3 | 11.0% | 37.1% |
| 61 | Mount Prospect | 93.10 | 55,472 | 41.1 | 25.0% | 31.2% |
| 62 | Zion | 93.30 | 24,600 | 32.3 | 15.0% | 37.9% |
| 63 | Belvidere | 93.50 | 24,752 | 38.7 | 22.0% | 31.6% |
| 64 | Oak Lawn | 94.00 | 56,861 | 40.3 | 31.0% | 28.7% |
| 65 | Quincy | 94.00 | 39,109 | 39.7 | 28.0% | 24.9% |
| 66 | Kankakee | 94.30 | 23,996 | 36.1 | 18.0% | 33.3% |
| 67 | Elgin | 94.60 | 114,934 | 36.7 | 20.0% | 36.2% |
| 68 | Glen Ellyn | 95.00 | 28,390 | 39.8 | 30.0% | 34.9% |
| 69 | Woodridge | 95.10 | 33,941 | 37.5 | 27.0% | 29.3% |
| 70 | Des Plaines | 95.90 | 59,156 | 42.3 | 22.0% | 28.5% |
| 71 | Prospect Heights | 95.90 | 15,618 | 42.8 | 23.0% | 23.9% |
| 72 | Bolingbrook | 96.00 | 74,096 | 37.2 | 22.0% | 38.5% |
| 73 | Schiller Park | 96.10 | 11,393 | 39.7 | 17.0% | 30.4% |
| 74 | Centralia | 97.00 | 11,856 | 39.1 | 27.0% | 26.6% |
| 75 | River Forest | 97.20 | 11,992 | 40.0 | 28.0% | 33.4% |
| 76 | Danville | 97.30 | 28,595 | 39.8 | 22.0% | 25.9% |
| 77 | Chicago Heights | 97.60 | 26,736 | 35.2 | 18.0% | 37.4% |
| 78 | Hoffman Estates | 98.30 | 51,175 | 39.2 | 22.0% | 36.0% |
| 79 | Lincolnwood | 98.90 | 13,112 | 45.6 | 21.0% | 32.9% |
| 80 | Villa Park | 99.20 | 22,345 | 37.0 | 31.0% | 32.7% |
| 81 | Bradley | 99.40 | 15,325 | 34.7 | 32.0% | 28.2% |
| 82 | Joliet | 100.00 | 150,445 | 35.8 | 27.0% | 39.6% |
| 83 | Norridge | 100.00 | 15,439 | 46.0 | 16.0% | 27.9% |
| 84 | Lincoln | 100.80 | 13,281 | 39.2 | 32.0% | 25.6% |
| 85 | Galesburg | 101.00 | 29,481 | 40.8 | 25.0% | 21.9% |
| 86 | Markham | 101.00 | 11,355 | 34.2 | 16.0% | 36.5% |
| 87 | Skokie | 101.50 | 66,219 | 43.2 | 17.0% | 31.6% |
| 88 | Evergreen Park | 101.50 | 19,420 | 38.8 | 40.0% | 35.5% |
| 89 | O’Fallon | 102.00 | 32,262 | 37.8 | 22.0% | 36.0% |
| 90 | Gurnee | 102.10 | 30,510 | 40.1 | 23.0% | 29.5% |
| 91 | Woodstock | 103.10 | 26,147 | 39.7 | 23.0% | 29.4% |
| 92 | Vernon Hills | 103.70 | 26,876 | 41.8 | 18.0% | 33.4% |
| 93 | Westmont | 104.50 | 23,724 | 43.2 | 23.0% | 23.8% |
| 94 | Naperville | 105.00 | 150,692 | 40.4 | 23.0% | 38.0% |
| 95 | Loves Park | 105.50 | 23,502 | 37.2 | 26.0% | 25.3% |
| 96 | Oak Forest | 105.70 | 26,805 | 40.5 | 38.0% | 30.1% |
| 97 | Addison | 106.20 | 35,489 | 40.8 | 19.0% | 30.7% |
| 98 | Round Lake | 106.20 | 18,628 | 36.1 | 23.0% | 39.5% |
| 99 | Sterling | 106.30 | 14,717 | 42.6 | 32.0% | 27.4% |
| 100 | Bellwood | 106.70 | 18,256 | 38.7 | 21.0% | 36.0% |
Source: U.S. Census ACS 2020-2024. 221 cities with more than 10,000 residents.
Summary
Summary: The Best Cities For Singles In Illinois For 2026
If you’re looking for a breakdown of cities in Illinois ranked by criteria that most agree make a place a great spot for finding a single person (and potentially love), this is an accurate list.
The best cities for singles in Illinois are Champaign, Chicago, Forest Park, Chicago Ridge, Urbana, Blue Island, Glendale Heights, DeKalb, Cicero, and Justice.


