Minneapolisvs.Milwaukee Which City Is Right for You in 2026?
A head-to-head guide to cost of living, jobs, transportation, weather, crime, and quality of life — so you can decide where to live, work, or visit.
Updated 2026-05-26 · By HomeSnacks Editorial
Minneapolis vs. Milwaukee at a glance
Minneapolis, MN and Milwaukee, WI are frequently compared, and for good reason — they offer very different lifestyles at very different price points. Minneapolis is a city in Hennepin County, Minnesota, United States, and its county seat. With a population of 429,954 as of the 2020 census, it is the state's most populous city. Milwaukee is the most populous city in the U.S. state of Wisconsin. It is located on the western shore of Lake Michigan at the confluence of the Milwaukee, Menomonee, and Kinnickinnic Rivers.
On cost of living, Milwaukee is the cheaper city: its overall index sits at 95 versus 116 in Minneapolis (100 = national average). Median home values run $330,882 in Minneapolis and $220,136 in Milwaukee, with median rents at $1,371 and $1,059 respectively. That puts the home-value-to-income ratio at 4.1x in Minneapolis versus 4.1x in Milwaukee.
On crime, the picture shifts. Milwaukee reports 4,132 total crimes per 100,000 residents annually versus 6,384 in Minneapolis. Milwaukee is the more racially diverse of the two on a Herfindahl index basis — Minneapolis skews 59% White while Milwaukee skews 38% Black. On HomeSnacks' overall SnackAbility score, Minneapolis edges ahead at 7/10 versus 4/10 for Milwaukee.
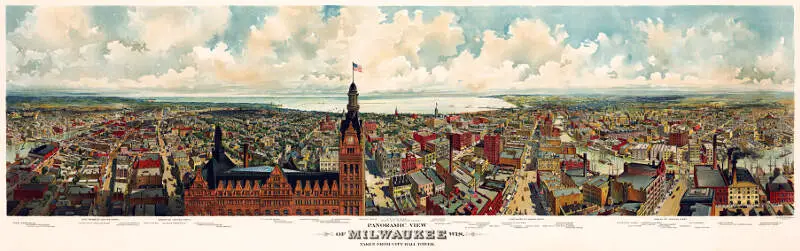
Minneapolis vs. Milwaukee in photos
A side-by-side look at each city.


Cost of living
Milwaukee is the cheaper city overall — 22% higher in Minneapolis than its rival. Index baseline: 100 = national average.
| Living expense | Minneapolis | Milwaukee | US average |
|---|---|---|---|
| Overall | 116 | 95 | 100 |
| Services | 103 | 101 | 100 |
| Groceries | 100 | 98 | 100 |
| Health | 142 | 77 | 100 |
| Housing | 103 | 102 | 100 |
| Transportation | 107 | 104 | 100 |
| Utilities | 105 | 103 | 100 |
Lower index = cheaper. 100 = U.S. national average. Bar inside each cell scales relative to the highest value in the table.
Sources: HomeSnacks Cost of Living indices, normalized so 100 = U.S. national average. Drill in: Minneapolis cost of living, Milwaukee cost of living, or the cheapest cities in America.
Housing breakdown
Home prices are higher in Minneapolis. Compare absolute price and price-to-income — a $500k home in a $100k-income city is very different from one in a $50k-income city.
| Metric | Minneapolis | Milwaukee | United States |
|---|---|---|---|
| Median Home Value | $330,882 | $220,136 | $332,700 |
| Median Rent | $1,371 | $1,059 | $1,413 |
| Median Income | $80,846 | $54,234 | $80,734 |
| Home Value To Income | 4.1x | 4.1x | 4.1x |
| Rent To Monthly Income | 0.2x | 0.23x | 0.21x |
Source: U.S. Census Bureau ACS 2020-2024. See also states with the highest rent in America.
Crime
Milwaukee is the safer city — total crime rate of 4,132 per 100k people vs 6,384 for Minneapolis. US average: 2,119.
| Crime (per 100k) | Minneapolis | Milwaukee | US average |
|---|---|---|---|
| Total crime | 6,384 | 4,132 | 2,119 |
| Murder | 17 | 24 | 5 |
| Robbery | 340 | 308 | 61 |
| Aggravated Assault | 688 | 1,031 | 256 |
| Violent Crime | 1,132 | 1,431 | 359 |
| Burglary | 606 | 388 | 229 |
| Larceny | 2,806 | 1,255 | 1,272 |
| Car Theft | 1,841 | 1,057 | 259 |
| Property Crime | 5,253 | 2,701 | 1,760 |
Lower = safer. Bar inside each cell scales relative to the highest crime rate in the table.
Source: FBI Uniform Crime Reporting (2024). All rates are per 100,000 people. City pages: Minneapolis crime, Milwaukee crime. See also: safest cities in America.
Diversity
Milwaukee is more racially diverse — lower HHI (closer to 0) means a more even mix across groups.
| Group | Minneapolis | Milwaukee | United States |
|---|---|---|---|
| White | 58.8% | 31.7% | 57.4% |
| African American | 18.5% | 37.9% | 11.9% |
| American Indian | 0.7% | 0.3% | 0.5% |
| Asian | 5.3% | 5.0% | 5.9% |
| Hawaiian | 0.0% | 0.0% | 0.2% |
| Other | 0.6% | 0.3% | 0.6% |
| Two Or More | 6.0% | 3.9% | 4.3% |
| Hispanic | 10.1% | 20.9% | 19.3% |
Source: U.S. Census ACS 2020-2024. Lower HHI = more even racial mix. See also: most diverse cities in America.
SnackAbility — overall quality of life
Minneapolis scores higher overall — 7/10 vs 4/10. SnackAbility is our 1–10 quality-of-life score; the median U.S. city scores a 7.
SnackAbility is a HomeSnacks proprietary 1–10 score blending jobs, housing, education, commute, amenities, affordability, crime, and diversity. Median U.S. city ≈ 7. Data: Census, BLS, FBI. See also: best places to live in America.
Getting around: Minneapolis vs. Milwaukee
How each city handles commuting, transit, walkability, and car culture — the day-to-day reality that shapes where you'd actually want to live.
Minneapolis has one of the most functional transit systems in the Midwest. Metro Transit runs two light-rail lines (the Blue Line to the airport and Mall of America, and the Green Line connecting downtown to St. Paul) plus an extensive bus network. The city also maintains hundreds of miles of protected bike lanes and a skyway system that lets you commute downtown without braving a January wind chill.
If you commute by car, the 35W and 394 corridors can back up badly during peak hours.
Milwaukee is more car-dependent. The Milwaukee County Transit System covers the city with buses, and The Hop streetcar loops through downtown and the Historic Third Ward, but it won't replace a car for most trips. If you're moving from a transit-friendly city, budget for parking and factor in I-94 congestion between Milwaukee and the suburbs.
Milwaukee's more compact footprint means shorter drive times for most errands than you'd face in a larger metro like Minneapolis.
Jobs and careers in Minneapolis vs. Milwaukee
The local job market, dominant industries, and which city to choose based on your career.
Minneapolis sits in the middle of one of the densest Fortune 500 concentrations in the country. Target, Best Buy, UnitedHealth Group, General Mills, 3M, and Ameriprise all headquarter or maintain major campuses in the metro, which creates a deep market for corporate, tech, finance, and healthcare roles. Median household income in Minneapolis runs $80,846, well above Milwaukee's $54,234.
The cost of living is higher too (a cost of living index of 116 versus Milwaukee's 95), so the salary premium doesn't all go in your pocket.
Milwaukee has a strong manufacturing and industrial base anchored by Harley-Davidson, Rockwell Automation, Johnson Controls, and Kohl's. The healthcare sector is growing, with Froedtert Health and Advocate Aurora both expanding. If you're in skilled trades, engineering, or supply-chain work, Milwaukee offers real opportunity at a noticeably lower cost of living.
The trade-off is a thinner market for tech and finance roles compared to what you'd find in the Twin Cities.
Weather and climate
What to expect day-to-day — sun, fog, heat, rain, and the seasonal extremes that shape the lifestyle.
Both cities will test your cold-weather tolerance, but Minneapolis wins the misery contest by a narrow margin. Winters routinely see sustained temperatures below zero, and the city averages around 54 inches of snow a year. Minneapolis has fully adapted: skyways, heated parking, and a culture that treats sub-zero bike commutes as a point of pride.
Summers are warm and genuinely pleasant, with long daylight hours and low humidity compared to cities farther east.
Milwaukee sits on the western shore of Lake Michigan, which moderates temperatures somewhat. Winters are cold but rarely as brutal as Minneapolis at its worst, and lake-effect snow can hit the southern lakefront hard in specific storm tracks. Summer in Milwaukee is lovely, with cool lake breezes keeping the lakefront comfortable even on hot days.
Spring and fall feel similar in both cities: short, unpredictable, and beautiful when they cooperate. Either way, invest in a quality winter coat before moving.
Culture, nightlife, and entertainment
Food, music, neighborhoods, and the city vibe that gives each place its personality.
Minneapolis punches well above its population for arts and culture. The Minneapolis Institute of Art and the Walker Art Center anchor a serious fine-arts scene, and First Avenue, the club made famous by Prince, remains one of the best mid-size music venues in the country.
Neighborhoods like the North Loop, Uptown, and Northeast Minneapolis have distinct personalities, with restaurant scenes ranging from Somali cuisine on Eat Street to James Beard-nominated tasting menus. Median rent of $1,371 means you can live in interesting neighborhoods without an impossible commute.
Milwaukee has a character all its own, shaped by German and Polish heritage, a serious craft beer culture that goes well beyond the Miller and Pabst legacies, and Summerfest (legitimately one of the world's largest music festivals, held each summer on the lakefront). The Historic Third Ward and Brady Street offer solid dining and nightlife, and the Milwaukee Art Museum's Calatrava-designed Quadracci Pavilion is worth visiting on its own.
With median rent around $1,059, your dollar stretches further here than in Minneapolis, which matters when you're picking a neighborhood to explore.
Outdoor activities and day trips
Parks, beaches, hikes, and the weekend escapes that define life outside the city limits.
Minneapolis is defined by its lakes. The Chain of Lakes, including Bde Maka Ska, Lake of the Isles, Lake Harriet, and Cedar Lake, sits right inside the city limits, ringed by paved trails that fill with runners, cyclists, and paddleboarders from May through October. The Grand Rounds scenic byway connects most of the park system, and the Mississippi River gorge offers wooded trails just minutes from downtown.
For longer day trips, the Boundary Waters Canoe Area Wilderness is a five-hour drive north and worth every mile.
Milwaukee's relationship with the outdoors centers on Lake Michigan. Bradford Beach and the lakefront trail are great urban amenities, and the Milwaukee River Greenway is expanding through several neighborhoods. Kettle Moraine State Forest, about 45 minutes west, offers hiking, mountain biking, and skiing without leaving the state.
Door County, a three-hour drive up the peninsula, is the classic Wisconsin escape for kayaking, cycling, and fall color. If waterfront access and weekend road-trip culture matter to you, Milwaukee's position on the lake is a real advantage.
Bottom line: which city is right for you?
Based on the head-to-head data above, here's the short version — pick the city that lines up with what you actually care about.
Choose Minneapolis if you prioritize…
- more affordable housing relative to Milwaukee.
- a higher overall SnackAbility quality-of-life score.
Choose Milwaukee if you prioritize…
- a lower cost of living (cheaper groceries, services, and day-to-day expenses).
- lower crime — a safer place to live, work, and raise a family.
- a more racially diverse community (lower HHI on Census data).
Methodology: winners are picked from public data — U.S. Census Bureau ACS (income, home value, rent, race/HHI), FBI Uniform Crime Reporting (crime rates per 100k), and HomeSnacks' proprietary SnackAbility quality-of-life score, which blends Bureau of Labor Statistics data with the above.
More about Minnesota & Wisconsin

Best Places To Live In Minnesota
Photo: Public domain
Cheapest Places To Live In Minnesota
Photo: Public domain
Most Dangerous Cities In Minnesota
Photo: Public domain
Best Places To Raise A Family In Minnesota
Photo: Public domain
Best Places To Retire In Minnesota
Photo: Public domain
Richest Cities In Minnesota
Photo: Public domain
Safest Places In Minnesota
Photo: Public domain
Worst Places To Live In Minnesota
Photo: Public domain