Raleighvs.Austin Which City Is Right for You in 2026?
A head-to-head guide to cost of living, jobs, transportation, weather, crime, and quality of life — so you can decide where to live, work, or visit.
Updated 2026-05-26 · By HomeSnacks Editorial
Raleigh vs. Austin at a glance
Raleigh, NC and Austin, TX are frequently compared, and for good reason — they offer very different lifestyles at very different price points. Raleigh is the capital city of the U.S. state of North Carolina. Austin is the capital city of the U.S. state of Texas. With a population of 961,855 at the 2020 census, it is the 12th-most populous city in the U.S., fifth-most populous city in Texas, and second-most populous U.S.
On cost of living, Raleigh is the cheaper city: its overall index sits at 116 versus 124 in Austin (100 = national average). Median home values run $433,996 in Raleigh and $508,530 in Austin, with median rents at $1,572 and $1,729 respectively. That puts the home-value-to-income ratio at 5.1x in Raleigh versus 5.4x in Austin.
Public safety is another point of divergence. Raleigh reports 3,308 total crimes per 100,000 residents annually versus 3,709 in Austin. Austin is the more racially diverse of the two on a Herfindahl index basis — Raleigh skews 51% White while Austin skews 47% White. On HomeSnacks' overall SnackAbility score, Raleigh edges ahead at 8/10 versus 7/10 for Austin.
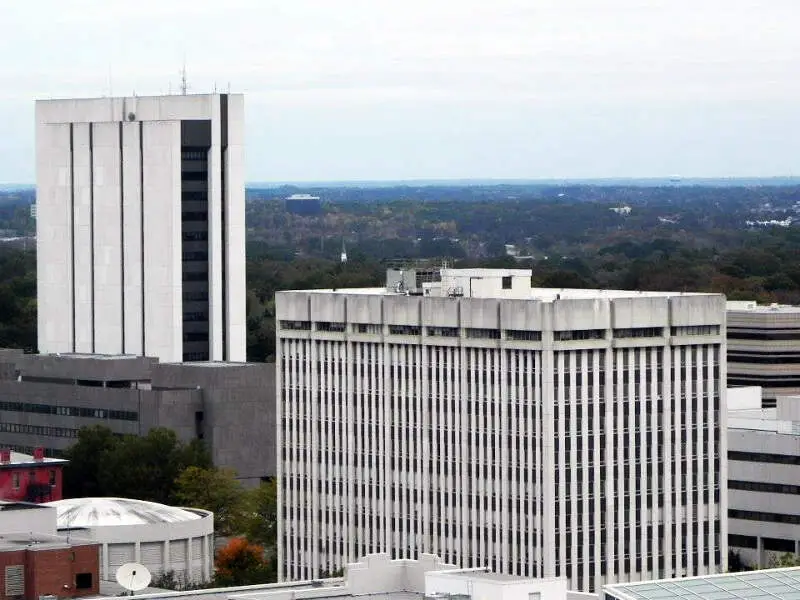
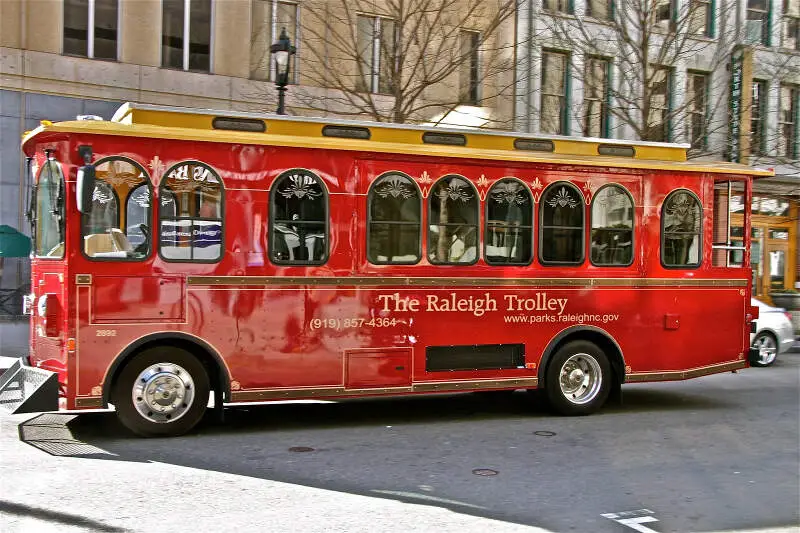
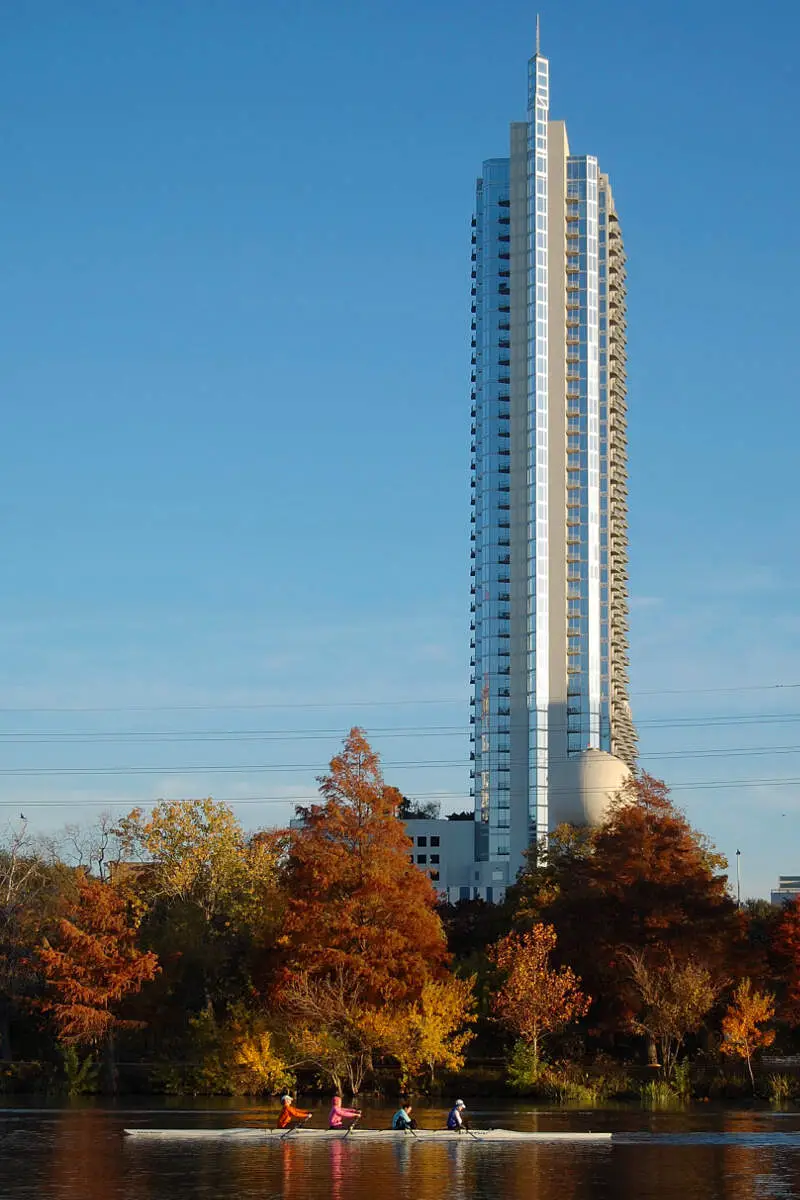
Raleigh vs. Austin in photos
A side-by-side look at each city.


Cost of living
Raleigh is the cheaper city overall — 6% higher in Austin than its rival. Index baseline: 100 = national average.
| Living expense | Raleigh | Austin | US average |
|---|---|---|---|
| Overall | 116 | 124 | 100 |
| Services | 101 | 99 | 100 |
| Groceries | 101 | 101 | 100 |
| Health | 144 | 185 | 100 |
| Housing | 106 | 98 | 100 |
| Transportation | 100 | 109 | 100 |
| Utilities | 106 | 104 | 100 |
Lower index = cheaper. 100 = U.S. national average. Bar inside each cell scales relative to the highest value in the table.
Sources: HomeSnacks Cost of Living indices, normalized so 100 = U.S. national average. Drill in: Raleigh cost of living, Austin cost of living, or the cheapest cities in America.
Housing breakdown
Home prices are higher in Austin. Compare absolute price and price-to-income — a $500k home in a $100k-income city is very different from one in a $50k-income city.
| Metric | Raleigh | Austin | United States |
|---|---|---|---|
| Median Home Value | $433,996 | $508,530 | $332,700 |
| Median Rent | $1,572 | $1,729 | $1,413 |
| Median Income | $85,395 | $93,658 | $80,734 |
| Home Value To Income | 5.1x | 5.4x | 4.1x |
| Rent To Monthly Income | 0.22x | 0.22x | 0.21x |
Source: U.S. Census Bureau ACS 2020-2024. See also states with the highest rent in America.
Crime
Raleigh is the safer city — total crime rate of 3,308 per 100k people vs 3,709 for Austin. US average: 2,119.
| Crime (per 100k) | Raleigh | Austin | US average |
|---|---|---|---|
| Total crime | 3,308 | 3,709 | 2,119 |
| Murder | 5 | 7 | 5 |
| Robbery | 87 | 85 | 61 |
| Aggravated Assault | 361 | 307 | 256 |
| Violent Crime | 489 | 467 | 359 |
| Burglary | 279 | 445 | 229 |
| Larceny | 2,059 | 2,198 | 1,272 |
| Car Theft | 481 | 599 | 259 |
| Property Crime | 2,819 | 3,242 | 1,760 |
Lower = safer. Bar inside each cell scales relative to the highest crime rate in the table.
Source: FBI Uniform Crime Reporting (2024). All rates are per 100,000 people. City pages: Raleigh crime, Austin crime. See also: safest cities in America.
Diversity
Austin is more racially diverse — lower HHI (closer to 0) means a more even mix across groups.
| Group | Raleigh | Austin | United States |
|---|---|---|---|
| White | 51.1% | 47.0% | 57.4% |
| African American | 26.0% | 7.3% | 11.9% |
| American Indian | 0.2% | 0.1% | 0.5% |
| Asian | 5.2% | 9.0% | 5.9% |
| Hawaiian | 0.0% | 0.0% | 0.2% |
| Other | 0.5% | 0.5% | 0.6% |
| Two Or More | 4.4% | 4.3% | 4.3% |
| Hispanic | 12.6% | 31.9% | 19.3% |
Source: U.S. Census ACS 2020-2024. Lower HHI = more even racial mix. See also: most diverse cities in America.
SnackAbility — overall quality of life
Raleigh scores higher overall — 8/10 vs 7/10. SnackAbility is our 1–10 quality-of-life score; the median U.S. city scores a 7.
SnackAbility is a HomeSnacks proprietary 1–10 score blending jobs, housing, education, commute, amenities, affordability, crime, and diversity. Median U.S. city ≈ 7. Data: Census, BLS, FBI. See also: best places to live in America.
Getting around: Raleigh vs. Austin
How each city handles commuting, transit, walkability, and car culture — the day-to-day reality that shapes where you'd actually want to live.
Getting around Raleigh without a car is a real challenge. GoRaleigh runs the city's bus network, and a commuter rail line to nearby suburbs is in the works, but most residents drive. The I-440 beltline and I-40 carry most of the traffic; congestion is worsening as the population grows, though Raleigh's compact footprint keeps typical commutes manageable.
Austin's I-35 is one of the most congested urban corridors in the country, and remote work didn't fix it. Capital Metro's MetroRail Red Line and the MetroRapid bus rapid transit routes give you options, but the system is built around a sprawling city designed for cars. If you're relocating for a job in the Domain or the tech campuses north of downtown, budget extra time either way.
Austin's scale at nearly a million people means traffic is a daily negotiation that Raleigh simply hasn't reached yet.
Jobs and careers in Raleigh vs. Austin
The local job market, dominant industries, and which city to choose based on your career.
Raleigh anchors the Research Triangle alongside Durham and Chapel Hill, so the job market skews heavily toward tech, life sciences, and government. Research Triangle Park, one of the largest research parks in the world, hosts Cisco, IBM, and SAS Institute, while Red Hat has its global headquarters downtown. State government and hospital systems like UNC Health and WakeMed add stability that pure tech hubs sometimes lack; median household income sits around $85,395, solid for a city with a cost of living index of 116.
Austin has become "Silicon Hills" in earnest: Tesla's headquarters, Apple's $1 billion campus, Oracle's relocated HQ, Google, Samsung, and a dense startup ecosystem all compete for talent. That demand pushes median household income to about $93,658, though Austin's higher cost of living index of 124 eats into that advantage. If you're in software, hardware, or fintech, Austin's volume of open roles and venture capital is hard to beat.
Raleigh counters with slightly lower living costs and a less overheated hiring environment, a real draw if you'd rather not compete in a market where every senior engineer has three offers.
Weather and climate
What to expect day-to-day — sun, fog, heat, rain, and the seasonal extremes that shape the lifestyle.
Raleigh sits in a humid subtropical zone with four distinct seasons; spring and fall are the pleasant stretches. Summers are hot and muggy, with July highs regularly around 90°F, but winters are mild, with temperatures rarely dropping below the 20s and snowfall that's usually brief and light. Ice storms are the bigger winter hazard; the region doesn't invest heavily in de-icing equipment, so roads shut down fast.
Austin runs hotter and drier. Triple-digit days stack up from June through September, and the relentless heat is not something you simply acclimate to. Winters are short and typically mild, though a sudden Arctic blast can arrive without warning; as Texas residents learned in February 2021, the infrastructure may not be ready for it.
Austin gets less humidity than Raleigh on average, which some people find more tolerable, but the summer intensity is in a different category. If heat is a dealbreaker, Raleigh's climate is the easier one to live with year-round.
Culture, nightlife, and entertainment
Food, music, neighborhoods, and the city vibe that gives each place its personality.
Raleigh's cultural identity has sharpened over the past decade. The Glenwood South corridor and the Warehouse District pack in independent restaurants, craft cocktail bars, and live music venues, while the North Carolina Museum of Natural Sciences and the NC Museum of Art give the city genuine cultural weight. The food scene leans on Southern cooking elevated by James Beard-recognized chefs, and the Triangle's university population keeps things artistically eclectic.
Austin's title as live music capital of the world still holds: the Sixth Street entertainment district, Rainey Street's bungalow bars, and South Congress Avenue give you music options on any given night. The festival calendar (SXSW, Austin City Limits Music Festival, and dozens of smaller events) draws global attention. Rapid growth has priced out many of the quirky independent businesses that defined Austin's character, and "Keep Austin Weird" prompts more ironic laughs than it used to.
Raleigh's scene is smaller but arguably more intact; Austin's is bigger, louder, and globally recognized.
Outdoor activities and day trips
Parks, beaches, hikes, and the weekend escapes that define life outside the city limits.
Raleigh's outdoor access is strong for a mid-sized Southern city. William B. Umstead State Park sits on the city's western edge, over 5,000 acres of trails and creeks you can reach from most of Raleigh in 20 minutes. Falls Lake and Jordan Lake offer kayaking, fishing, and beach swimming without leaving the metro.
The bigger draw is proximity: the Blue Ridge Parkway and Appalachian Trail are a three-hour drive west, and the Outer Banks beaches sit roughly two and a half hours east, two genuinely different landscapes for weekend trips.
Austin's outdoor life revolves around the Colorado River and the Texas Hill Country. Barton Springs Pool, a spring-fed swimming hole inside Zilker Park, is a city institution for surviving summer heat, and the Barton Creek Greenbelt offers surprisingly rugged hiking and climbing minutes from downtown. Paddle out on Lady Bird Lake on a weekday morning and you'll understand why people stay.
Enchanted Rock State Natural Area and Pedernales Falls State Park make for rewarding day trips. Both cities offer strong outdoor access; Raleigh gives you more landscape variety, while Austin's green spaces feel like a lifeline given how extreme the summers get.
Bottom line: which city is right for you?
Based on the head-to-head data above, here's the short version — pick the city that lines up with what you actually care about.
Choose Raleigh if you prioritize…
- a lower cost of living (cheaper groceries, services, and day-to-day expenses).
- lower crime — a safer place to live, work, and raise a family.
- a higher overall SnackAbility quality-of-life score.
Choose Austin if you prioritize…
- more affordable housing relative to Raleigh.
- a more racially diverse community (lower HHI on Census data).
Methodology: winners are picked from public data — U.S. Census Bureau ACS (income, home value, rent, race/HHI), FBI Uniform Crime Reporting (crime rates per 100k), and HomeSnacks' proprietary SnackAbility quality-of-life score, which blends Bureau of Labor Statistics data with the above.
More about North Carolina & Texas

Best Places To Live In North Carolina
Photo: Public domain
Cheapest Places To Live In North Carolina
Photo: Public domain
Most Dangerous Cities In North Carolina
Photo: Public domain
Best Places To Raise A Family In North Carolina
Photo: Public domain
Best Places To Retire In North Carolina
Photo: Public domain
Richest Cities In North Carolina
Photo: Public domain
Safest Cities in North Carolina
Photo: Public domain
Worst Places To Live In North Carolina
Photo: Public domain