San Franciscovs.New York Which City Is Right for You in 2026?
A head-to-head guide to cost of living, jobs, transportation, weather, crime, and quality of life — so you can decide where to live, work, or visit.
Updated 2026-05-26 · By HomeSnacks Editorial
San Francisco vs. New York at a glance
Choosing between San Francisco, CA and New York, NY comes down to which trade-offs matter most to you. Below we break down cost of living, jobs, housing, crime, diversity, weather, transportation, and culture using public data from the U.S. Census Bureau, the FBI, and HomeSnacks' proprietary SnackAbility quality-of-life score.
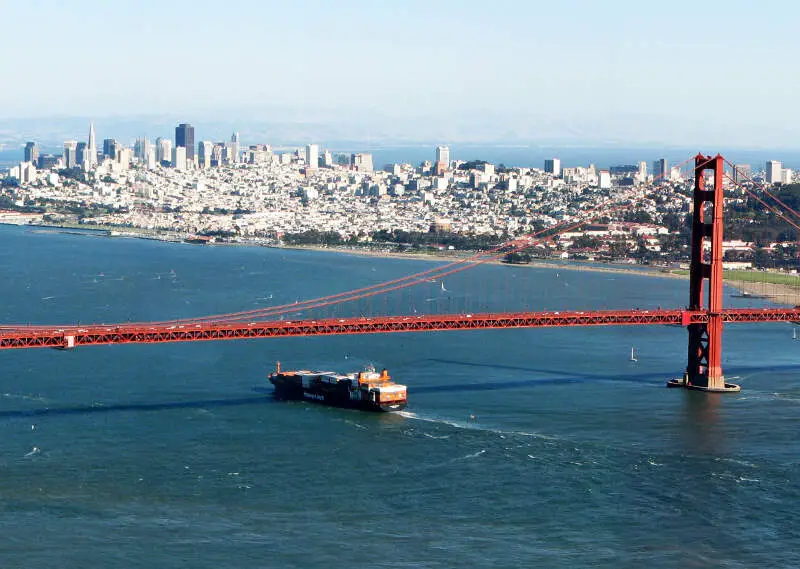
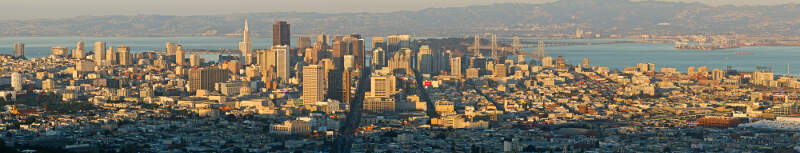
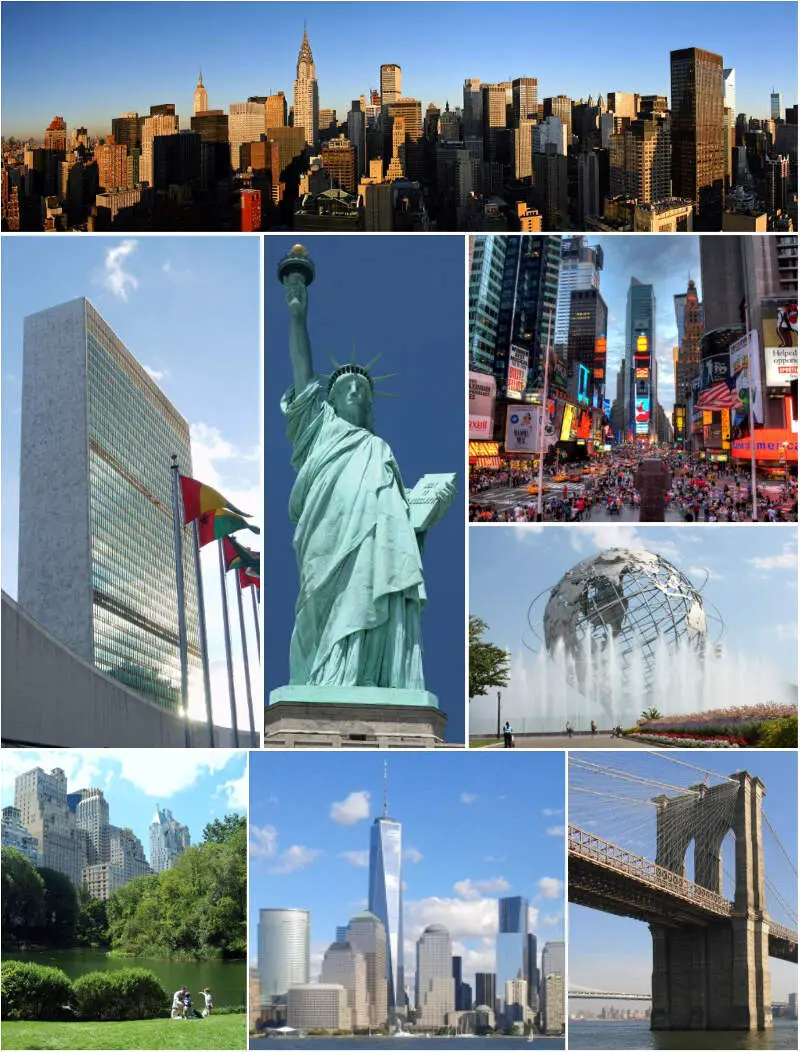
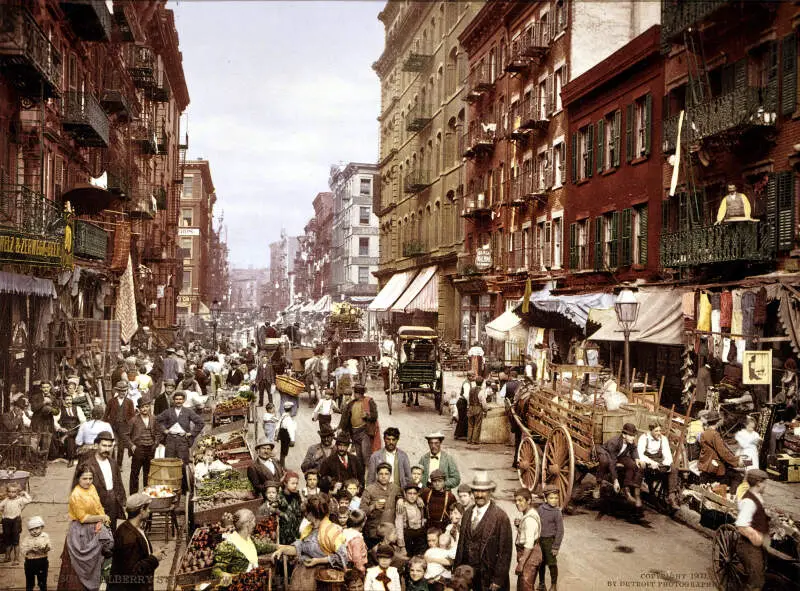
San Francisco vs. New York in photos
A side-by-side look at each city.


Cost of living
New York is the cheaper city overall — 37% higher in San Francisco than its rival. Index baseline: 100 = national average.
| Living expense | San Francisco | New York | US average |
|---|---|---|---|
| Overall | 247 | 180 | 100 |
| Services | 122 | 119 | 100 |
| Groceries | 125 | 124 | 100 |
| Health | 518 | 298 | 100 |
| Housing | 132 | 134 | 100 |
| Transportation | 128 | 119 | 100 |
| Utilities | 139 | 134 | 100 |
Lower index = cheaper. 100 = U.S. national average. Bar inside each cell scales relative to the highest value in the table.
Sources: HomeSnacks Cost of Living indices, normalized so 100 = U.S. national average. Drill in: San Francisco cost of living, New York cost of living, or the cheapest cities in America.
Housing breakdown
Home prices are higher in New York. Compare absolute price and price-to-income — a $500k home in a $100k-income city is very different from one in a $50k-income city.
| Metric | San Francisco | New York | United States |
|---|---|---|---|
| Median Home Value | $1,356,661 | $812,861 | $332,700 |
| Median Rent | $2,476 | $1,821 | $1,413 |
| Median Income | $140,970 | $80,483 | $80,734 |
| Home Value To Income | 9.6x | 10.1x | 4.1x |
| Rent To Monthly Income | 0.21x | 0.27x | 0.21x |
Source: U.S. Census Bureau ACS 2020-2024. See also states with the highest rent in America.
Crime
New York is the safer city — total crime rate of 3,039 per 100k people vs 4,526 for San Francisco. US average: 2,119.
| Crime (per 100k) | San Francisco | New York | US average |
|---|---|---|---|
| Total crime | 4,526 | 3,039 | 2,119 |
| Murder | 4 | 4 | 5 |
| Robbery | 267 | 187 | 61 |
| Aggravated Assault | 290 | 456 | 256 |
| Violent Crime | 596 | 671 | 359 |
| Burglary | 637 | 155 | 229 |
| Larceny | 2,619 | 2,015 | 1,272 |
| Car Theft | 673 | 199 | 259 |
| Property Crime | 3,929 | 2,368 | 1,760 |
Lower = safer. Bar inside each cell scales relative to the highest crime rate in the table.
Source: FBI Uniform Crime Reporting (2024). All rates are per 100,000 people. City pages: San Francisco crime, New York crime. See also: safest cities in America.
Diversity
New York is more racially diverse — lower HHI (closer to 0) means a more even mix across groups.
| Group | San Francisco | New York | United States |
|---|---|---|---|
| White | 36.8% | 31.0% | 57.4% |
| African American | 4.7% | 20.4% | 11.9% |
| American Indian | 0.2% | 0.2% | 0.5% |
| Asian | 34.9% | 14.6% | 5.9% |
| Hawaiian | 0.3% | 0.0% | 0.2% |
| Other | 0.8% | 1.4% | 0.6% |
| Two Or More | 6.1% | 3.9% | 4.3% |
| Hispanic | 16.2% | 28.5% | 19.3% |
Source: U.S. Census ACS 2020-2024. Lower HHI = more even racial mix. See also: most diverse cities in America.
SnackAbility — overall quality of life
San Francisco scores higher overall — 8.5/10 vs 8/10. SnackAbility is our 1–10 quality-of-life score; the median U.S. city scores a 7.
SnackAbility is a HomeSnacks proprietary 1–10 score blending jobs, housing, education, commute, amenities, affordability, crime, and diversity. Median U.S. city ≈ 7. Data: Census, BLS, FBI. See also: best places to live in America.
Getting around: San Francisco vs. New York
How each city handles commuting, transit, walkability, and car culture — the day-to-day reality that shapes where you'd actually want to live.
Getting around San Francisco without a car is entirely doable — Muni buses and light rail cover most neighborhoods, and BART links the city to Oakland, Berkeley, and the broader Bay Area. Driving in SF is its own sport, though: steep hills, aggressive street cleaning, and scarce parking make car ownership feel more like a liability than a convenience. The median commute depends largely on whether you can score a BART seat or a company shuttle to Silicon Valley.
New York is the stronger transit city by almost any measure. The MTA subway runs 24 hours across five boroughs, with the PATH train, Metro-North, and LIRR extending into New Jersey and the suburbs. Most New Yorkers go car-free for life, and if you're commuting by foot, subway, or bike, the city's density works in your favor in a way SF can't fully match.
Jobs and careers in San Francisco vs. New York
The local job market, dominant industries, and which city to choose based on your career.
San Francisco sits at the center of the global tech economy. Major employers like Salesforce, Twitter/X, and Wells Fargo are headquartered here, and Apple, Google, and Meta are a short BART or Caltrain ride down the Peninsula. Median household income hits $140,970, nearly double New York's $80,483, though the cost of living index of 247 versus New York's 180 takes a real bite out of that gap.
New York's job market is broader. Finance anchors it, with JPMorgan, Goldman Sachs, and Citi all headquartered here, but media, fashion, healthcare, and a growing tech sector mean you're not industry-locked. If you're not in tech, New York likely offers more pathways, though salaries rarely climb as high and the $1,821 median rent still puts real pressure on take-home pay.
Weather and climate
What to expect day-to-day — sun, fog, heat, rain, and the seasonal extremes that shape the lifestyle.
San Francisco's weather is mild and misty year-round. Summers stay cool — July averages around 65°F — because Karl the Fog rolls in from the Pacific most afternoons, especially in the Sunset and Richmond districts. Rain falls mostly between November and March; snow almost never happens.
New York gives you all four seasons at full volume: summers push into the 90s with real heat index discomfort, winters bring nor'easters and enough snow to snarl the city a few times a year, and fall and spring are genuinely beautiful. Central Park in October is hard to beat. If you want variety and distinct seasons, New York delivers; if you want stable, mild weather year-round, San Francisco wins.
Culture, nightlife, and entertainment
Food, music, neighborhoods, and the city vibe that gives each place its personality.
San Francisco punches above its weight culturally for a city of 830,000. The Mission District's murals and taquerias, the Castro's LGBTQ+ legacy, North Beach's Beat Generation roots, and SoMa's club scene each give neighborhoods a distinct identity. SFMOMA, the de Young, Davies Symphony Hall, and the War Memorial Opera House anchor the arts scene, and while the tech industry has closed some longtime dive bars and music venues, the Tenderloin and the Haight still hold their character.
New York is in a different category. Broadway makes it the performing arts capital of the country, and the Metropolitan Museum, MoMA, the Whitney, and the Guggenheim give it a density of major institutions unmatched in North America. Neighborhoods from Greenwich Village to Bed-Stuy to Flushing each carry their own culture, food scene, and nightlife — whatever you're into, New York almost certainly has it running somewhere tonight.
Outdoor activities and day trips
Parks, beaches, hikes, and the weekend escapes that define life outside the city limits.
San Francisco's greatest outdoor asset is its immediate surroundings. Golden Gate Park has 1,000 acres of trails, meadows, and the Japanese Tea Garden right inside city limits, and you're in the Marin Headlands within 20 minutes of crossing the bridge — Mount Tamalpais, Muir Woods, and Point Reyes National Seashore are all realistic day trips. Ocean Beach runs the Pacific shoreline, the Bay draws kayakers, sailors, and cold-water swimmers, and mild weather makes all of it year-round.
Central Park is New York's backyard: 843 acres of paths, ball fields, and reservoirs that see heavy daily use. Prospect Park in Brooklyn and Riverside Park are solid alternatives when you want a change of scene. The bigger day trips take real effort — the Catskills, Hudson Valley, and Adirondacks are 2–3 hours out, the Jersey Shore is closer but inconsistent — and SF has a clear geographic advantage: wilderness starts where the city ends.
Bottom line: which city is right for you?
Based on the head-to-head data above, here's the short version — pick the city that lines up with what you actually care about.
Choose San Francisco if you prioritize…
- a higher overall SnackAbility quality-of-life score.
Choose New York if you prioritize…
- a lower cost of living (cheaper groceries, services, and day-to-day expenses).
- lower crime — a safer place to live, work, and raise a family.
- more affordable housing relative to San Francisco.
- a more racially diverse community (lower HHI on Census data).
Methodology: winners are picked from public data — U.S. Census Bureau ACS (income, home value, rent, race/HHI), FBI Uniform Crime Reporting (crime rates per 100k), and HomeSnacks' proprietary SnackAbility quality-of-life score, which blends Bureau of Labor Statistics data with the above.
More about California & New York

Best Places To Live In California
Photo: Public domain
Cheapest Places To Live In California
Photo: Public domain
Most Dangerous Cities In California
Photo: Public domain
Best Places To Raise A Family In California
Photo: Public domain
Best Places To Retire In California
Photo: Public domain
Richest Cities In California
Photo: Public domain
Safest Places In California
Photo: Public domain
Worst Places To Live In California
Photo: Public domain