Seattlevs.Portland Which City Is Right for You in 2026?
A head-to-head guide to cost of living, jobs, transportation, weather, crime, and quality of life — so you can decide where to live, work, or visit.
Updated 2026-05-26 · By HomeSnacks Editorial
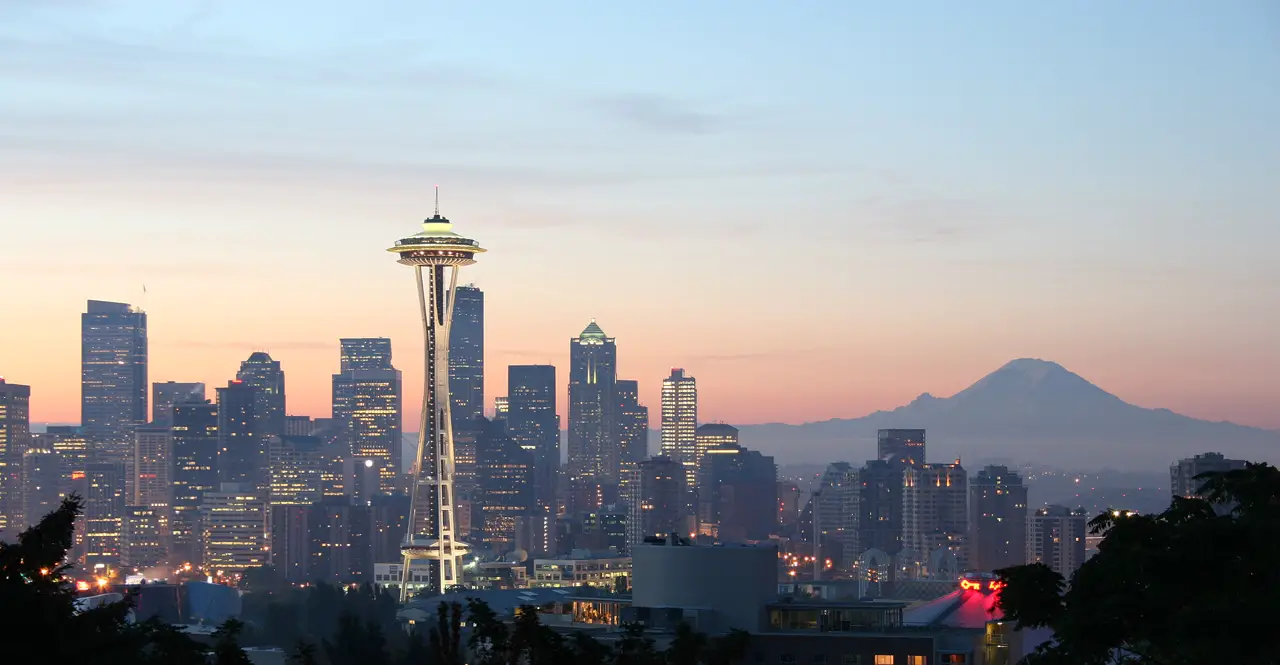
Seattle
Seattle vs. Portland at a glance
Choosing between Seattle, WA and Portland, OR comes down to which trade-offs you're willing to make. Seattle is the most populous city in the U.S. state of Washington and the Pacific Northwest region of North America. Portland is the most populous city in the U.S. state of Oregon.
On cost of living, Portland is the cheaper city: its overall index sits at 139 versus 181 in Seattle (100 = national average). Median home values run $868,680 in Seattle and $534,638 in Portland, with median rents at $2,030 and $1,655 respectively. That puts the home-value-to-income ratio at 7.0x in Seattle versus 5.9x in Portland.
Public safety is another point of divergence. Seattle reports 5,783 total crimes per 100,000 residents annually versus 6,246 in Portland. Seattle is the more racially diverse of the two on a Herfindahl index basis — Seattle skews 59% White while Portland skews 66% White. On HomeSnacks' overall SnackAbility score, Seattle edges ahead at 8.5/10 versus 8/10 for Portland.
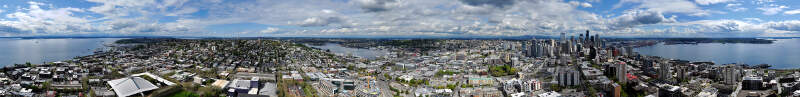
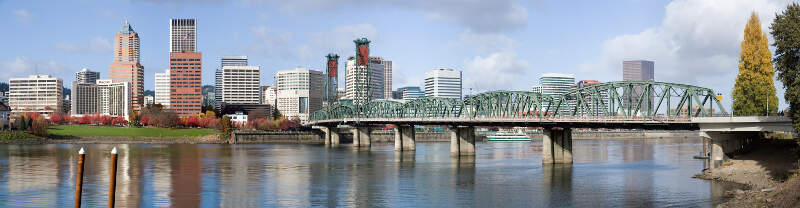
Seattle vs. Portland in photos
A side-by-side look at each city.


Cost of living
Portland is the cheaper city overall — 30% higher in Seattle than its rival. Index baseline: 100 = national average.
| Living expense | Seattle | Portland | US average |
|---|---|---|---|
| Overall | 181 | 139 | 100 |
| Services | 107 | 105 | 100 |
| Groceries | 111 | 108 | 100 |
| Health | 326 | 210 | 100 |
| Housing | 125 | 111 | 100 |
| Transportation | 112 | 112 | 100 |
| Utilities | 123 | 112 | 100 |
Lower index = cheaper. 100 = U.S. national average. Bar inside each cell scales relative to the highest value in the table.
Sources: HomeSnacks Cost of Living indices, normalized so 100 = U.S. national average. Drill in: Seattle cost of living, Portland cost of living, or the cheapest cities in America.
Housing breakdown
Home prices are higher in Seattle. Compare absolute price and price-to-income — a $500k home in a $100k-income city is very different from one in a $50k-income city.
| Metric | Seattle | Portland | United States |
|---|---|---|---|
| Median Home Value | $868,680 | $534,638 | $332,700 |
| Median Rent | $2,030 | $1,655 | $1,413 |
| Median Income | $123,860 | $90,919 | $80,734 |
| Home Value To Income | 7.0x | 5.9x | 4.1x |
| Rent To Monthly Income | 0.2x | 0.22x | 0.21x |
Source: U.S. Census Bureau ACS 2020-2024. See also states with the highest rent in America.
Crime
Seattle is the safer city — total crime rate of 5,783 per 100k people vs 6,246 for Portland. US average: 2,119.
| Crime (per 100k) | Seattle | Portland | US average |
|---|---|---|---|
| Total crime | 5,783 | 6,246 | 2,119 |
| Murder | 7 | 11 | 5 |
| Robbery | 221 | 177 | 61 |
| Aggravated Assault | 501 | 481 | 256 |
| Violent Crime | 775 | 720 | 359 |
| Burglary | 1,152 | 727 | 229 |
| Larceny | 2,882 | 3,921 | 1,272 |
| Car Theft | 974 | 878 | 259 |
| Property Crime | 5,008 | 5,526 | 1,760 |
Lower = safer. Bar inside each cell scales relative to the highest crime rate in the table.
Source: FBI Uniform Crime Reporting (2024). All rates are per 100,000 people. City pages: Seattle crime, Portland crime. See also: safest cities in America.
Diversity
Seattle is more racially diverse — lower HHI (closer to 0) means a more even mix across groups.
| Group | Seattle | Portland | United States |
|---|---|---|---|
| White | 58.8% | 65.8% | 57.4% |
| African American | 6.4% | 5.5% | 11.9% |
| American Indian | 0.3% | 0.4% | 0.5% |
| Asian | 17.5% | 8.0% | 5.9% |
| Hawaiian | 0.2% | 0.6% | 0.2% |
| Other | 0.6% | 0.6% | 0.6% |
| Two Or More | 7.7% | 7.2% | 4.3% |
| Hispanic | 8.5% | 12.0% | 19.3% |
Source: U.S. Census ACS 2020-2024. Lower HHI = more even racial mix. See also: most diverse cities in America.
SnackAbility — overall quality of life
Seattle scores higher overall — 8.5/10 vs 8/10. SnackAbility is our 1–10 quality-of-life score; the median U.S. city scores a 7.
SnackAbility is a HomeSnacks proprietary 1–10 score blending jobs, housing, education, commute, amenities, affordability, crime, and diversity. Median U.S. city ≈ 7. Data: Census, BLS, FBI. See also: best places to live in America.
Getting around: Seattle vs. Portland
How each city handles commuting, transit, walkability, and car culture — the day-to-day reality that shapes where you'd actually want to live.
Seattle and Portland both lean heavily on public transit, but Seattle's network is more expansive. King County Metro buses blanket the city, and Link Light Rail now connects Sea-Tac Airport through downtown and north to Lynnwood, useful if you live along that spine. If you commute by car, expect congestion on I-5 and SR-99, especially through the Battery Street Tunnel area.
Seattle is also a serious cycling city, with protected lanes on 2nd and Broadway, though the hills make a strong case for an e-bike.
Portland's TriMet MAX light rail is compact but well-loved: the Red, Blue, and Green lines cover the airport, Beaverton, and Gresham without much fuss. The city is famously flat, which makes Portland one of the most genuinely bikeable cities in the country; the Springwater Corridor and Eastside Esplanade are commuter routes people actually use. Neither city is cheap to park in downtown, so if you're car-dependent, factor that friction into daily life in both places.
Jobs and careers in Seattle vs. Portland
The local job market, dominant industries, and which city to choose based on your career.
Seattle's economy punches well above its size. Amazon's campus anchors South Lake Union, Microsoft's main footprint sits just across the lake in Redmond, and Boeing's commercial division still employs thousands in the region. That concentration of tech and aerospace drives a median household income of $123,860, nearly $33,000 more than Portland's $90,919.
Seattle's cost of living index sits at 181 versus Portland's 139, so the higher paycheck doesn't stretch as far as it looks on paper.
Portland's job market is more diversified at the mid-market level. Nike's world headquarters in Beaverton and Adidas North America in the Pearl District give the city a real foothold in the global sportswear industry. Intel's largest campus is in nearby Hillsboro, and a growing cluster of semiconductor and clean-tech firms has emerged along the Highway 26 corridor.
If you're in healthcare, OHSU on Marquam Hill is a major regional employer. For remote workers, Portland's lower median rent of $1,655 versus Seattle's $2,030 makes the housing math considerably friendlier.
Weather and climate
What to expect day-to-day — sun, fog, heat, rain, and the seasonal extremes that shape the lifestyle.
Both cities are famously gray, but the specifics matter. Seattle averages around 38 inches of rain annually (less than Miami or New York), but spreads that moisture over a relentless 150-plus drizzly days a year. Summers are genuinely spectacular: July and August routinely deliver low humidity and temperatures in the mid-70s, which is why locals treat any sunshine like a regional holiday.
Snowfall in the city proper is rare, though the Cascades an hour east get heavy snowpack.
Portland runs a few degrees warmer in both summer and winter, which sounds nice until you consider that it hits heat more aggressively: the 2021 heat dome pushed Portland past 116°F, a record that reframed conversations about summer cooling. Winters are wetter and slightly milder than Seattle's, and the Willamette Valley fog can be thick from November through February. If warmth is your priority, Portland edges Seattle on average.
If you want to avoid extreme heat events, Seattle's marine influence keeps things more temperate overall.
Culture, nightlife, and entertainment
Food, music, neighborhoods, and the city vibe that gives each place its personality.
Seattle's cultural footprint is outsized for its population. Pike Place Market is the obvious anchor, but the neighborhoods carry their own distinct energy: Capitol Hill for nightlife and queer culture, Ballard for its Scandinavian-heritage bars and weekend farmers market, Pioneer Square for galleries and live music. The city has a serious live music history (grunge, obviously, but also jazz and hip-hop), and venues like Neumos and The Showbox remain genuine institutions.
With a median household income of $123,860, the dining scene has moved aggressively upscale, though pockets of affordable international food survive in the International District.
Portland's culture trades a bit of polish for personality. The Pearl District converted its industrial bones into galleries, brewpubs, and Powell's Books, still one of the best independent bookstores in the country and worth an afternoon on its own. The Alberta Arts District and Mississippi Avenue corridors have a scrappier, more DIY energy.
Portland's craft brewery density is arguably the highest in the nation, and the food cart pod system means you can eat exceptionally well for under $15. The city's nightlife is less sprawling than Seattle's but more neighborhood-rooted, a better fit if you prefer a local bar to a ticketed venue.
Outdoor activities and day trips
Parks, beaches, hikes, and the weekend escapes that define life outside the city limits.
Seattle's outdoor access is defined by water as much as mountains. You can kayak on Lake Union, catch a ferry to Bainbridge Island on a whim, or be skinning up at Stevens Pass within two hours. Discovery Park on the Magnolia Bluff offers 534 acres of trails and saltwater views without leaving city limits.
Mount Rainier National Park is a 90-minute drive for serious alpine hiking and climbing, and the Olympic Peninsula (old-growth rainforest, sea stacks, hot springs) is a ferry ride and short drive away.
Portland's outdoors pitch centers on the Columbia River Gorge, which begins essentially at the eastern city limit. The Multnomah Falls corridor, Dog Mountain, and the Historic Columbia River Highway make for easy weekend hiking without overnight logistics. Mount Hood is about 90 minutes away for skiing at Timberline, which operates the longest ski season in North America.
Forest Park, a 5,100-acre urban forest woven into the West Hills, gives trail runners and hikers a real wilderness feel ten minutes from downtown. If mountain biking is your thing, Sandy Ridge and Post Canyon near Hood River are world-class and under two hours from Portland.
Bottom line: which city is right for you?
Based on the head-to-head data above, here's the short version — pick the city that lines up with what you actually care about.
Choose Seattle if you prioritize…
- lower crime — a safer place to live, work, and raise a family.
- more affordable housing relative to Portland.
- a more racially diverse community (lower HHI on Census data).
- a higher overall SnackAbility quality-of-life score.
Choose Portland if you prioritize…
- a lower cost of living (cheaper groceries, services, and day-to-day expenses).
Methodology: winners are picked from public data — U.S. Census Bureau ACS (income, home value, rent, race/HHI), FBI Uniform Crime Reporting (crime rates per 100k), and HomeSnacks' proprietary SnackAbility quality-of-life score, which blends Bureau of Labor Statistics data with the above.
More about Washington & Oregon

Best Places To Live In Washington
Photo: Public domain
Cheapest Places To Live In Washington
Photo: Public domain
Most Dangerous Cities In Washington
Photo: Public domain
Best Places To Raise A Family In Washington
Photo: Public domain
Best Places To Retire In Washington
Photo: Public domain
Richest Cities In Washington
Photo: Public domain
Safest Places In Washington
Photo: Public domain
Worst Places To Live In Washington
Photo: Public domain