Cahokia, IL
Demographics And Statistics
Living In Cahokia, Illinois Summary
Life in Cahokia research summary. HomeSnacks has been researching the quality of life in Cahokia over the past eight years using Census data, FBI crime data, cost of living data, and other primary sources. Based on the most recently available data, we found the following about life in Cahokia:
The population in Cahokia is 12,440.
The median home value in Cahokia is $40,900.
The median income in Cahokia is $30,556.
The cost of living in Cahokia is 81 which is 0.8x lower than the national average.
The median rent in Cahokia is $975.
The unemployment rate in Cahokia is 12.0%.
The poverty rate in Cahokia is 35.4%.
Cahokia SnackAbility
Overall SnackAbility
Cahokia, IL Crime Report
Crime in Cahokia summary. We use data from the FBI to determine the crime rates in Cahokia. Key points include:
There were 334 total crimes in Cahokia in the last reporting year.
The overall crime rate per 100,000 people in Cahokia is 2,431.2 / 100k people.
The violent crime rate per 100,000 people in Cahokia is 684.2 / 100k people.
The property crime rate per 100,000 people in Cahokia is 1,747.0 / 100k people.
Overall, crime in Cahokia is 4.60% above the national average.
Total Crimes
Above National Average
Crime In Cahokia Comparison Table
| Statistic | Count Raw |
Cahokia / 100k People |
Illinois / 100k People |
National / 100k People |
|---|---|---|---|---|
| Total Crimes Per 100K | 334 | 2,431.2 | 1,985.3 | 2,324.2 |
| Violent Crime | 94 | 684.2 | 425.9 | 369.8 |
| Murder | 4 | 29.1 | 9.1 | 6.3 |
| Robbery | 16 | 116.5 | 97.4 | 66.1 |
| Aggravated Assault | 68 | 495.0 | 278.9 | 268.2 |
| Property Crime | 240 | 1,747.0 | 1,559.4 | 1,954.4 |
| Burglary | 140 | 1,019.1 | 246.4 | 269.8 |
| Larceny | 0 | 0.0 | 1,143.5 | 1,401.9 |
| Car Theft | 95 | 691.5 | 169.5 | 282.7 |
Cahokia, IL Cost Of Living
Cost of living in Cahokia summary. We use data on the cost of living to determine how expensive it is to live in Cahokia. Real estate prices drive most of the variance in cost of living around Illinois. Key points include:
The cost of living in Cahokia is 81 with 100 being average.
The cost of living in Cahokia is 0.8x lower than the national average.
The median home value in Cahokia is $40,900.
The median income in Cahokia is $30,556.
Cahokia's Overall Cost Of Living
Lower Than The National Average
Cost Of Living In Cahokia Comparison Table
| Living Expense | Cahokia | Illinois | National Average | |
|---|---|---|---|---|
| Overall | 81 | 92 | 100 | |
| Services | 93 | 95 | 100 | |
| Groceries | 104 | 98 | 100 | |
| Health | 87 | 96 | 100 | |
| Housing | 46 | 81 | 100 | |
| Transportation | 88 | 105 | 100 | |
| Utilities | 97 | 90 | 100 | |
Cahokia, IL Photos

1 Reviews & Comments About Cahokia
/5

Ashton Way -
I live in Cahokia which is pretty much East St. Louis. As far as I been here I have not seen tide locked up, a subway behind glass, or a testing truck. HOWEVER, this man is not off with the violent crimes. Just down the road from my house yesterday, there was a triple shooting, one dead at the scene, all of them were teenagers. So... Yeah you decide if Cahokia/East St Louis is the worst shithole or not.
Rankings for Cahokia in Illinois


Locations Around Cahokia
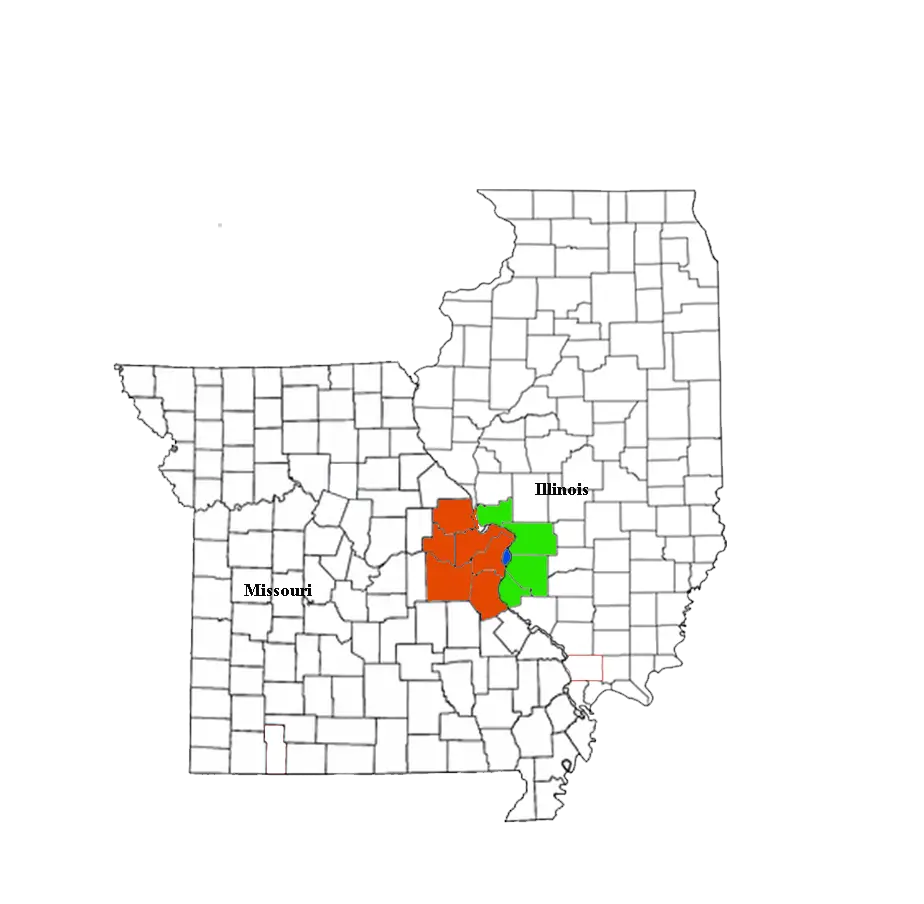
Map Of Cahokia, IL
Best Places Around Cahokia
O'Fallon, IL
Population 31,963
Waterloo, IL
Population 10,906
Maryville, IL
Population 8,115
Troy, IL
Population 10,858
Shiloh, IL
Population 13,638
Swansea, IL
Population 15,037
Columbia, IL
Population 11,090
Edwardsville, IL
Population 25,236
Glen Carbon, IL
Population 13,532
Fairview Heights, IL
Population 16,601
Cahokia Demographics And Statistics
Population over time in Cahokia
The current population in Cahokia is 12,440. The population has decreased -19.3% from 2010.
| Year | Population | % Change |
|---|---|---|
| 2021 | 12,440 | -12.8% |
| 2020 | 14,271 | -1.0% |
| 2019 | 14,408 | -1.1% |
| 2018 | 14,574 | -1.1% |
| 2017 | 14,740 | -1.1% |
| 2016 | 14,905 | -1.0% |
| 2015 | 15,055 | -0.8% |
| 2014 | 15,169 | -1.1% |
| 2013 | 15,332 | -0.5% |
| 2012 | 15,406 | - |
Race / Ethnicity in Cahokia
Cahokia is:
30.5% White with 3,791 White residents.
63.2% African American with 7,864 African American residents.
0.3% American Indian with 42 American Indian residents.
1.3% Asian with 156 Asian residents.
0.0% Hawaiian with 0 Hawaiian residents.
0.0% Other with 0 Other residents.
3.7% Two Or More with 464 Two Or More residents.
1.0% Hispanic with 123 Hispanic residents.
| Race | Cahokia | IL | USA |
|---|---|---|---|
| White | 30.5% | 60.2% | 59.4% |
| African American | 63.2% | 13.8% | 12.2% |
| American Indian | 0.3% | 0.1% | 0.6% |
| Asian | 1.3% | 5.6% | 5.6% |
| Hawaiian | 0.0% | 0.0% | 0.2% |
| Other | 0.0% | 0.3% | 0.4% |
| Two Or More | 3.7% | 2.4% | 3.2% |
| Hispanic | 1.0% | 17.5% | 18.4% |
Gender in Cahokia
Cahokia is 53.8% female with 6,693 female residents.
Cahokia is 46.2% male with 5,747 male residents.
| Gender | Cahokia | IL | USA |
|---|---|---|---|
| Female | 53.8% | 50.6% | 50.5% |
| Male | 46.2% | 49.4% | 49.5% |
Highest level of educational attainment in Cahokia for adults over 25
3.0% of adults in Cahokia completed < 9th grade.
13.0% of adults in Cahokia completed 9-12th grade.
38.0% of adults in Cahokia completed high school / ged.
26.0% of adults in Cahokia completed some college.
10.0% of adults in Cahokia completed associate's degree.
7.0% of adults in Cahokia completed bachelor's degree.
2.0% of adults in Cahokia completed master's degree.
0.0% of adults in Cahokia completed professional degree.
1.0% of adults in Cahokia completed doctorate degree.
| Education | Cahokia | IL | USA |
|---|---|---|---|
| < 9th Grade | 3.0% | 6.0% | 5.0% |
| 9-12th Grade | 13.0% | 6.0% | 6.0% |
| High School / GED | 38.0% | 25.0% | 26.0% |
| Some College | 26.0% | 20.0% | 20.0% |
| Associate's Degree | 10.0% | 8.0% | 9.0% |
| Bachelor's Degree | 7.0% | 22.0% | 21.0% |
| Master's Degree | 2.0% | 10.0% | 9.0% |
| Professional Degree | 0.0% | 2.0% | 2.0% |
| Doctorate Degree | 1.0% | 1.0% | 2.0% |
Household Income For Cahokia, Illinois
10.5% of households in Cahokia earn Less than $10,000.
9.1% of households in Cahokia earn $10,000 to $14,999.
18.5% of households in Cahokia earn $15,000 to $24,999.
15.5% of households in Cahokia earn $25,000 to $34,999.
16.0% of households in Cahokia earn $35,000 to $49,999.
10.9% of households in Cahokia earn $50,000 to $74,999.
9.1% of households in Cahokia earn $75,000 to $99,999.
5.4% of households in Cahokia earn $100,000 to $149,999.
2.7% of households in Cahokia earn $150,000 to $199,999.
2.3% of households in Cahokia earn $200,000 or more.
| Income | Cahokia | IL | USA |
|---|---|---|---|
| Less than $10,000 | 10.5% | 5.9% | 5.5% |
| $10,000 to $14,999 | 9.1% | 3.5% | 3.9% |
| $15,000 to $24,999 | 18.5% | 7.4% | 7.8% |
| $25,000 to $34,999 | 15.5% | 7.7% | 8.2% |
| $35,000 to $49,999 | 16.0% | 10.7% | 11.4% |
| $50,000 to $74,999 | 10.9% | 16.3% | 16.8% |
| $75,000 to $99,999 | 9.1% | 12.9% | 12.8% |
| $100,000 to $149,999 | 5.4% | 17.1% | 16.3% |
| $150,000 to $199,999 | 2.7% | 8.5% | 7.8% |
| $200,000 or more | 2.3% | 10.1% | 9.5% |


