Most African American cities in New Jersey research summary. We used Saturday Night Science to analyze New Jersey’s most recent Census data to determine the cities with the largest Black population, based on the percentage of Black residents.
The city with the largest African American population in New Jersey is East Orange (78.0% Black); the least is Little Silver (0.0%). Statewide, New Jersey is 12.2% Black — the 16th blackest state in the country.
Roughly 42 million people identifying as Black or African American live in the United States, about 12% of the total population. In New Jersey, the Black population is 1,136,658, at 12.2% of the state total.
We broke down the most recent Census data to determine the cities in New Jersey with the largest African American population in 2026.

#1 most African American in New Jersey
Data | Crime | Cost of living | Movers
#2 most African American in New Jersey
Data | Crime | Cost of living | Movers
#3 most African American in New Jersey
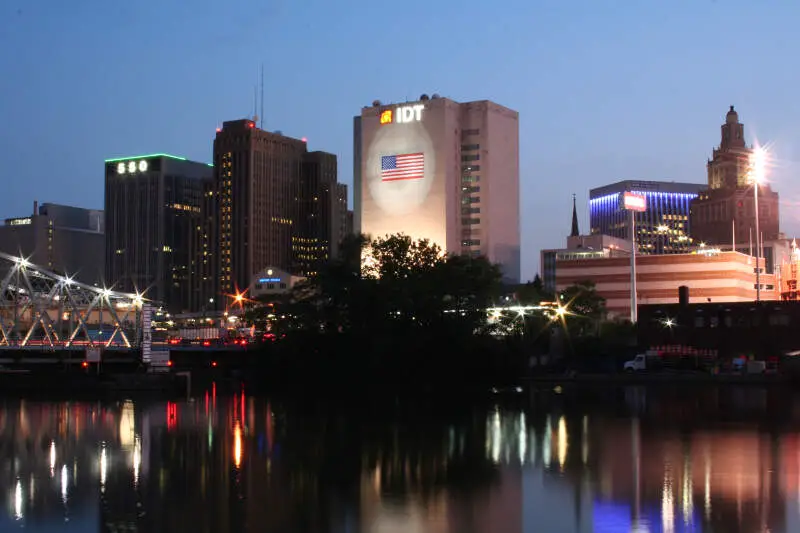
Newark is the most populous city in the U.S. state of New Jersey and the seat of Essex County. As one of the nation’s major air, shipping, and rail hubs, the city had a population of 277,140 in 2010, making it the nation’s 67th-most populous municipality, after being ranked 63rd in the nation in 2000. For 2015, the Census Bureau’s Population Estimates Program calculated a population of 281,944, an increase of 1.7% from the 2010 enumeration, ranking the city the 70th largest in the nation. Newark is the second largest city in the New York metropolitan area, located approximately 8 miles west of lower Manhattan.
Data | Crime | Cost of living | Movers | Compare
#4 most African American in New Jersey
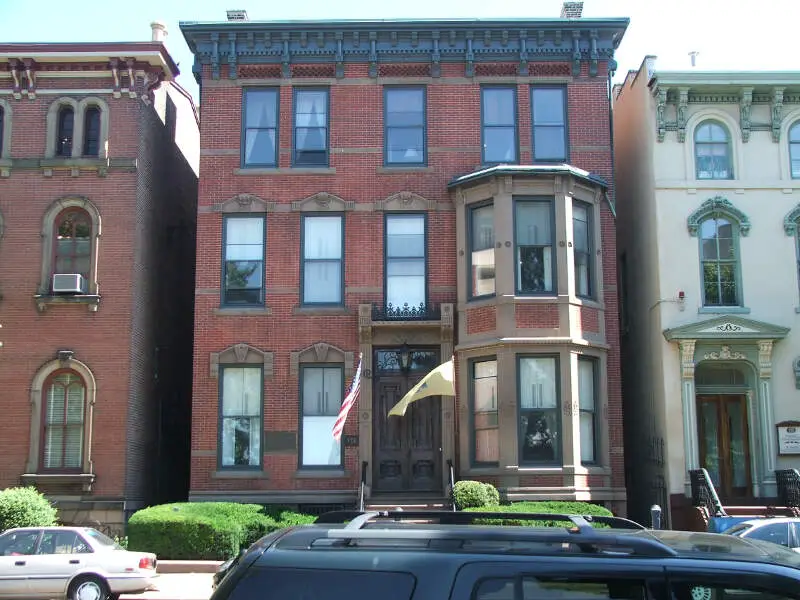
Trenton is the capital city of the U.S. state of New Jersey and the county seat of Mercer County. It was briefly the capital of the United States. The city’s metropolitan area is grouped with the New York metropolitan area by the United States Census Bureau, but directly borders the Philadelphia metropolitan area and is part of the Federal Communications Commission’s Philadelphia Designated Market Area. As of the 2010 United States Census, Trenton had a population of 84,913, making it the state’s 10th-largest municipality. The Census Bureau estimated that the city’s population was 84,034 in 2014.
Data | Crime | Cost of living | Movers
#5 most African American in New Jersey
Data | Crime | Cost of living | Movers
#6 most African American in New Jersey
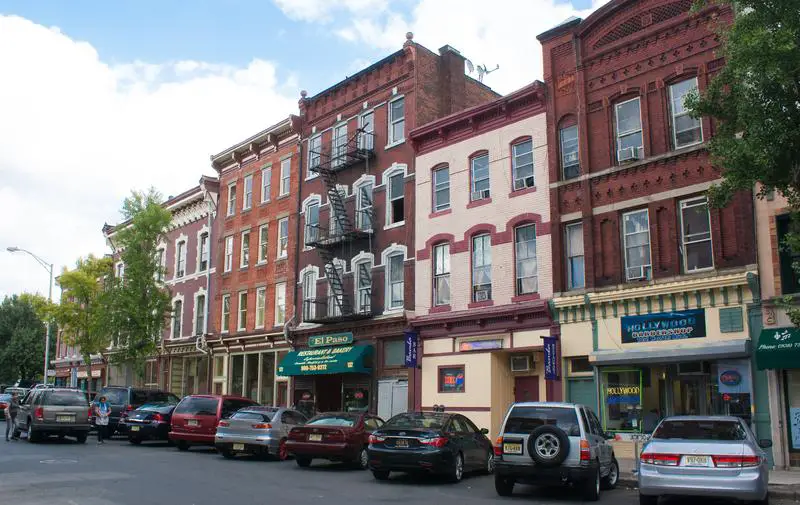
Camden is a city in Camden County, New Jersey. Camden is located directly across the Delaware River from Philadelphia, Pennsylvania. At the 2010 United States Census, the city had a population of 77,344. Camden is the 12th most populous municipality in New Jersey. The city was incorporated on February 13, 1828. Camden has been the county seat of Camden County since the county was formed on March 13, 1844. The city derives its name from Charles Pratt, 1st Earl Camden. Camden is made up of over twenty different neighborhoods.
Data | Crime | Cost of living | Movers
#7 most African American in New Jersey
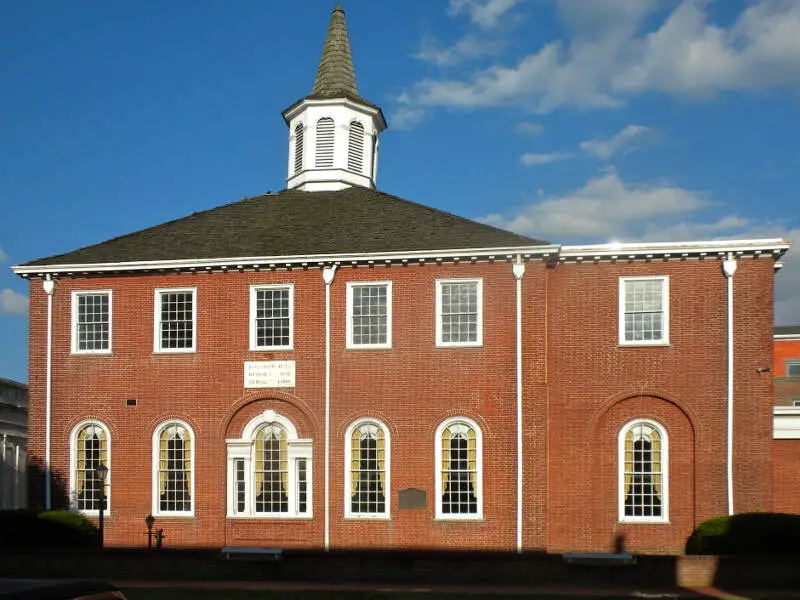
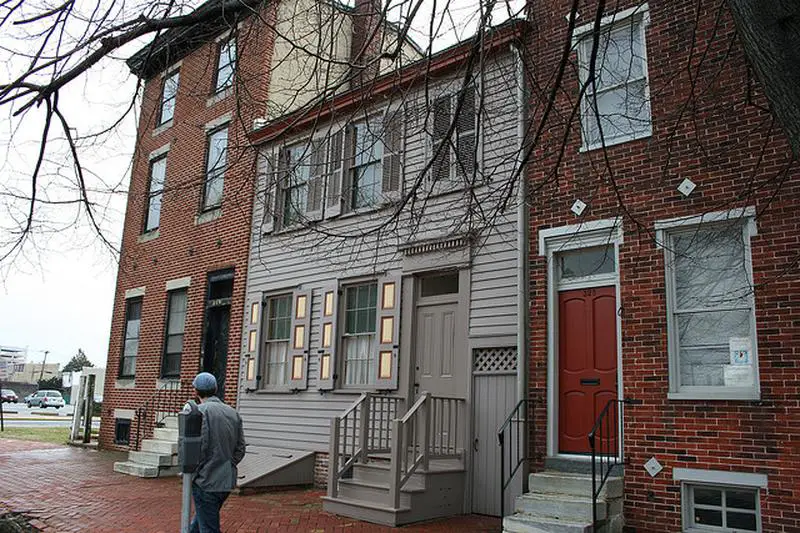
Burlington is a city in Burlington County, New Jersey, United States and a suburb of Philadelphia. As of the 2010 United States Census, the city’s population was 9,920, reflecting an increase of 184 from the 9,736 counted in the 2000 Census, which had in turn declined by 99 from the 9,835 counted in the 1990 Census.
Data | Crime | Cost of living | Movers
#8 most African American in New Jersey
Lindenwold is a borough in Camden County, New Jersey, United States. As of the 2010 United States Census, the borough’s population was 17,613, reflecting an increase of 199 from the 17,414 counted in the 2000 Census, which had in turn declined by 1,320 from the 18,734 counted in the 1990 Census.
Data | Crime | Cost of living | Movers
#9 most African American in New Jersey
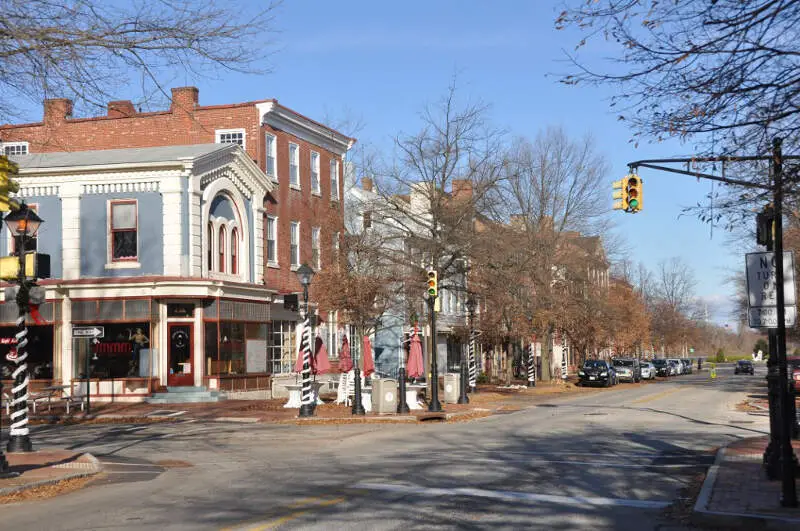
Plainfield is a city in Union County, New Jersey, United States, known by its nickname as “The Queen City”. As of the 2010 United States Census, the city’s population increased to 49,808, its highest ever recorded population in any decennial census, with the population having increased by 1,979 from the 47,829 counted in the 2000 Census, which had in turn increased by 1,262 from the 46,567 counted in the 1990 Census.
Data | Crime | Cost of living | Movers
#10 most African American in New Jersey
Data | Crime | Cost of living | Movers
The receipts
Compare the top ten
Pick a metric. The bars rescale. The red line is New Jersey’s statewide median.
On the map
Where New Jersey’s Black communities live
Saturday Night Science
Methodology: How We Determined The Cities In New Jersey With The Largest Black Population For 2026
We still believe in the accuracy of data — especially from the Census. So that’s where we went to get the race breakdown across New Jersey.
That leads us to the Census’s most recently available data, the 2020-2024 American Community Survey data from the US Census.
Specifically, we looked at table B03002: Hispanic OR LATINO ORIGIN BY RACE. Here are the category names as defined by the Census:
- Hispanic or Latino
- White alone*
- Black or African American alone*
- American Indian and Alaska Native alone*
- Asian alone*
- Native Hawaiian and Other Pacific Islander alone*
- Some other race alone*
- Two or more races*
Our particular column of interest was the number of people who identified as Black or African American.
We limited our analysis to non-CDPs with a population greater than 5,000 people in New Jersey. That left us with 188 cities.
We then calculated the percentage of residents that are Black or African American. The percentages ranked from 78.0% to 0.0%.
Finally, we ranked each city based on the percentage of the Black population, with a higher score being more Black than a lower score. East Orange took the distinction of being the most Black, while Little Silver was the least African American city.
We updated this article for 2026. This is our eleventh time ranking the cities in New Jersey with the largest African American population.
The full plate
African American Population By City In New Jersey
Click any column to sort. Search by city name.
| Rank | City | Population | African American Population | % African American |
|---|---|---|---|---|
| 1 | East Orange | 70,090 | 54,644 | 78.0% |
| 2 | Salem | 5,322 | 3,041 | 57.1% |
| 3 | Newark | 310,178 | 138,868 | 44.8% |
| 4 | Trenton | 90,338 | 36,163 | 40.0% |
| 5 | Roselle | 22,646 | 8,999 | 39.7% |
| 6 | Camden | 71,496 | 27,387 | 38.3% |
| 7 | Burlington | 9,993 | 3,666 | 36.7% |
| 8 | Lindenwold | 21,719 | 7,195 | 33.1% |
| 9 | Plainfield | 55,236 | 17,962 | 32.5% |
| 10 | Somerdale | 5,581 | 1,783 | 31.9% |
| 11 | Paulsboro | 6,248 | 1,996 | 31.9% |
| 12 | Rahway | 30,109 | 9,277 | 30.8% |
| 13 | Pleasantville | 20,712 | 6,294 | 30.4% |
| 14 | Asbury Park | 15,295 | 4,540 | 29.7% |
| 15 | Atlantic City | 38,632 | 11,341 | 29.4% |
| 16 | Linden | 44,192 | 11,947 | 27.0% |
| 17 | Pine Hill | 10,802 | 2,793 | 25.9% |
| 18 | Bridgeton | 27,001 | 6,774 | 25.1% |
| 19 | Clayton | 8,921 | 1,989 | 22.3% |
| 20 | North Plainfield | 22,809 | 5,050 | 22.1% |
| 21 | Paterson | 158,735 | 35,041 | 22.1% |
| 22 | Woodbury | 10,042 | 2,126 | 21.2% |
| 23 | Englewood | 29,638 | 5,800 | 19.6% |
| 24 | Jersey City | 294,078 | 56,559 | 19.2% |
| 25 | Carteret | 25,496 | 4,753 | 18.6% |
| 26 | Hackensack | 46,057 | 8,328 | 18.1% |
| 27 | Haledon | 8,980 | 1,599 | 17.8% |
| 28 | Millville | 27,511 | 4,785 | 17.4% |
| 29 | Berlin | 7,539 | 1,190 | 15.8% |
| 30 | Glassboro | 23,717 | 3,691 | 15.6% |
| 31 | Phillipsburg | 15,299 | 2,229 | 14.6% |
| 32 | Elizabeth | 137,302 | 20,002 | 14.6% |
| 33 | South River | 16,124 | 2,171 | 13.5% |
| 34 | Bayonne | 71,553 | 8,589 | 12.0% |
| 35 | Matawan | 9,710 | 1,133 | 11.7% |
| 36 | New Brunswick | 56,345 | 6,558 | 11.6% |
| 37 | Prospect Park | 6,319 | 729 | 11.5% |
| 38 | Sayreville | 45,838 | 5,280 | 11.5% |
| 39 | Palmyra | 7,485 | 862 | 11.5% |
| 40 | Somerville | 13,410 | 1,517 | 11.3% |
| 41 | Vineland | 61,006 | 6,623 | 10.9% |
| 42 | Wildwood | 5,130 | 549 | 10.7% |
| 43 | Long Branch | 32,530 | 3,476 | 10.7% |
| 44 | Eato | 13,575 | 1,432 | 10.5% |
| 45 | Elmwood Park | 21,412 | 2,217 | 10.4% |
| 46 | Absecon | 9,170 | 948 | 10.3% |
| 47 | Clementon | 5,410 | 553 | 10.2% |
| 48 | Somers Point | 10,515 | 1,049 | 10.0% |
| 49 | South Plainfield | 24,473 | 2,375 | 9.7% |
| 50 | Keansburg | 9,719 | 937 | 9.6% |
| 51 | Roselle Park | 14,093 | 1,352 | 9.6% |
| 52 | Florham Park | 13,564 | 1,282 | 9.5% |
| 53 | Gloucester City | 11,509 | 1,085 | 9.4% |
| 54 | Newton | 8,369 | 775 | 9.3% |
| 55 | Bogota | 9,360 | 861 | 9.2% |
| 56 | Ridgefield Park | 13,235 | 1,172 | 8.9% |
| 57 | Collingswood | 14,205 | 1,194 | 8.4% |
| 58 | Stratford | 7,018 | 522 | 7.4% |
| 59 | Runnemede | 8,355 | 619 | 7.4% |
| 60 | Morristown | 20,453 | 1,513 | 7.4% |
| 61 | Lodi | 26,082 | 1,917 | 7.3% |
| 62 | Hight | 5,920 | 422 | 7.1% |
| 63 | Bound Brook | 12,219 | 867 | 7.1% |
| 64 | South Amboy | 9,989 | 706 | 7.1% |
| 65 | Bergenfield | 28,450 | 1,970 | 6.9% |
| 66 | Passaic | 70,002 | 4,789 | 6.8% |
| 67 | Wood-Ridge | 10,218 | 693 | 6.8% |
| 68 | Bellmawr | 11,737 | 784 | 6.7% |
| 69 | Union Beach | 5,707 | 349 | 6.1% |
| 70 | Perth Amboy | 55,855 | 3,367 | 6.0% |
| 71 | Summit | 22,705 | 1,342 | 5.9% |
| 72 | Freehold | 12,507 | 715 | 5.7% |
| 73 | East Rutherford | 10,313 | 574 | 5.6% |
| 74 | Secaucus | 21,778 | 1,165 | 5.3% |
| 75 | Garfield | 32,783 | 1,753 | 5.3% |
| 76 | Franklin Lakes | 11,084 | 586 | 5.3% |
| 77 | Totowa | 10,959 | 576 | 5.3% |
| 78 | Middlesex | 14,645 | 765 | 5.2% |
| 79 | West Long Branch | 8,586 | 448 | 5.2% |
| 80 | Ventnor City | 9,265 | 483 | 5.2% |
| 81 | Montvale | 8,901 | 464 | 5.2% |
| 82 | Kenilworth | 8,401 | 434 | 5.2% |
| 83 | Washington | 7,334 | 367 | 5.0% |
| 84 | New Milford | 16,995 | 849 | 5.0% |
| 85 | Dunellen | 7,911 | 391 | 4.9% |
| 86 | Red Bank | 12,862 | 629 | 4.9% |
| 87 | Tinton Falls | 19,361 | 919 | 4.7% |
| 88 | Metuchen | 15,144 | 715 | 4.7% |
| 89 | Kearny | 40,614 | 1,905 | 4.7% |
| 90 | Boonton | 8,854 | 415 | 4.7% |
| 91 | Caldwell | 9,003 | 421 | 4.7% |
| 92 | River Edge | 12,091 | 564 | 4.7% |
| 93 | Maywood | 10,093 | 461 | 4.6% |
| 94 | Guttenberg | 11,754 | 505 | 4.3% |
| 95 | Keyport | 7,171 | 304 | 4.2% |
| 96 | Wanaque | 11,206 | 463 | 4.1% |
| 97 | Hackett | 10,140 | 415 | 4.1% |
| 98 | Paramus | 26,568 | 1,079 | 4.1% |
| 99 | North Arlington | 16,461 | 658 | 4.0% |
| 100 | Raritan | 8,368 | 331 | 4.0% |
Source: U.S. Census ACS 2020-2024. 188 cities with more than 5,000 residents.
Summary
Summary: Black Populations Across New Jersey
If you’re looking for a breakdown of African American populations across New Jersey according to the most recent data, this is an accurate list.
The blackest cities in New Jersey are East Orange, Salem, Newark, Trenton, Roselle, Camden, Burlington, Lindenwold, Plainfield, and Somerdale. Not sold on New Jersey? Take the two-minute Find Your Place quiz and see which state actually fits you.


