Most Asian cities in Minnesota research summary. We analyzed Minnesota’s most recent Census data to determine the most Asian cities in Minnesota based on the percentage of Asian residents.
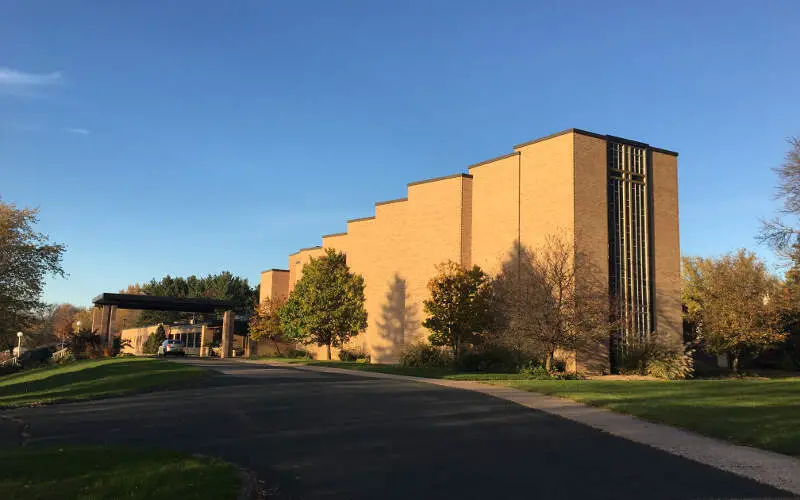
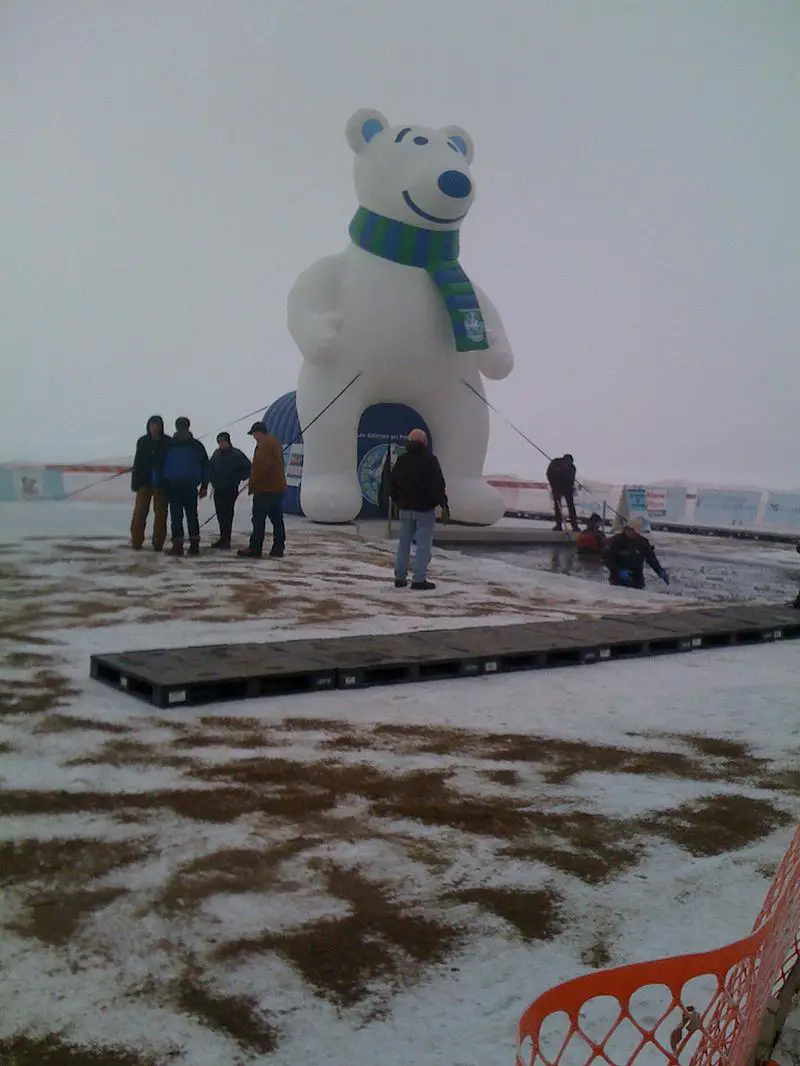
21.8% Asian · #1 most Asian in Minnesota
North Saint Paul is a city in Ramsey County, Minnesota, located east-northeast of the city of Saint Paul. The population was 11,460 at the 2010 census.
Data | Crime | Cost of living | Movers
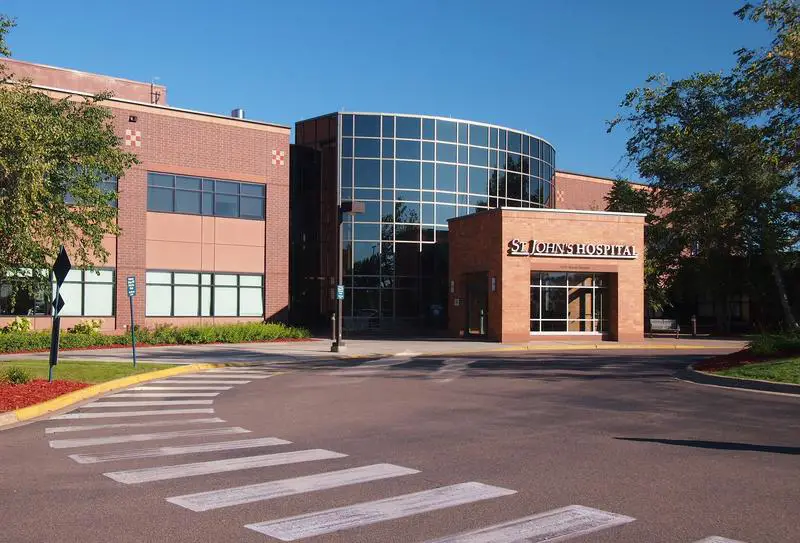
21.8% Asian · #2 most Asian in Minnesota
Data | Crime | Cost of living | Movers
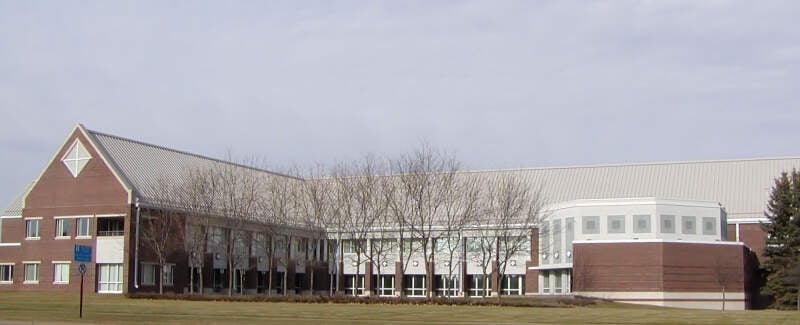
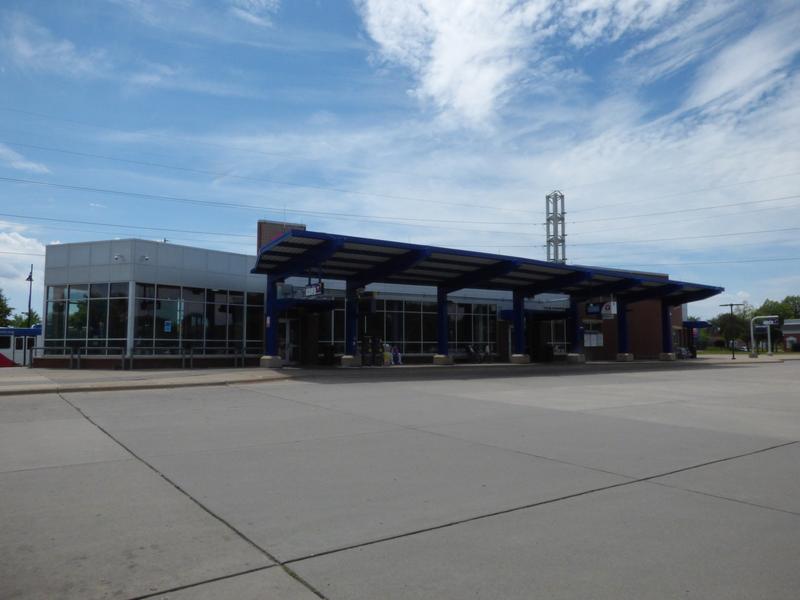
20.2% Asian · #3 most Asian in Minnesota
Brooklyn Park is the sixth largest city in the U.S. state of Minnesota. The city is located on the west bank of the Mississippi River, upstream from downtown Minneapolis in northern Hennepin County. Brooklyn Park is a northwest suburb of the Twin Cities metropolitan area of Minneapolis-Saint Paul.
Data | Crime | Cost of living | Movers
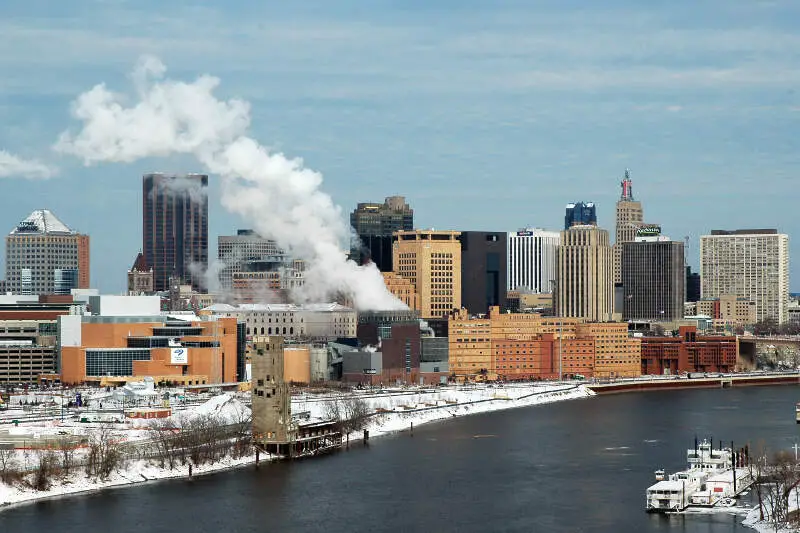
17.8% Asian · #4 most Asian in Minnesota
Saint Paul is the capital and second-most populous city of the U.S. state of Minnesota. As of 2016, the city’s estimated population was 304,442. Saint Paul is the county seat of Ramsey County, the smallest and most densely populated county in Minnesota. The city lies mostly on the east bank of the Mississippi River in the area surrounding its point of confluence with the Minnesota River, and adjoins Minneapolis, the state’s largest city. Known as the “Twin Cities”, the two form the core of Minneapolis-Saint Paul, the 16th-largest metropolitan area in the United States, with about 3.52 million residents.
Data | Crime | Cost of living | Movers | Compare
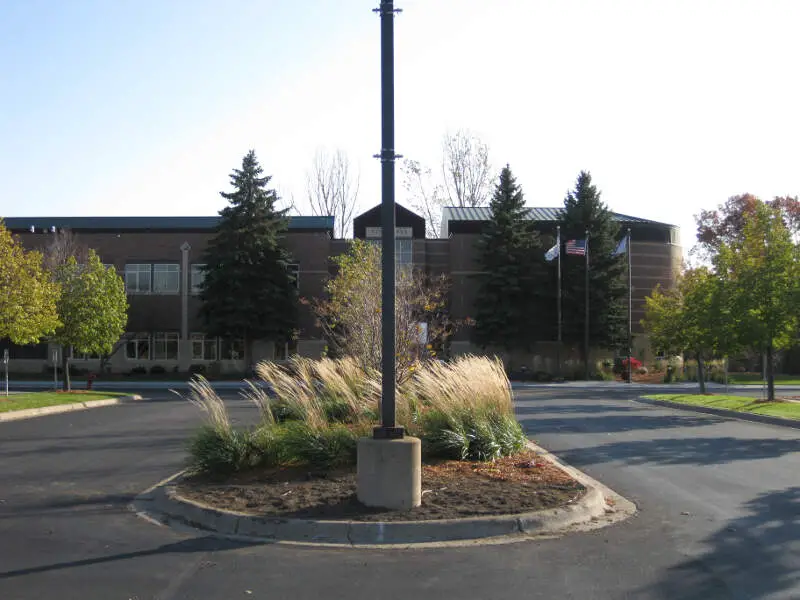
15.6% Asian · #5 most Asian in Minnesota
Corcoran is a city in Hennepin County, Minnesota, United States. The population was 5,379 at the 2010 census.
Data | Crime | Cost of living | Movers
15.2% Asian · #6 most Asian in Minnesota
Brooklyn Center is a city in Hennepin County, Minnesota, United States. The city is located on the west bank of the Mississippi River on the northwest border of Minneapolis. The population was 30,104 at the 2010 census.
Data | Crime | Cost of living | Movers
13.5% Asian · #7 most Asian in Minnesota
Woodbury is a suburb of St. Paul and the largest city in Washington County, Minnesota. It is part of the greater Twin Cities metropolitan area. Woodbury is situated east of Saint Paul along Interstate 94. The 2016 population for Woodbury was 68,349, making it the 8th most populous city in Minnesota.
Data | Crime | Cost of living | Movers

13.5% Asian · #8 most Asian in Minnesota
Falcon Heights is a suburb of Saint Paul and a city in Ramsey County, Minnesota, United States. The population was 5,321 at the 2010 census. It became a village in 1949 and a city in 1973.
Data | Crime | Cost of living | Movers
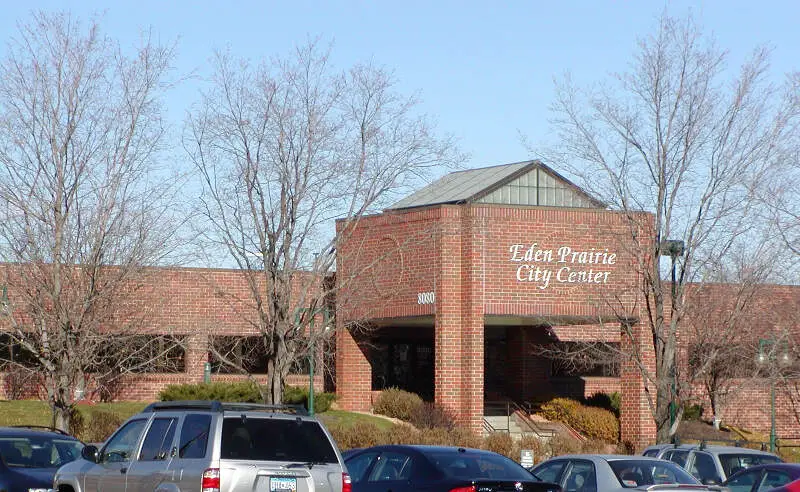
13.0% Asian · #9 most Asian in Minnesota
Eden Prairie is an edge city 12 miles southwest of downtown Minneapolis in Hennepin County, and the 12th-largest city in the State of Minnesota. It is on the north bank of the Minnesota River, upstream from its confluence with the Mississippi River. Eden Prairie and nearby suburbs form the southwest portion of Minneapolis-Saint Paul, the 15th-largest metropolitan area in the United States, with about 3.6 million residents. Eden Prairie had a population of 60,797 at the 2010 census, which made it the 7th-largest suburb in the Twin Cities and the 12th-largest city in Minnesota.
Data | Crime | Cost of living | Movers
12.9% Asian · #10 most Asian in Minnesota
Data | Crime | Cost of living | Movers
The receipts
Compare the top ten
Pick a metric. The bars rescale. The red line is Minnesota’s statewide median.
On the map
Where Minnesota’s Asian communities live
Saturday Night Science
Methodology: How We Determined The Cities In Minnesota With The Largest Asian Population For 2026
We used Saturday Night Science to compare Census data on race across every place in Minnesota.
The Census’s most recently available data comes from the 2020-2024 American Community Survey.
Specifically, we looked at table B03002: Hispanic OR LATINO ORIGIN BY RACE. Here are the category names as defined by the Census:
- Hispanic or Latino
- White alone*
- Black or African American alone*
- American Indian and Alaska Native alone*
- Asian alone*
- Native Hawaiian and Other Pacific Islander alone*
- Some other race alone*
- Two or more races*
Our particular column of interest here was the number of people who identified as Asian alone.
We limited our analysis to cities with a population greater than 5,000 people. That left us with 139 cities.
We then calculated the percentage of residents that are Asian. The percentages ranked from 21.8% to 0.0%.
Finally, we ranked each city based on the percentage of Asian population, with a higher percentage being more Asian. North St. Paul took the distinction of being the most Asian, while Belle Plaine was the least Asian city.
We updated this article for 2026. This report reflects our eleventh time ranking the cities in Minnesota with the largest Asian population.
The full plate
Cities In Minnesota By Asian Population
Click any column to sort. Search by city name.
| Rank | City | Population | Asian Population | % Asian |
|---|---|---|---|---|
| 1 | North St. Paul | 12,570 | 2,743 | 21.8% |
| 2 | Maplewood | 40,695 | 8,872 | 21.8% |
| 3 | Brooklyn Park | 83,876 | 16,912 | 20.2% |
| 4 | St. Paul | 307,284 | 54,722 | 17.8% |
| 5 | Corcoran | 7,302 | 1,140 | 15.6% |
| 6 | Brooklyn Center | 32,479 | 4,943 | 15.2% |
| 7 | Woodbury | 78,305 | 10,551 | 13.5% |
| 8 | Falcon Heights | 5,085 | 684 | 13.5% |
| 9 | Eden Prairie | 63,051 | 8,208 | 13.0% |
| 10 | Oakdale | 28,585 | 3,680 | 12.9% |
| 11 | Little Canada | 10,514 | 1,330 | 12.6% |
| 12 | Shakopee | 46,012 | 5,610 | 12.2% |
| 13 | Mounds View | 12,926 | 1,515 | 11.7% |
| 14 | Shoreview | 26,714 | 2,891 | 10.8% |
| 15 | Plymouth | 79,220 | 7,835 | 9.9% |
| 16 | Austin | 26,358 | 2,423 | 9.2% |
| 17 | Blaine | 72,488 | 6,564 | 9.1% |
| 18 | Roseville | 35,802 | 3,204 | 8.9% |
| 19 | Eagan | 68,000 | 5,749 | 8.5% |
| 20 | Vadnais Heights | 12,838 | 1,049 | 8.2% |
| 21 | Spring Lake Park | 7,032 | 560 | 8.0% |
| 22 | Rochester | 122,330 | 9,498 | 7.8% |
| 23 | Coon Rapids | 63,468 | 4,677 | 7.4% |
| 24 | Maple Grove | 71,173 | 5,226 | 7.3% |
| 25 | Cottage Grove | 40,992 | 3,000 | 7.3% |
| 26 | Edina | 53,262 | 3,715 | 7.0% |
| 27 | Orono | 8,195 | 541 | 6.6% |
| 28 | Savage | 32,889 | 2,158 | 6.6% |
| 29 | White Bear Lake | 23,908 | 1,517 | 6.3% |
| 30 | New Brighton | 22,710 | 1,440 | 6.3% |
| 31 | Lakeville | 74,354 | 4,626 | 6.2% |
| 32 | Marshall | 13,896 | 855 | 6.2% |
| 33 | Apple Valley | 55,679 | 3,364 | 6.0% |
| 34 | Minnetonka | 53,064 | 3,168 | 6.0% |
| 35 | Chanhassen | 26,006 | 1,541 | 5.9% |
| 36 | Fridley | 30,241 | 1,762 | 5.8% |
| 37 | Oak Grove | 9,130 | 527 | 5.8% |
| 38 | Rosemount | 27,562 | 1,585 | 5.8% |
| 39 | Worthington | 13,780 | 789 | 5.7% |
| 40 | Prior Lake | 28,016 | 1,550 | 5.5% |
| 41 | Richfield | 36,642 | 2,022 | 5.5% |
| 42 | Burnsville | 64,463 | 3,496 | 5.4% |
| 43 | Minneapolis | 427,246 | 22,472 | 5.3% |
| 44 | Bloomington | 88,665 | 4,564 | 5.1% |
| 45 | St. Paul Park | 5,457 | 274 | 5.0% |
| 46 | Albert Lea | 18,330 | 891 | 4.9% |
| 47 | Arden Hills | 9,658 | 466 | 4.8% |
| 48 | St. Anthony | 9,671 | 462 | 4.8% |
| 49 | Mendota Heights | 11,612 | 545 | 4.7% |
| 50 | Hugo | 16,340 | 732 | 4.5% |
| 51 | Ham Lake | 16,702 | 738 | 4.4% |
| 52 | Northfield | 20,742 | 913 | 4.4% |
| 53 | Inver Grove Heights | 35,906 | 1,558 | 4.3% |
| 54 | Champlin | 23,294 | 994 | 4.3% |
| 55 | Columbia Heights | 22,155 | 923 | 4.2% |
| 56 | St. Cloud | 70,629 | 2,868 | 4.1% |
| 57 | Lino Lakes | 22,113 | 896 | 4.1% |
| 58 | Chaska | 28,706 | 1,105 | 3.8% |
| 59 | St. Louis Park | 49,594 | 1,895 | 3.8% |
| 60 | Victoria | 11,295 | 422 | 3.7% |
| 61 | Anoka | 17,970 | 665 | 3.7% |
| 62 | Farmington | 23,902 | 884 | 3.7% |
| 63 | Otsego | 22,245 | 807 | 3.6% |
| 64 | Forest Lake | 20,729 | 741 | 3.6% |
| 65 | Hopkins | 18,819 | 666 | 3.5% |
| 66 | Wyoming | 8,087 | 284 | 3.5% |
| 67 | Crystal | 22,476 | 785 | 3.5% |
| 68 | Monticello | 14,858 | 504 | 3.4% |
| 69 | Mankato | 45,473 | 1,500 | 3.3% |
| 70 | Ramsey | 28,421 | 935 | 3.3% |
| 71 | Cambridge | 10,307 | 336 | 3.3% |
| 72 | Lake Elmo | 13,140 | 420 | 3.2% |
| 73 | Morris | 5,128 | 161 | 3.1% |
| 74 | Golden Valley | 21,725 | 682 | 3.1% |
| 75 | New Hope | 21,181 | 663 | 3.1% |
| 76 | Robbinsdale | 14,234 | 445 | 3.1% |
| 77 | Andover | 33,035 | 997 | 3.0% |
| 78 | Waseca | 9,164 | 274 | 3.0% |
| 79 | St. Michael | 20,010 | 546 | 2.7% |
| 80 | Mahtomedi | 8,133 | 221 | 2.7% |
| 81 | North Mankato | 14,211 | 365 | 2.6% |
| 82 | Willmar | 21,378 | 527 | 2.5% |
| 83 | Rogers | 13,685 | 334 | 2.4% |
| 84 | Montevideo | 5,315 | 128 | 2.4% |
| 85 | Stillwater | 19,355 | 447 | 2.3% |
| 86 | St. Francis | 8,372 | 185 | 2.2% |
| 87 | Hastings | 22,117 | 475 | 2.1% |
| 88 | Winona | 26,009 | 516 | 2.0% |
| 89 | Big Lake | 12,367 | 243 | 2.0% |
| 90 | Moorhead | 45,036 | 881 | 2.0% |
| 91 | North Branch | 11,565 | 222 | 1.9% |
| 92 | Buffalo | 16,499 | 311 | 1.9% |
| 93 | Fergus Falls | 14,181 | 258 | 1.8% |
| 94 | Thief River Falls | 8,823 | 156 | 1.8% |
| 95 | Mound | 9,107 | 160 | 1.8% |
| 96 | St. Joseph | 7,021 | 123 | 1.8% |
| 97 | Elk River | 26,793 | 464 | 1.7% |
| 98 | Sartell | 19,758 | 341 | 1.7% |
| 99 | Duluth | 87,093 | 1,498 | 1.7% |
| 100 | South St. Paul | 20,611 | 343 | 1.7% |
Source: U.S. Census ACS 2020-2024. 139 cities with more than 5,000 residents.
Summary
Summary: Asian Populations Across Minnesota
If you’re looking for a breakdown of Asian populations across Minnesota according to the most recent data, this is an accurate list.
The most Asian cities in Minnesota are North St. Paul, Maplewood, Brooklyn Park, St. Paul, Corcoran, Brooklyn Center, Woodbury, Falcon Heights, Eden Prairie, and Oakdale. Not sold on Minnesota? Take the two-minute Find Your Place quiz and see which state actually fits you.


