Most Asian cities in South Carolina research summary. We analyzed South Carolina’s most recent Census data to determine the most Asian cities in South Carolina based on the percentage of Asian residents.
10.3% Asian · #1 most Asian in South Carolina
Data | Crime | Cost of living | Movers
6.0% Asian · #2 most Asian in South Carolina
Lexington is the largest town in and the county seat of Lexington County, South Carolina, United States. Lexington is a suburb of the state’s capital and second-largest city, Columbia. The U.S. Census Bureau estimated 2016 population is 24,905, and it is the second-largest municipality in the Columbia, South Carolina metropolitan area.
Data | Crime | Cost of living | Movers
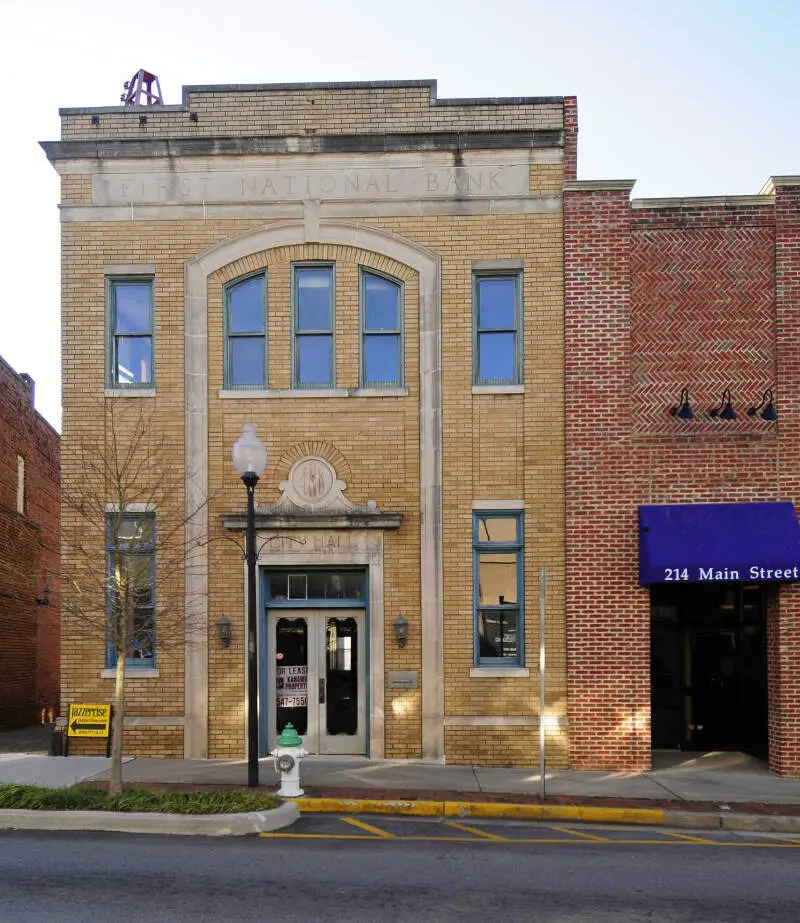
5.5% Asian · #3 most Asian in South Carolina
Fort Mill, also known as Fort Mill Township, is a town in York County in the U.S. state of South Carolina. It is a suburb of the city of Charlotte, North Carolina and is located north of Rock Hill. As of 2015, approximately 13,662 people live inside the town’s corporate limits with a total of 36,119 people residing within the entire township. Some businesses and residents in the Indian Land community of neighboring Lancaster County often use Fort Mill as their city address as it is the nearest incorporated area, but the official town boundary is located only in York County.
Data | Crime | Cost of living | Movers
5.3% Asian · #4 most Asian in South Carolina
Clemson is a city in Pickens and Anderson counties in the U.S. state of South Carolina. Clemson is home to Clemson University; in 2015, the Princeton Review cited the town of Clemson as ranking #1 in the United States for “town-and-gown” relations with its resident university. The population of the city was 13,905 at the 2010 census.
Clemson is part of the Greenville-Spartanburg-Anderson, South Carolina Combined Statistical Area. Most of the city is in Pickens County, which is part of the Greenville-Mauldin-Easley Metropolitan Statistical Area. A small portion is in Anderson County, which is part of the Anderson Metropolitan Statistical Area.
Data | Crime | Cost of living | Movers
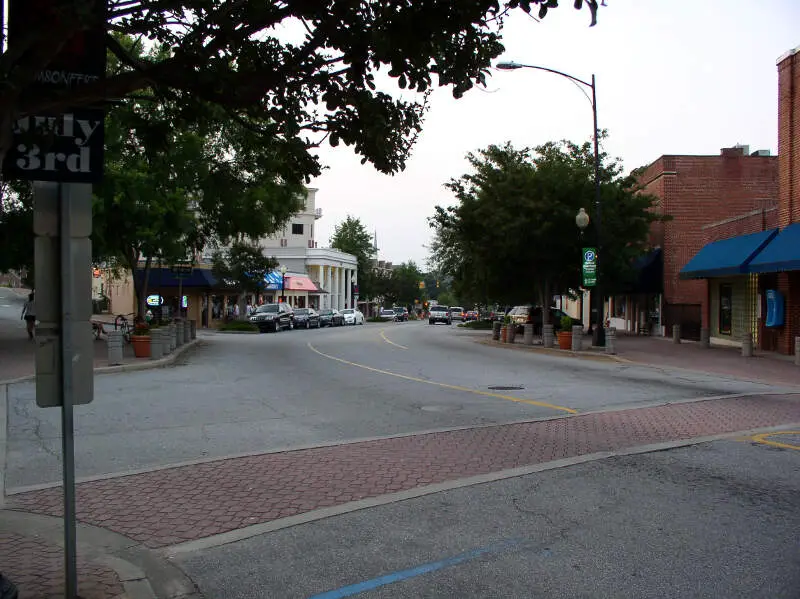
5.2% Asian · #5 most Asian in South Carolina
Greer is a city in Greenville and Spartanburg counties in the U.S. state of South Carolina. The population was 25,515 as of the 2010 census and had risen to an estimated 28,365 as of 2015. Each day, more than three times that number of people pass through the city on the two highways which run through the city. The majority of the city is in Greenville County and is part of the Greenville-Anderson-Mauldin Metropolitan Statistical Area.The city is additionally part of the Greenville-Spartanburg-Anderson, SC Combined Statistical Area in Upstate South Carolina.
Data | Crime | Cost of living | Movers
4.3% Asian · #6 most Asian in South Carolina
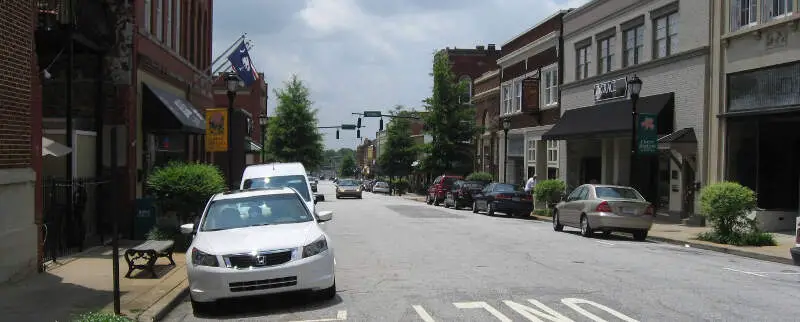
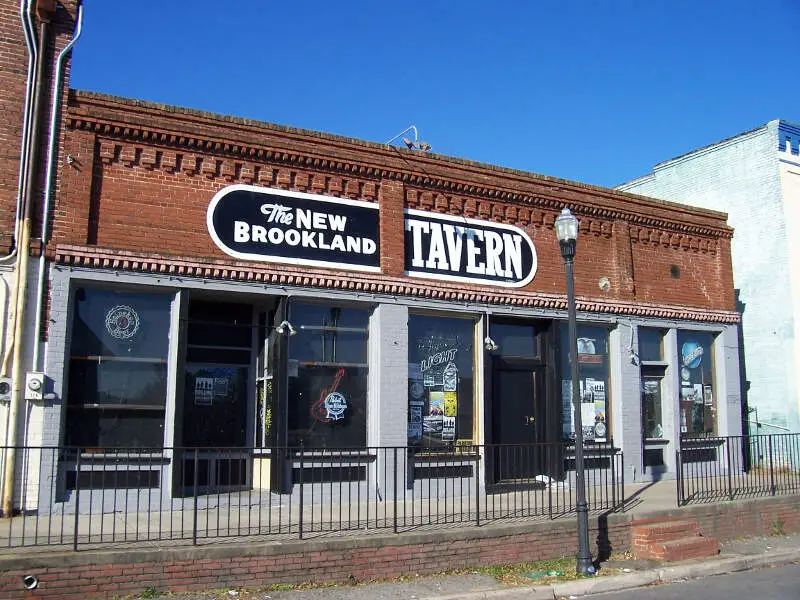
West Columbia is a city and commuter town in the suburban eastern sections of Lexington County, South Carolina, United States. According to the 2010 census, the population was 14,988. It is a part of the greater Columbia, SC metropolitan statistical area.
Data | Crime | Cost of living | Movers
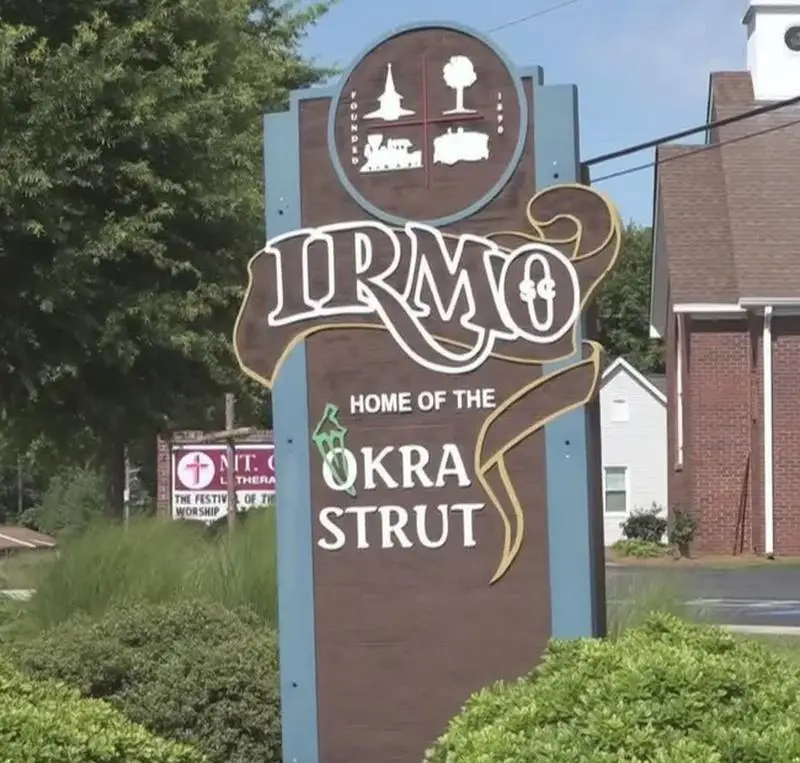
4.3% Asian · #7 most Asian in South Carolina
Irmo is a town in Lexington and Richland counties, South Carolina, United States and a suburb of Columbia. It is part of the Columbia Metropolitan Statistical Area and is located 12 miles northwest of the city center. The population of Irmo was 11,097 at the 2010 census.
Data | Crime | Cost of living | Movers

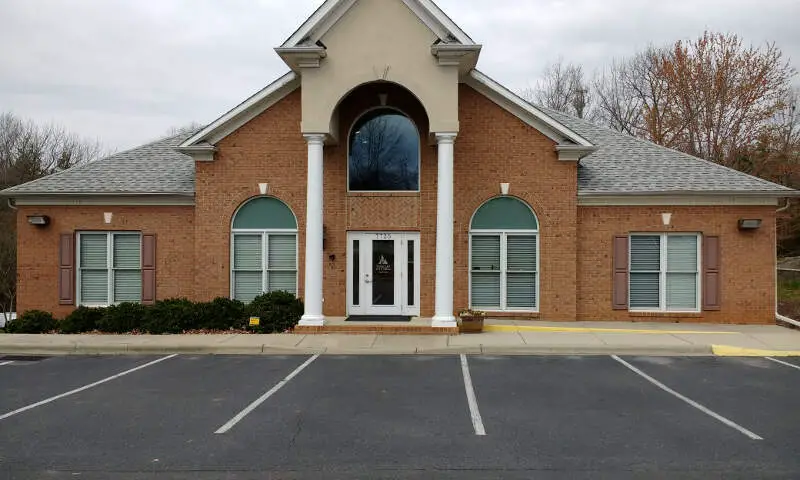
4.3% Asian · #8 most Asian in South Carolina
Data | Crime | Cost of living | Movers
3.4% Asian · #9 most Asian in South Carolina
Mauldin is a city in Greenville County, South Carolina, United States. The population was 15,224 at the 2000 census, 22,889 in 2010, and an estimated 25,135 in 2015. It is a principal city of the Greenville-Anderson-Mauldin Metropolitan Statistical Area.
Data | Crime | Cost of living | Movers

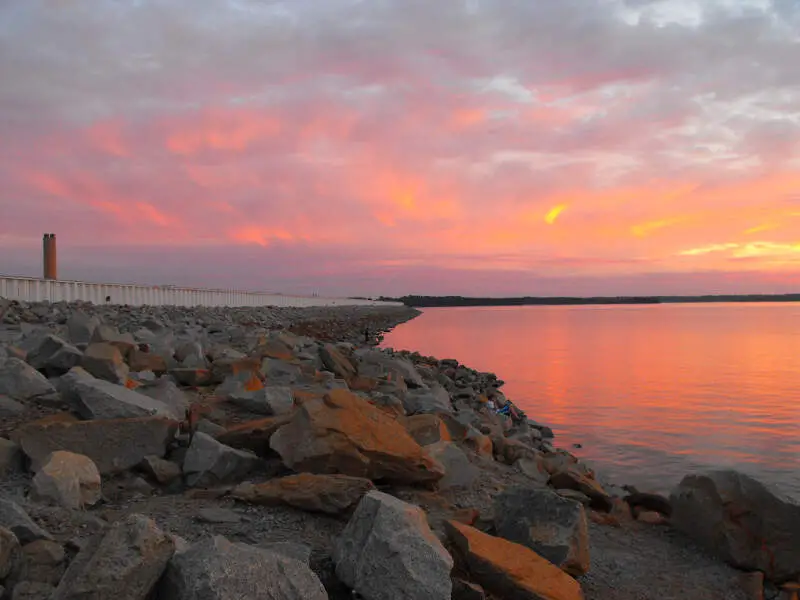
3.3% Asian · #10 most Asian in South Carolina
Goose Creek is a city in Berkeley County in the U.S. state of South Carolina. The population was 35,938 at the 2010 census. Most of the Naval Weapons Station Charleston is in Goose Creek. As defined by the U.S. Office of Management and Budget, and used only by the U.S. Census Bureau and other Federal agencies for statistical purposes, Goose Creek is included within the Charleston-North Charleston-Summerville metropolitan area and the Charleston-North Charleston Urbanized Area.
Data | Crime | Cost of living | Movers
The receipts
Compare the top ten
Pick a metric. The bars rescale. The red line is South Carolina’s statewide median.
On the map
Where South Carolina’s Asian communities live
Saturday Night Science
Methodology: How We Determined The Cities In South Carolina With The Largest Asian Population For 2026
We used Saturday Night Science to compare Census data on race across every place in South Carolina.
The Census’s most recently available data comes from the 2020-2024 American Community Survey.
Specifically, we looked at table B03002: Hispanic OR LATINO ORIGIN BY RACE. Here are the category names as defined by the Census:
- Hispanic or Latino
- White alone*
- Black or African American alone*
- American Indian and Alaska Native alone*
- Asian alone*
- Native Hawaiian and Other Pacific Islander alone*
- Some other race alone*
- Two or more races*
Our particular column of interest here was the number of people who identified as Asian alone.
We limited our analysis to cities with a population greater than 5,000 people. That left us with 56 cities.
We then calculated the percentage of residents that are Asian. The percentages ranked from 10.3% to 0.0%.
Finally, we ranked each city based on the percentage of Asian population, with a higher percentage being more Asian. Tega Cay took the distinction of being the most Asian, while Fountain Inn was the least Asian city.
We updated this article for 2026. This report reflects our eleventh time ranking the cities in South Carolina with the largest Asian population.
The full plate
Cities In South Carolina By Asian Population
Click any column to sort. Search by city name.
| Rank | City | Population | Asian Population | % Asian |
|---|---|---|---|---|
| 1 | Tega Cay | 13,615 | 1,398 | 10.3% |
| 2 | Lexington | 24,585 | 1,477 | 6.0% |
| 3 | Fort Mill | 30,775 | 1,697 | 5.5% |
| 4 | Clemson | 18,072 | 965 | 5.3% |
| 5 | Greer | 41,536 | 2,146 | 5.2% |
| 6 | West Columbia | 17,963 | 767 | 4.3% |
| 7 | Irmo | 11,813 | 504 | 4.3% |
| 8 | Hanahan | 21,452 | 914 | 4.3% |
| 9 | Mauldin | 27,055 | 909 | 3.4% |
| 10 | Goose Creek | 48,078 | 1,587 | 3.3% |
| 11 | Florence | 40,408 | 1,307 | 3.2% |
| 12 | Columbia | 139,643 | 4,436 | 3.2% |
| 13 | Hartsville | 7,419 | 233 | 3.1% |
| 14 | North Charleston | 119,913 | 3,727 | 3.1% |
| 15 | Sumter | 43,053 | 1,206 | 2.8% |
| 16 | Walterboro | 5,480 | 146 | 2.7% |
| 17 | Cayce | 13,741 | 355 | 2.6% |
| 18 | Clinton | 7,676 | 179 | 2.3% |
| 19 | Greenville | 72,935 | 1,609 | 2.2% |
| 20 | Anderson | 30,051 | 648 | 2.2% |
| 21 | Port Royal | 15,579 | 334 | 2.1% |
| 22 | Spartanburg | 38,910 | 798 | 2.1% |
| 23 | Summerville | 51,654 | 984 | 1.9% |
| 24 | Charleston | 154,338 | 2,916 | 1.9% |
| 25 | Forest Acres | 10,530 | 192 | 1.8% |
| 26 | Conway | 27,263 | 494 | 1.8% |
| 27 | Rock Hill | 75,259 | 1,359 | 1.8% |
| 28 | Aiken | 32,521 | 564 | 1.7% |
| 29 | Simpsonville | 26,144 | 439 | 1.7% |
| 30 | Mount Pleasant | 93,993 | 1,495 | 1.6% |
| 31 | Newberry | 10,790 | 162 | 1.5% |
| 32 | Bluffton | 33,157 | 478 | 1.4% |
| 33 | North Augusta | 25,653 | 318 | 1.2% |
| 34 | Greenwood | 22,536 | 264 | 1.2% |
| 35 | Myrtle Beach | 38,371 | 444 | 1.2% |
| 36 | Bennettsville | 7,751 | 88 | 1.1% |
| 37 | Orangeburg | 13,253 | 149 | 1.1% |
| 38 | Hilton Head Island | 37,911 | 382 | 1.0% |
| 39 | Chester | 5,218 | 49 | 0.9% |
| 40 | Beaufort | 13,747 | 127 | 0.9% |
| 41 | Seneca | 8,993 | 72 | 0.8% |
| 42 | Lancaster | 8,921 | 68 | 0.8% |
| 43 | North Myrtle Beach | 19,855 | 151 | 0.8% |
| 44 | Easley | 24,841 | 158 | 0.6% |
| 45 | Camden | 8,267 | 44 | 0.5% |
| 46 | Gaffney | 12,596 | 48 | 0.4% |
| 47 | Georgetown | 8,565 | 25 | 0.3% |
| 48 | York | 8,969 | 25 | 0.3% |
| 49 | Moncks Corner | 15,485 | 36 | 0.2% |
| 50 | Laurens | 9,336 | 12 | 0.1% |
| 51 | Union | 8,079 | 6 | 0.1% |
| 54 | Dillon | 6,354 | 0 | 0.0% |
| 54 | Darlington | 6,120 | 0 | 0.0% |
| 54 | Marion | 6,206 | 0 | 0.0% |
| 54 | Lake City | 5,988 | 0 | 0.0% |
| 54 | Fountain Inn | 12,020 | 0 | 0.0% |
Source: U.S. Census ACS 2020-2024. 56 cities with more than 5,000 residents.
Summary
Summary: Asian Populations Across South Carolina
If you’re looking for a breakdown of Asian populations across South Carolina according to the most recent data, this is an accurate list.
The most Asian cities in South Carolina are Tega Cay, Lexington, Fort Mill, Clemson, Greer, West Columbia, Irmo, Hanahan, Mauldin, and Goose Creek. Not sold on South Carolina? Take the two-minute Find Your Place quiz and see which state actually fits you.


