Racial diversity in Colorado is a mixed bag.
There are parts of Colorado where there’s a high level of diversity. But where will you find the most diverse places in Colorado?
To answer that question, we went to the US Census data. Using Saturday Night Science, we measured the Gini coefficient for all 77 cities in Colorado to rank them from most to least diverse.
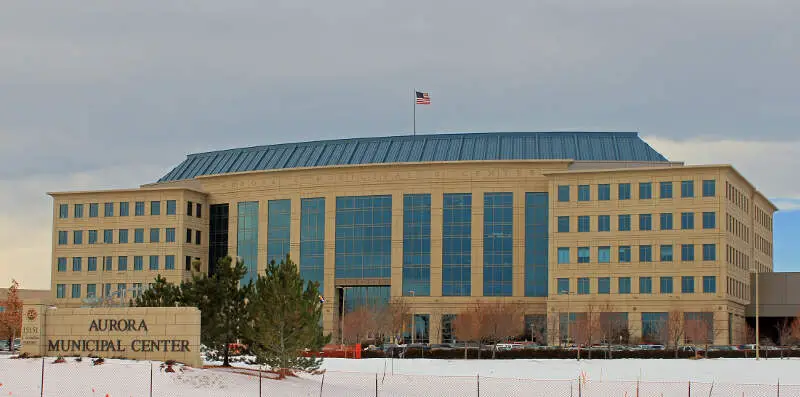
#1 most diverse in Colorado
Aurora is a Home Rule Municipality in the U.S. state of Colorado, spanning Arapahoe and Adams counties, with the extreme southeastern portion of the city extending into Douglas County. Aurora is one of the principal cities of the Denver-Aurora-Lakewood, CO Metropolitan Statistical Area. The city’s population was 325,078 in the 2010 census, which made it the third most populous city in the state of Colorado and the 54th most populous city in the United States.
Data | Crime | Cost of living | Movers
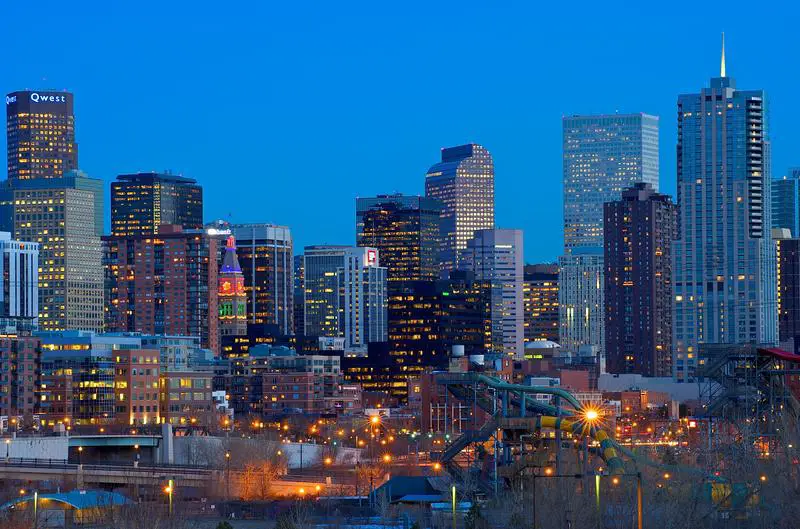
#2 most diverse in Colorado
Denver, officially the City and County of Denver, is the capital and most populous municipality of the U.S. state of Colorado. Denver is in the South Platte River Valley on the western edge of the High Plains just east of the Front Range of the Rocky Mountains. The Denver downtown district is immediately east of the confluence of Cherry Creek with the South Platte River, approximately 12mi east of the foothills of the Rocky Mountains. Denver is nicknamed the Mile High City because its official elevation is exactly one mile above sea level, making it the highest major city in the United States. The 105th meridian west of Greenwich, the longitudinal reference for the Mountain Time Zone, passes directly through Denver Union Station.
Data | Crime | Cost of living | Movers
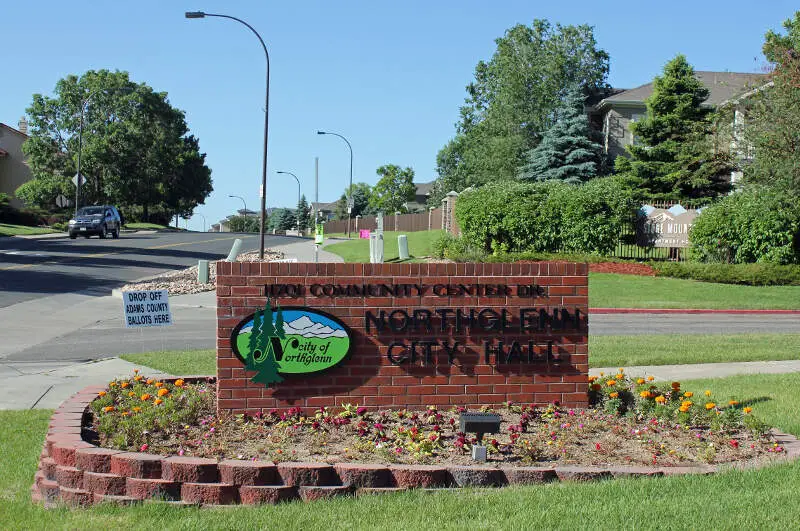
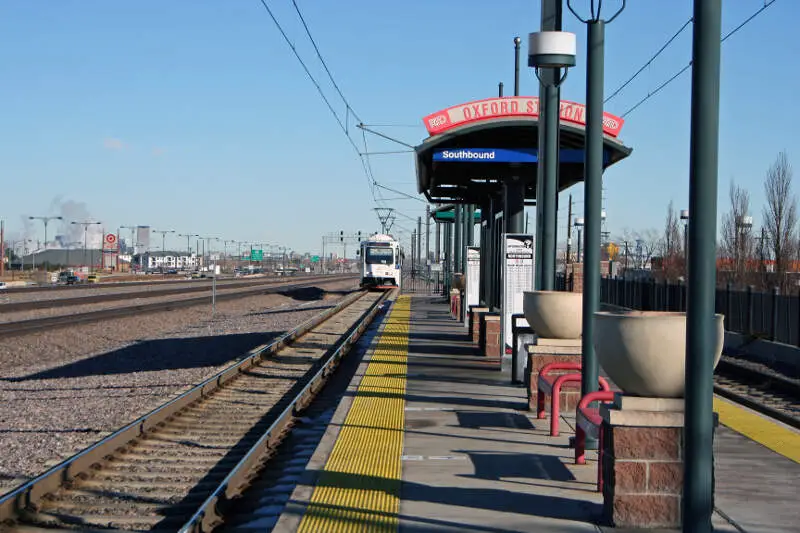
#3 most diverse in Colorado
Data | Crime | Cost of living | Movers
#4 most diverse in Colorado
Data | Crime | Cost of living | Movers
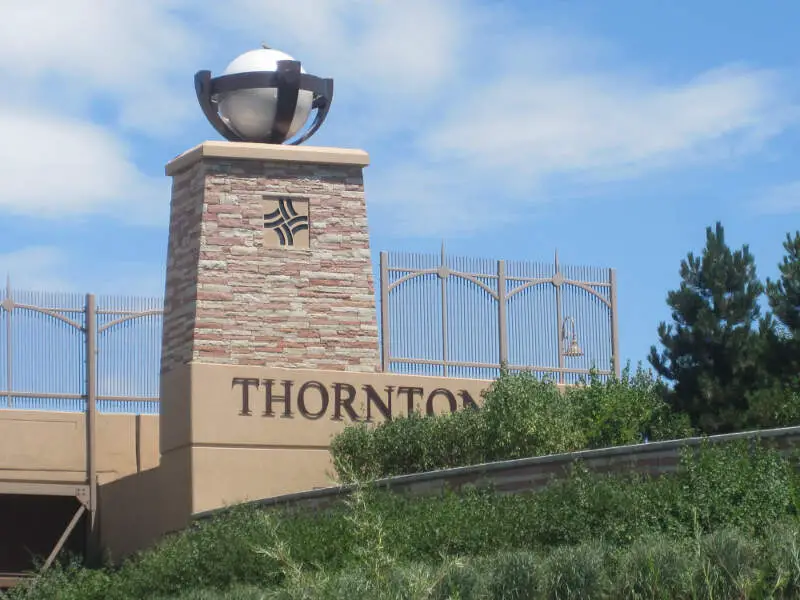
#5 most diverse in Colorado
The City of Thornton is a Home Rule Municipality in Adams and Weld counties in the U.S. state of Colorado, located in the northeast quadrant of the Denver-Aurora-Broomfield, CO Metropolitan Statistical Area. Thornton is 10 miles north/northeast of downtown Denver. The United States Census Bureau reported the city’s growing population at 118,772 on April 1, 2010, a 44.2% increase from the 2000 Census population of 82,384. Thornton is the sixth-most populous city in the state of Colorado and the 213th-most populous city in the United States.
Data | Crime | Cost of living | Movers
#6 most diverse in Colorado
The City of Fountain is a Home Rule Municipality located in El Paso County, Colorado, United States. As of the 2010 census, the city’s population was 25,846.
Data | Crime | Cost of living | Movers
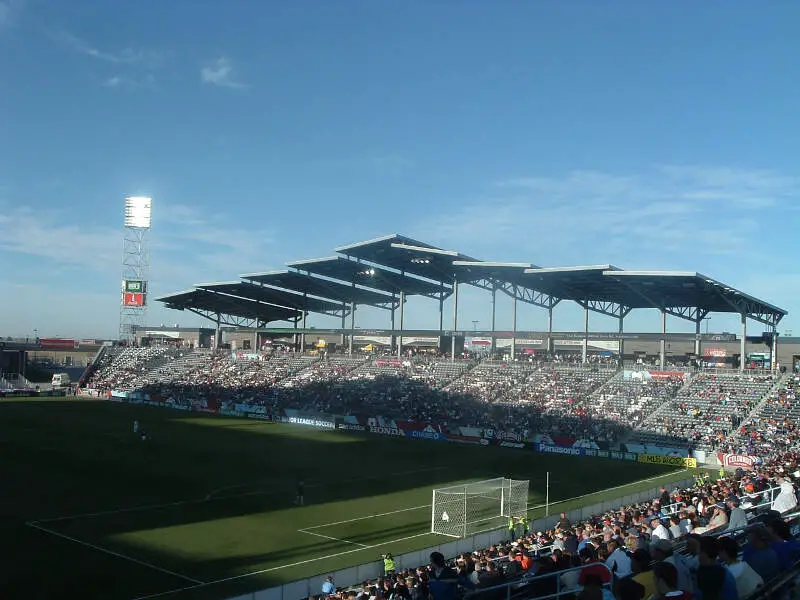
#7 most diverse in Colorado
The City of Commerce City is a Home Rule Municipality located in Adams County, Colorado, United States. Commerce City is a northern suburb of Denver and as of 2013 is the 18th most populous municipality in Colorado. The city population was 45,913 at the 2010 United States Census, a population increase of 118.7% in the ten years since the 2000 census.
Data | Crime | Cost of living | Movers
#8 most diverse in Colorado
The City of Brighton is the Home Rule Municipality in Adams and Weld counties that is the county seat of Adams County, Colorado, United States. The United States Census Bureau estimates that the city population was 35,719 in 2013.
Data | Crime | Cost of living | Movers
#9 most diverse in Colorado
Data | Crime | Cost of living | Movers
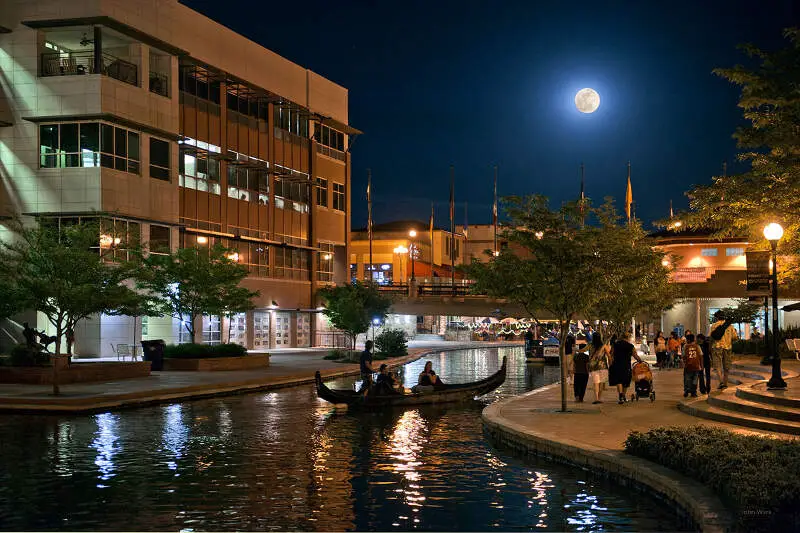
#10 most diverse in Colorado
Pueblo is a home rule municipality that is the county seat and the most populous city of Pueblo County, Colorado, United States. The population was 106,595 in 2010 census, making it the 267th most populous city in the United States and the 9th largest in Colorado. Pueblo is the heart of the Pueblo Metropolitan Statistical Area totaling over 160,000 people and an important part of the Front Range Urban Corridor. As of 2014, Pueblo is the primary city of the Pueblo-Caon City combined statistical area totaling approximately 208,000 people, making it the 134th largest in the nation.
Data | Crime | Cost of living | Movers
The receipts
Compare the top ten
Pick a metric. The bars rescale. The red line is Colorado’s statewide median.
On the map
Where diversity lives in Colorado
Saturday Night Science
Methodology: How we determined the most diverse cities in Colorado for 2026
We still believe in the accuracy of data — especially from the Census — and Saturday Night Science. So that’s where we went to get the race breakdown across Colorado.
That leads us to the Census’s most recently available data, the 2020-2024 American Community Survey data from the US Census.
Specifically, we looked at table B03002: HISPANIC OR LATINO ORIGIN BY RACE. Here are the category names as defined by the Census:
- White alone*
- Black or African American alone*
- American Indian and Alaska Native alone*
- Asian alone*
- Native Hawaiian and Other Pacific Islander alone*
- Some other race alone*
- Two or more races*
- Hispanic or Latino
We limited our analysis to non-CDPs with a population greater than 5,000 people. That left us with 77 cities.
We then calculated the HHI for each city by finding the racial breakdown of a city in percent terms, squaring them, and then adding the squares together. This left us with scores ranging from 2,958 (Aurora) to 7,901 (Estes Park).
Finally, we ranked each city based on the HHI, with a lower score being more diverse than a high score. Aurora took the distinction of being the most diverse, while Estes Park was the least diverse city.
We updated this article for 2026. This report is our eleventh time ranking the most diverse places in Colorado.
The full plate
Race By City In Colorado For 2026
Click any column to sort. Search by city name.
| Rank | City | Population | HHI | % White | % Black | % Hispanic | % Asian |
|---|---|---|---|---|---|---|---|
| 1 | Aurora | 394,432 | 2,958 | 40.9% | 15.3% | 31.4% | 6.0% |
| 2 | Denver | 718,877 | 3,811 | 54.0% | 8.6% | 28.0% | 3.6% |
| 3 | Northglenn | 38,014 | 3,842 | 48.6% | 2.9% | 37.8% | 4.2% |
| 4 | Avon | 5,972 | 3,890 | 53.0% | 0.0% | 31.2% | 6.2% |
| 5 | Thornton | 144,187 | 3,986 | 50.2% | 2.0% | 37.7% | 5.2% |
| 6 | Fountain | 29,300 | 4,023 | 57.2% | 8.1% | 25.3% | 2.6% |
| 7 | Commerce City | 66,445 | 4,044 | 40.7% | 3.8% | 48.5% | 2.4% |
| 8 | Brighton | 42,059 | 4,158 | 51.4% | 2.7% | 38.6% | 1.9% |
| 9 | Sheridan | 6,005 | 4,164 | 48.5% | 2.2% | 42.3% | 2.7% |
| 10 | Pueblo | 111,561 | 4,277 | 43.9% | 2.6% | 48.3% | 0.8% |
| 11 | Lochbuie | 8,609 | 4,332 | 48.7% | 4.7% | 44.0% | 0.0% |
| 12 | Evans | 22,396 | 4,351 | 46.7% | 1.1% | 46.4% | 1.3% |
| 13 | Greeley | 110,806 | 4,380 | 51.3% | 2.5% | 41.6% | 1.4% |
| 14 | Cortez | 8,976 | 4,401 | 62.1% | 0.1% | 19.7% | 0.5% |
| 15 | Trinidad | 8,286 | 4,406 | 48.9% | 1.1% | 44.8% | 1.8% |
| 16 | Alamosa | 9,879 | 4,410 | 38.5% | 1.7% | 54.0% | 1.7% |
| 17 | Fort Morgan | 11,605 | 4,444 | 37.8% | 3.2% | 54.7% | 1.3% |
| 18 | Glenwood Springs | 10,241 | 4,501 | 55.8% | 1.1% | 37.0% | 0.6% |
| 19 | Lamar | 7,611 | 4,547 | 50.6% | 1.6% | 44.5% | 0.3% |
| 20 | La Junta | 7,140 | 4,594 | 52.6% | 1.3% | 42.7% | 0.2% |
| 21 | Rifle | 10,570 | 4,657 | 47.0% | 0.1% | 49.4% | 0.6% |
| 22 | Firestone | 18,049 | 4,672 | 63.3% | 0.6% | 25.0% | 4.9% |
| 23 | Brush | 5,306 | 4,693 | 60.8% | 0.7% | 30.8% | 0.6% |
| 24 | Colorado Springs | 487,887 | 4,696 | 65.2% | 5.3% | 19.3% | 2.9% |
| 25 | Dacono | 6,530 | 4,741 | 62.3% | 1.0% | 28.8% | 4.7% |
| 26 | Westminster | 115,484 | 4,766 | 63.9% | 1.1% | 25.4% | 4.4% |
| 27 | Gypsum | 8,941 | 4,852 | 43.9% | 0.0% | 54.0% | 0.6% |
| 28 | Fort Lupton | 8,897 | 4,982 | 35.4% | 0.3% | 61.0% | 0.2% |
| 29 | Federal Heights | 14,125 | 5,004 | 28.2% | 1.6% | 64.8% | 2.7% |
| 30 | Englewood | 34,129 | 5,027 | 67.9% | 3.7% | 19.3% | 3.1% |
| 31 | Longmont | 99,406 | 5,055 | 66.7% | 0.8% | 24.0% | 3.3% |
| 32 | Superior | 13,305 | 5,081 | 68.8% | 0.4% | 9.9% | 14.8% |
| 33 | Lakewood | 156,583 | 5,189 | 68.2% | 1.3% | 22.6% | 3.6% |
| 34 | Lafayette | 30,602 | 5,256 | 69.5% | 0.8% | 19.2% | 3.9% |
| 35 | Eagle | 7,442 | 5,353 | 67.1% | 0.1% | 29.1% | 0.8% |
| 36 | Parker | 61,783 | 5,391 | 71.6% | 1.7% | 12.9% | 7.6% |
| 37 | Frederick | 16,651 | 5,398 | 70.6% | 0.7% | 19.5% | 4.1% |
| 38 | Sterling | 13,172 | 5,408 | 70.2% | 4.3% | 21.2% | 0.8% |
| 39 | Severance | 10,130 | 5,485 | 71.0% | 0.6% | 20.4% | 1.4% |
| 40 | Broomfield | 76,304 | 5,511 | 72.4% | 1.1% | 14.1% | 6.9% |
| 41 | Delta | 9,421 | 5,538 | 69.9% | 0.3% | 25.3% | 1.4% |
| 42 | Mead | 5,919 | 5,560 | 69.8% | 0.0% | 25.9% | 2.0% |
| 43 | Centennial | 108,201 | 5,669 | 74.1% | 2.8% | 10.3% | 6.4% |
| 44 | Milliken | 8,871 | 5,686 | 69.9% | 0.0% | 28.1% | 0.0% |
| 45 | Wheat Ridge | 32,070 | 5,694 | 72.8% | 3.0% | 19.4% | 1.5% |
| 46 | Carbondale | 6,637 | 5,723 | 72.5% | 1.3% | 21.1% | 1.6% |
| 47 | Lone Tree | 14,147 | 5,732 | 74.5% | 2.9% | 6.1% | 11.3% |
| 48 | John | 18,883 | 5,794 | 73.3% | 0.7% | 20.0% | 1.5% |
| 49 | Wellington | 11,798 | 5,803 | 72.3% | 0.1% | 23.9% | 0.6% |
| 50 | Eaton | 5,867 | 5,876 | 73.3% | 0.0% | 22.3% | 1.2% |
| 51 | Craig | 8,991 | 5,960 | 75.3% | 0.1% | 16.2% | 0.6% |
| 52 | Montrose | 21,044 | 5,999 | 74.4% | 0.5% | 21.5% | 0.9% |
| 53 | Arvada | 122,634 | 6,049 | 76.0% | 1.0% | 15.8% | 2.6% |
| 54 | Grand Junction | 68,142 | 6,081 | 76.0% | 0.8% | 17.0% | 1.0% |
| 55 | Erie | 33,808 | 6,133 | 77.2% | 0.2% | 10.4% | 6.1% |
| 56 | Gunnison | 6,766 | 6,165 | 77.0% | 1.1% | 14.0% | 1.2% |
| 57 | Fort Collins | 170,229 | 6,176 | 77.3% | 1.3% | 12.8% | 3.3% |
| 58 | Greenwood Village | 15,420 | 6,182 | 77.6% | 1.1% | 7.5% | 9.6% |
| 59 | Littleton | 44,710 | 6,202 | 77.4% | 1.9% | 13.3% | 2.4% |
| 60 | Steamboat Springs | 13,433 | 6,227 | 77.5% | 0.2% | 10.0% | 0.9% |
| 61 | Castle Rock | 79,123 | 6,237 | 77.8% | 0.8% | 11.7% | 2.5% |
| 62 | Boulder | 106,433 | 6,252 | 78.0% | 1.0% | 10.7% | 5.4% |
| 63 | Durango | 19,411 | 6,279 | 78.4% | 0.6% | 8.7% | 0.8% |
| 64 | Castle Pines | 13,388 | 6,306 | 78.6% | 4.4% | 9.2% | 3.5% |
| 65 | Louisville | 20,786 | 6,334 | 78.6% | 1.4% | 10.4% | 3.7% |
| 66 | Loveland | 78,410 | 6,423 | 78.6% | 0.9% | 15.3% | 1.2% |
| 67 | Aspen | 6,756 | 6,442 | 79.0% | 1.0% | 13.4% | 1.8% |
| 68 | Windsor | 37,914 | 6,684 | 80.8% | 1.1% | 12.0% | 1.4% |
| 69 | Salida | 5,861 | 6,851 | 81.8% | 0.0% | 10.3% | 0.7% |
| 70 | Golden | 20,417 | 6,874 | 82.3% | 1.0% | 7.9% | 4.0% |
| 71 | Berthoud | 12,411 | 6,941 | 82.3% | 0.5% | 12.9% | 2.0% |
| 72 | Woodland Park | 7,949 | 7,059 | 83.3% | 1.7% | 9.6% | 0.0% |
| 73 | Monument | 11,735 | 7,064 | 83.4% | 0.7% | 8.8% | 2.9% |
| 74 | Fruita | 13,691 | 7,279 | 84.8% | 1.2% | 8.4% | 0.4% |
| 75 | Cherry Hills Village | 6,354 | 7,313 | 85.1% | 1.4% | 7.1% | 1.9% |
| 76 | Timnath | 8,941 | 7,578 | 86.8% | 1.2% | 5.6% | 2.5% |
| 77 | Estes Park | 5,844 | 7,901 | 88.6% | 0.2% | 6.1% | 2.8% |
Source: U.S. Census ACS 2020-2024. 77 cities with more than 5,000 residents.
Summary
Summary: Diversity Across Colorado
If you’re looking for a scientific breakdown of diversity across Colorado, this is an accurate list.
The most diverse cities in Colorado are Aurora, Denver, Northglenn, Avon, Thornton, Fountain, Commerce City, Brighton, Sheridan, and Pueblo.


