Racial diversity in Kentucky is a mixed bag.
There are parts of Kentucky where there’s a high level of diversity. But where will you find the most diverse places in Kentucky?
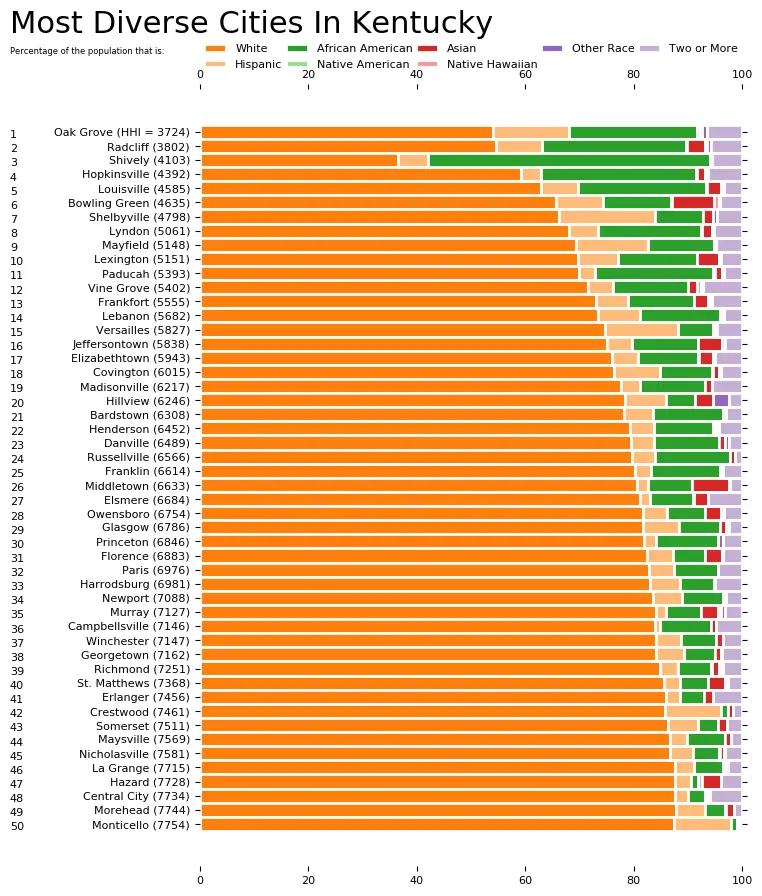
To answer that question, we went to the US Census data. Using Saturday Night Science, we measured the Gini coefficient for all 80 cities in Kentucky to rank them from most to least diverse.
Table Of Contents: Top Ten | Methodology | Summary | Table
Here are the 10 most diverse places in Kentucky for 2026:
- Oak Grove
- Radcliff
- Louisville/Jefferson County metro government (balance)
- Hopkinsville
- Bowling Green
- Shively
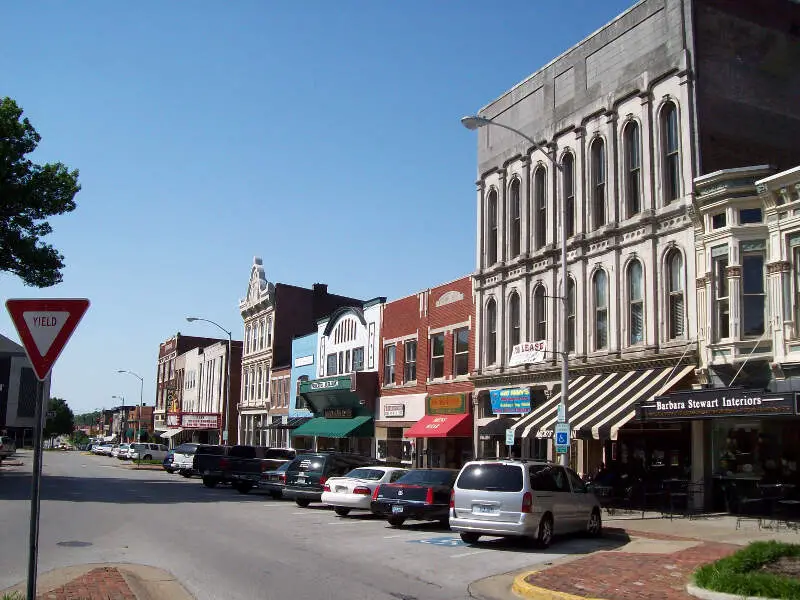
- Mayfield
- Lexington-Fayette urban county
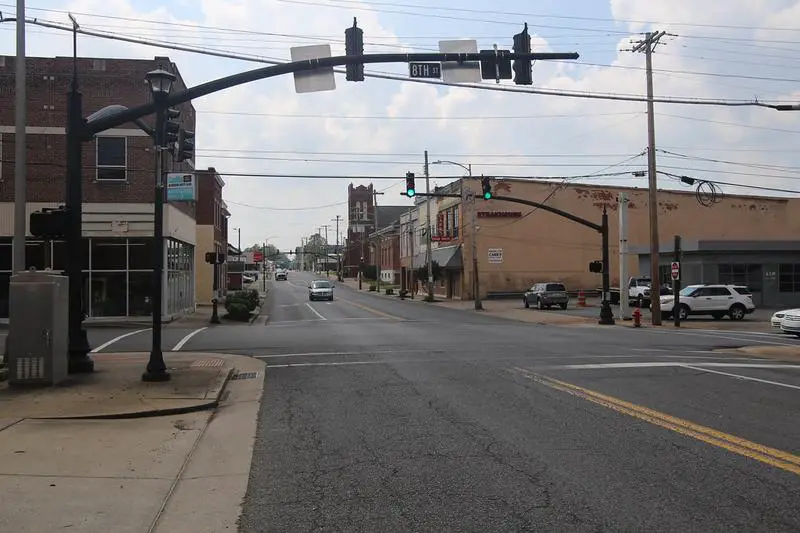
- Shelbyville
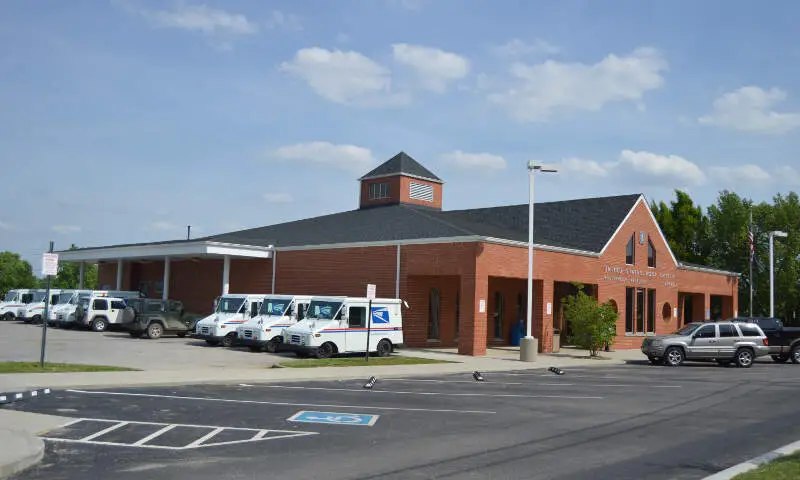
- Vine Grove
So what city is the most diverse in Kentucky? According to the most Census data, Oak Grove took the number one over all spot for diversity in Kentucky.
Read on below to see how we crunched the numbers and how your town ranked. To see where Kentucky ranked as a state, we have a ranking of the most diverse states in Ameria.
For more Kentucky reading:
The 10 Most Diverse Places In Kentucky For 2026

/10
Population: 7,962
HHI: 3,636
% White: 54.2%
% African American: 20.3%
% Hispanic: 14.4%
% Asian: 1.6%
More on Oak Grove: Data | Crime | Cost Of Living | Movers

/10
Population: 22,864
HHI: 4,051
% White: 58.4%
% African American: 22.6%
% Hispanic: 9.7%
% Asian: 3.3%
More on Radcliff: Data | Crime | Cost Of Living | Movers

/10
Population: 631,818
HHI: 4,147
% White: 59.4%
% African American: 22.1%
% Hispanic: 9.5%
% Asian: 2.9%
More on Louisville/jefferson County Metro Government (Balance): Movers

/10
Population: 30,906
HHI: 4,178
% White: 58.2%
% African American: 26.1%
% Hispanic: 5.0%
% Asian: 1.1%
More on Hopkinsville: Data | Crime | Cost Of Living | Movers

/10
Population: 75,388
HHI: 4,246
% White: 62.1%
% African American: 14.1%
% Hispanic: 10.6%
% Asian: 7.7%
More on Bowling Green: Data | Crime | Cost Of Living | Movers

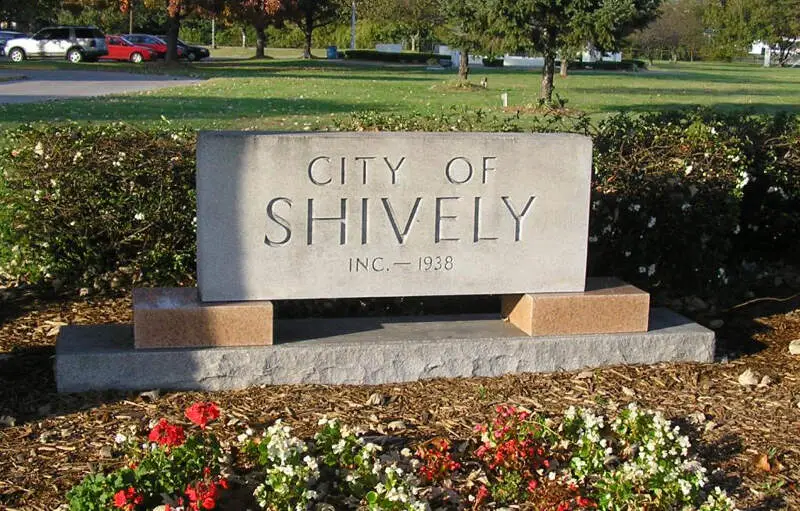
/10
Population: 15,638
HHI: 4,609
% White: 34.6%
% African American: 58.2%
% Hispanic: 2.7%
% Asian: 0.1%
More on Shively: Data | Crime | Cost Of Living | Movers

/10
Population: 9,868
HHI: 4,742
% White: 65.3%
% African American: 12.3%
% Hispanic: 17.4%
% Asian: 0.6%
More on Mayfield: Data | Crime | Cost Of Living | Movers

/10
Population: 323,725
HHI: 4,793
% White: 66.7%
% African American: 14.4%
% Hispanic: 9.5%
% Asian: 4.3%
More on Lexington-Fayette Urban County: Movers

/10
Population: 17,668
HHI: 4,950
% White: 67.1%
% African American: 5.6%
% Hispanic: 19.3%
% Asian: 0.8%
More on Shelbyville: Data | Crime | Cost Of Living | Movers

/10
Population: 6,830
HHI: 5,104
% White: 69.4%
% African American: 13.5%
% Hispanic: 5.7%
% Asian: 3.9%
More on Vine Grove: Data | Crime | Cost Of Living | Movers
Methodology: How we determined the most diverse cities in Kentucky for 2026
We still believe in the accuracy of data — especially from the Census — and Saturday Night Science. So that’s where we went to get the race breakdown across Kentucky.
That leads us to the Census’s most recently available data, the 2020-2024 American Community Survey data from the US Census.
Specifically, we looked at table B03002: HISPANIC OR LATINO ORIGIN BY RACE. Here are the category names as defined by the Census:
- White alone*
- Black or African American alone*
- American Indian and Alaska Native alone*
- Asian alone*
- Native Hawaiian and Other Pacific Islander alone*
- Some other race alone*
- Two or more races*
- Hispanic or Latino
We limited our analysis to non-CDPs with a population greater than 5,000 people. That left us with 80 cities.
We then calculated the HHI for each city by finding the racial breakdown of a city in percent terms, squaring them, and then adding the squares together. This left us with scores ranging from 3,636 (Oak Grove) to 9,165 (Edgewood).
Finally, we ranked each city based on the HHI, with a lower score being more diverse than a high score. Oak Grove took the distinction of being the most diverse, while Edgewood was the least diverse city.
We updated this article for 2026. This report is our eleventh time ranking the most diverse places in Kentucky.
Summary: Diversity Across Kentucky
If you’re looking for a scientific breakdown of diversity across Kentucky, this is an accurate list.
The most diverse cities in Kentucky are Oak Grove, Radcliff, Louisville/Jefferson County metro government (balance), Hopkinsville, Bowling Green, Shively, Mayfield, Lexington-Fayette urban county, Shelbyville, and Vine Grove.
If you’re curious enough, here are the least diverse places in Kentucky:
- Edgewood
- Taylor Mill
- Flatwoods
For more Kentucky reading, check out:
- Best Places To Live In Kentucky
- Cheapest Places To Live In Kentucky
- Most Dangerous Cities In Kentucky
- Best Places To Raise A Family In Kentucky
- Safest Places In Kentucky
- Worst Places To Live In Kentucky
Race By City In Kentucky For 2026
| Rank | City | Population | HHI | % White | % Black | % Hispanic | % Asian |
|---|---|---|---|---|---|---|---|
| 1 | Oak Grove, KY | 7,962 | 3,636 | 54.2% | 20.3% | 14.4% | 1.6% |
| 2 | Radcliff, KY | 22,864 | 4,051 | 58.4% | 22.6% | 9.7% | 3.3% |
| 3 | Louisville/jefferson County Metro Government (Balance), KY | 631,818 | 4,147 | 59.4% | 22.1% | 9.5% | 2.9% |
| 4 | Hopkinsville, KY | 30,906 | 4,178 | 58.2% | 26.1% | 5.0% | 1.1% |
| 5 | Bowling Green, KY | 75,388 | 4,246 | 62.1% | 14.1% | 10.6% | 7.7% |
| 6 | Shively, KY | 15,638 | 4,609 | 34.6% | 58.2% | 2.7% | 0.1% |
| 7 | Mayfield, KY | 9,868 | 4,742 | 65.3% | 12.3% | 17.4% | 0.6% |
| 8 | Lexington-Fayette Urban County, KY | 323,725 | 4,793 | 66.7% | 14.4% | 9.5% | 4.3% |
| 9 | Shelbyville, KY | 17,668 | 4,950 | 67.1% | 5.6% | 19.3% | 0.8% |
| 10 | Vine Grove, KY | 6,830 | 5,104 | 69.4% | 13.5% | 5.7% | 3.9% |
| 11 | Paducah, KY | 26,845 | 5,268 | 69.7% | 19.2% | 3.1% | 1.4% |
| 12 | Lebanon, KY | 6,430 | 5,374 | 70.4% | 17.9% | 9.7% | 0.6% |
| 13 | Hillview, KY | 8,797 | 5,452 | 72.4% | 6.8% | 11.5% | 3.1% |
| 14 | Frankfort, KY | 28,503 | 5,456 | 72.0% | 14.2% | 6.4% | 2.3% |
| 15 | Jeffersontown, KY | 29,199 | 5,532 | 72.6% | 13.9% | 6.1% | 3.3% |
| 16 | Lyndon, KY | 11,030 | 5,609 | 73.2% | 14.0% | 3.9% | 2.9% |
| 17 | Elizabethtown, KY | 32,576 | 5,723 | 74.3% | 11.5% | 5.6% | 3.1% |
| 18 | Middletown, KY | 9,763 | 5,805 | 75.0% | 7.1% | 7.4% | 7.9% |
| 19 | Covington, KY | 41,110 | 5,838 | 75.2% | 8.4% | 8.7% | 1.0% |
| 20 | Versailles, KY | 10,492 | 6,053 | 76.5% | 5.8% | 11.8% | 0.5% |
| 21 | Florence, KY | 32,803 | 6,084 | 77.0% | 6.7% | 9.2% | 3.4% |
| 22 | Madisonville, KY | 19,515 | 6,193 | 77.7% | 10.0% | 4.8% | 1.1% |
| 23 | Henderson, KY | 27,852 | 6,279 | 78.0% | 12.3% | 5.1% | 0.6% |
| 24 | Danville, KY | 17,327 | 6,297 | 78.3% | 10.2% | 6.2% | 0.4% |
| 25 | Bardstown, KY | 13,804 | 6,319 | 78.0% | 13.8% | 6.0% | 0.3% |
| 26 | Owensboro, KY | 60,302 | 6,353 | 79.0% | 6.3% | 5.6% | 2.7% |
| 27 | Glasgow, KY | 15,197 | 6,376 | 79.0% | 7.7% | 7.5% | 1.0% |
| 28 | Paris, KY | 10,160 | 6,443 | 79.4% | 8.6% | 6.2% | 0.2% |
| 29 | Elsmere, KY | 9,205 | 6,519 | 80.1% | 3.3% | 6.3% | 2.7% |
| 30 | Russellville, KY | 7,316 | 6,545 | 80.0% | 9.7% | 6.0% | 0.4% |
| 31 | Franklin, KY | 10,360 | 6,637 | 80.6% | 8.6% | 3.5% | 0.2% |
| 32 | Erlanger, KY | 19,875 | 6,698 | 81.3% | 6.0% | 4.8% | 1.3% |
| 33 | Campbellsville, KY | 11,622 | 6,715 | 81.1% | 9.7% | 2.9% | 0.9% |
| 34 | Douglass Hills, KY | 5,474 | 6,729 | 81.4% | 7.3% | 3.0% | 2.8% |
| 35 | Murray, KY | 18,080 | 6,734 | 81.6% | 6.9% | 3.4% | 3.6% |
| 36 | Georgetown, KY | 39,117 | 6,735 | 81.4% | 5.9% | 7.0% | 0.9% |
| 37 | Harrodsburg, KY | 9,313 | 6,747 | 81.4% | 7.6% | 6.5% | 0.1% |
| 38 | Princeton, KY | 6,241 | 6,922 | 82.3% | 11.7% | 1.2% | 0.0% |
| 39 | Monticello, KY | 5,753 | 6,923 | 82.2% | 3.7% | 12.1% | 0.1% |
| 40 | Nicholasville, KY | 32,197 | 7,041 | 83.5% | 4.9% | 5.6% | 2.2% |
| 41 | Richmond, KY | 37,111 | 7,047 | 83.5% | 5.8% | 4.2% | 1.4% |
| 42 | Newport, KY | 13,967 | 7,131 | 83.9% | 6.0% | 6.6% | 0.3% |
| 43 | Maysville, KY | 8,737 | 7,166 | 84.1% | 7.6% | 3.7% | 0.1% |
| 44 | Fort Wright, KY | 5,887 | 7,227 | 84.5% | 1.7% | 5.9% | 0.2% |
| 45 | Winchester, KY | 19,213 | 7,253 | 84.8% | 4.7% | 4.4% | 1.3% |
| 46 | St. Matthews, KY | 17,577 | 7,375 | 85.6% | 4.1% | 3.5% | 2.3% |
| 47 | Somerset, KY | 12,216 | 7,438 | 85.9% | 3.3% | 5.9% | 0.2% |
| 48 | Fort Mitchell, KY | 8,713 | 7,534 | 86.4% | 4.0% | 5.1% | 0.0% |
| 49 | Central City, KY | 5,707 | 7,563 | 86.6% | 3.9% | 3.4% | 0.4% |
| 50 | Williamsburg, KY | 5,270 | 7,571 | 86.6% | 5.2% | 5.8% | 0.4% |
| 51 | La Grange, KY | 10,311 | 7,631 | 86.9% | 1.9% | 7.9% | 1.0% |
| 52 | Villa Hills, KY | 7,480 | 7,658 | 87.2% | 1.0% | 5.6% | 1.1% |
| 53 | Walton, KY | 5,730 | 7,667 | 87.2% | 0.0% | 2.0% | 0.0% |
| 54 | Berea, KY | 15,786 | 7,725 | 87.6% | 3.0% | 5.2% | 0.7% |
| 55 | Highland Heights, KY | 6,444 | 7,728 | 87.7% | 2.9% | 2.1% | 2.2% |
| 56 | Wilmore, KY | 6,057 | 7,802 | 88.1% | 2.6% | 1.4% | 0.3% |
| 57 | Middlesborough, KY | 9,123 | 7,862 | 88.4% | 5.8% | 1.0% | 0.7% |
| 58 | Hazard, KY | 5,008 | 7,865 | 88.4% | 3.8% | 0.9% | 0.2% |
| 59 | Fort Thomas, KY | 17,169 | 7,912 | 88.8% | 2.3% | 3.0% | 0.6% |
| 60 | Dayton, KY | 5,743 | 7,933 | 88.8% | 1.6% | 2.8% | 0.4% |
| 61 | Crestwood, KY | 6,356 | 8,028 | 89.4% | 1.8% | 4.7% | 0.8% |
| 62 | Union, KY | 7,642 | 8,038 | 89.4% | 0.0% | 3.0% | 1.8% |
| 63 | Pikeville, KY | 7,490 | 8,049 | 89.6% | 3.5% | 1.9% | 2.4% |
| 64 | Cynthiana, KY | 6,458 | 8,151 | 90.1% | 2.9% | 2.1% | 0.0% |
| 65 | Morehead, KY | 6,870 | 8,181 | 90.3% | 3.2% | 2.2% | 2.0% |
| 66 | Lawrenceburg, KY | 11,943 | 8,231 | 90.6% | 4.2% | 2.7% | 0.1% |
| 67 | Mount Sterling, KY | 7,551 | 8,313 | 91.1% | 2.5% | 2.3% | 1.2% |
| 68 | Bellevue, KY | 5,636 | 8,320 | 91.1% | 1.3% | 4.1% | 0.9% |
| 69 | Ashland, KY | 21,295 | 8,339 | 91.2% | 2.0% | 2.7% | 0.4% |
| 70 | Alexandria, KY | 10,562 | 8,350 | 91.3% | 2.5% | 1.1% | 2.6% |
| 71 | Independence, KY | 29,392 | 8,368 | 91.4% | 1.5% | 2.5% | 1.0% |
| 72 | Shepherdsville, KY | 14,533 | 8,554 | 92.4% | 1.5% | 2.4% | 0.1% |
| 73 | Mount Washington, KY | 18,480 | 8,604 | 92.6% | 0.0% | 3.1% | 0.6% |
| 74 | London, KY | 7,561 | 8,733 | 93.4% | 1.0% | 2.6% | 0.9% |
| 75 | Cold Spring, KY | 6,341 | 8,888 | 94.2% | 2.2% | 1.1% | 0.9% |
| 76 | Corbin, KY | 8,246 | 8,970 | 94.7% | 0.9% | 1.3% | 0.1% |
| 77 | Leitchfield, KY | 6,819 | 9,009 | 94.9% | 1.1% | 0.9% | 0.0% |
| 78 | Flatwoods, KY | 7,269 | 9,118 | 95.4% | 0.1% | 1.5% | 0.5% |
| 79 | Taylor Mill, KY | 6,937 | 9,124 | 95.5% | 1.9% | 1.6% | 0.2% |
| 80 | Edgewood, KY | 8,447 | 9,165 | 95.7% | 0.4% | 0.5% | 1.9% |


