Racial diversity in Maryland is a mixed bag.
There are parts of Maryland where there’s a high level of diversity. But where will you find the most diverse places in Maryland?
To answer that question, we went to the US Census data. Using Saturday Night Science, we measured the Gini coefficient for all 44 cities in Maryland to rank them from most to least diverse.
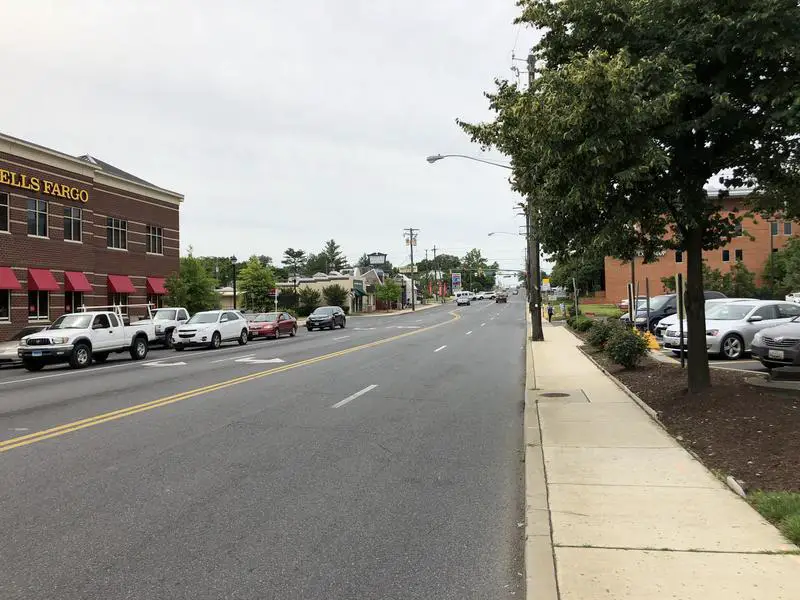
#1 most diverse in Maryland
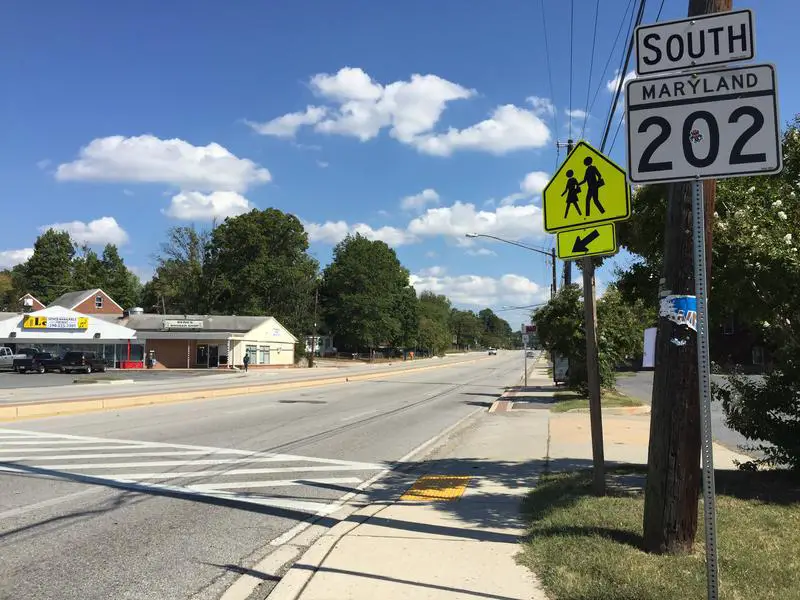
Gaithersburg ), officially the City of Gaithersburg, is a city in Montgomery County, Maryland. At the time of the 2010 U.S. Census, Gaithersburg had a population of 59,933, making it the fourth largest incorporated city in the state, behind Baltimore, Frederick, and Rockville. Gaithersburg is located to the northwest of Washington, D.C., and is considered a suburb and a primary city within the Washington-Arlington-Alexandria, DC-VA-MD-WV Metropolitan Statistical Area. Gaithersburg was incorporated as a town in 1878 and as a city in 1968.
Data | Crime | Cost of living | Movers
#2 most diverse in Maryland
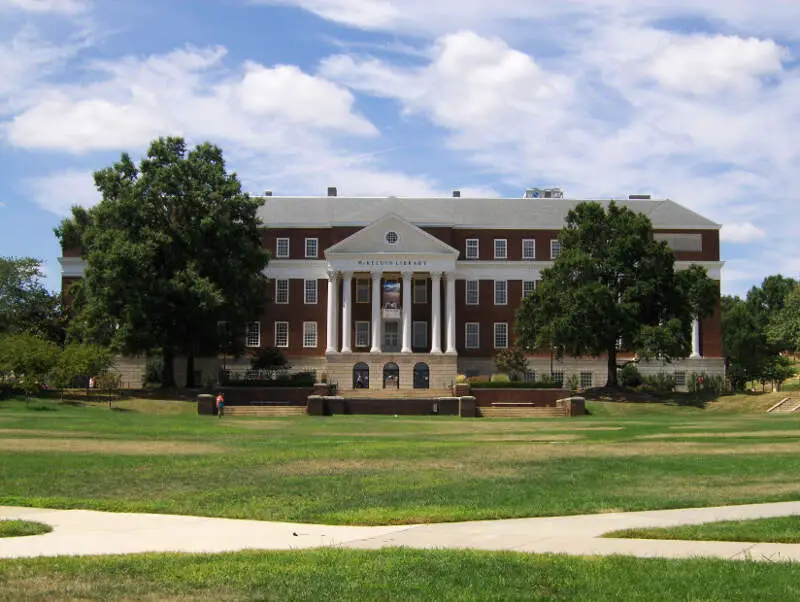
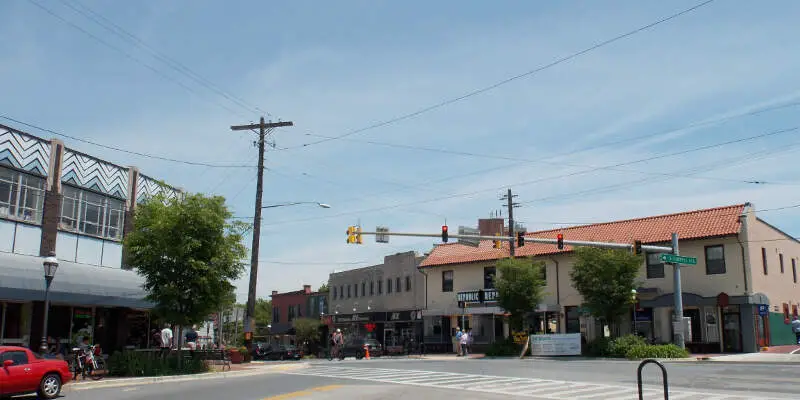
The City of College Park is in Prince George’s County, Maryland. The population was 30,413 at the 2010 United States Census. It is best known as the home of the University of Maryland, College Park, and since 1994 the city has also been home to the “Archives II” facility of the U.S. National Archives, as well as to the National Oceanic and Atmospheric Administration Center for Weather and Climate Prediction.
Data | Crime | Cost of living | Movers
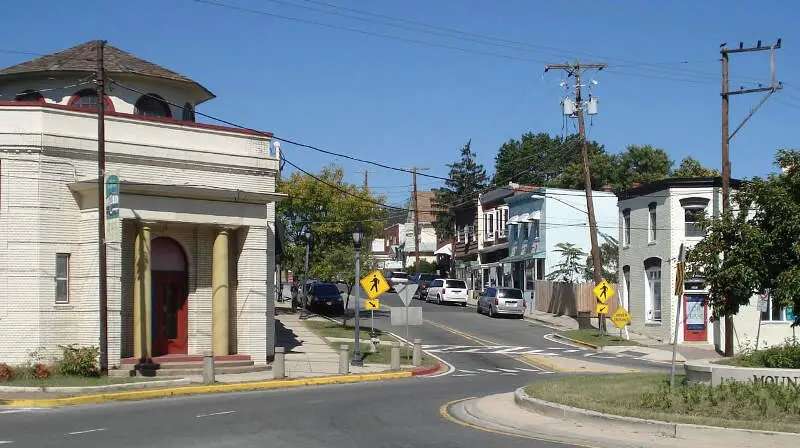
#3 most diverse in Maryland
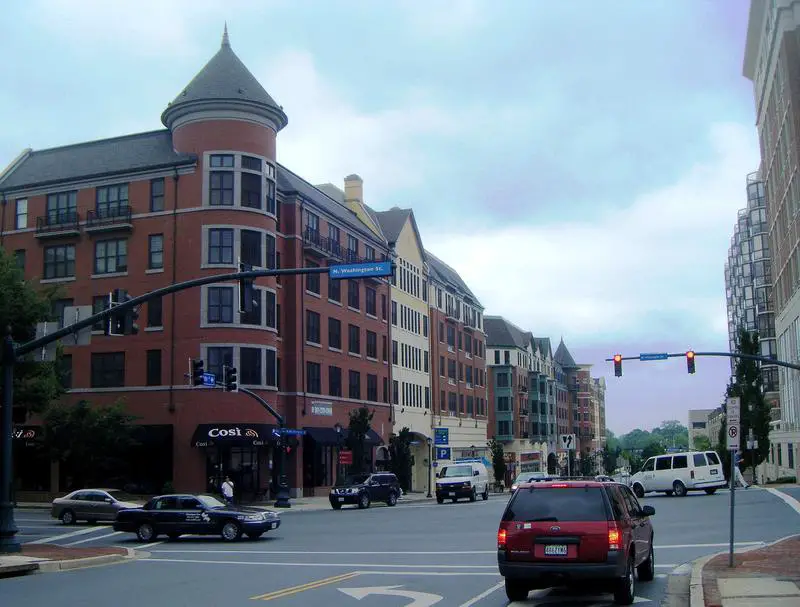
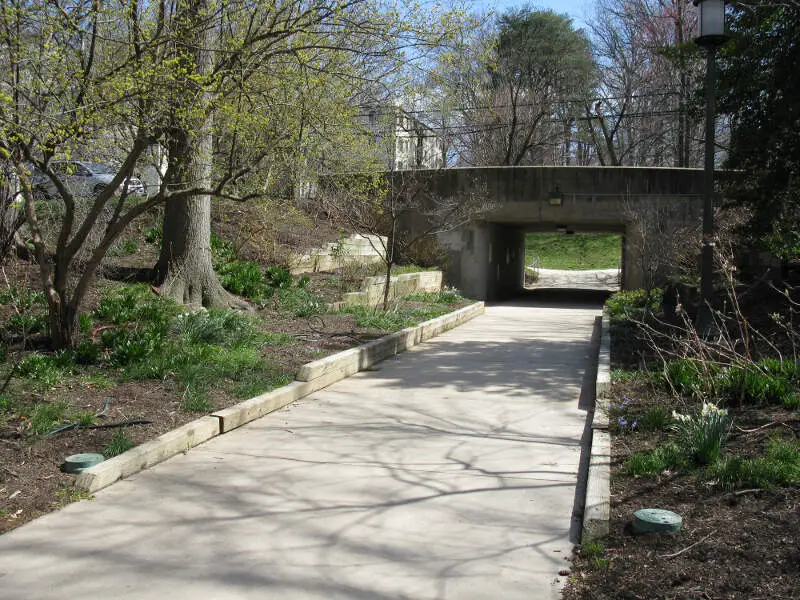
Rockville is a U.S. city located in the central region of Montgomery County, Maryland. It is the county seat and is a major incorporated city of Montgomery County and forms part of the Baltimore-Washington metropolitan area. The 2010 census tabulated Rockville’s population at 61,209, making it the third largest incorporated city in Maryland, behind Baltimore and Frederick. Rockville is the largest incorporated city in Montgomery County, Maryland, although the nearby census-designated place of Germantown is more populous.
Data | Crime | Cost of living | Movers
#4 most diverse in Maryland
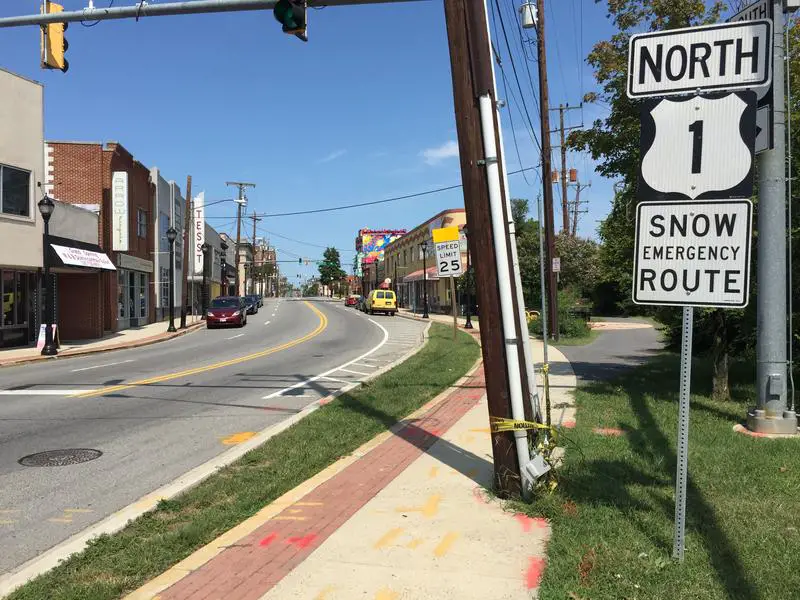
Hyattsville is a city in Prince George’s County, Maryland, and also a close, urban suburb of Washington, D.C. The population was 17,557 at the 2010 United States Census.
Data | Crime | Cost of living | Movers
#5 most diverse in Maryland
Cheverly is a town in Prince George’s County, Maryland, just outside Washington, D.C., United States. The town was founded in 1918, and it was incorporated in 1931. Cheverly had 6,173 residents as of the 2010 Census.
Data | Crime | Cost of living | Movers
#6 most diverse in Maryland
Takoma Park is a city in Montgomery County, Maryland. It is a suburb of Washington, D.C., and part of the Washington metropolitan area. Founded in 1883 and incorporated in 1890, Takoma Park, informally called “Azalea City”, is a Tree City USA and a nuclear-free zone. A planned commuter suburb, it is situated along the Metropolitan Branch of the historic Baltimore and Ohio Railroad, just northeast of Washington, D.C., and it borders the neighborhood of Takoma, Washington, D.C. It is governed by an elected mayor and six elected councilmembers, who form the city council, and an appointed city manager, under a council-manager style of government. The city’s population was 16,715 at the 2010 national census.
Data | Crime | Cost of living | Movers
#7 most diverse in Maryland
Greenbelt is a city in Prince George’s County, Maryland, United States. Contained within today’s City of Greenbelt is the historic planned community now known locally as “Old Greenbelt” and designated as the Greenbelt Historic District. Greenbelt’s population was 23,068 at the 2010 U.S. Census.
Data | Crime | Cost of living | Movers
#8 most diverse in Maryland
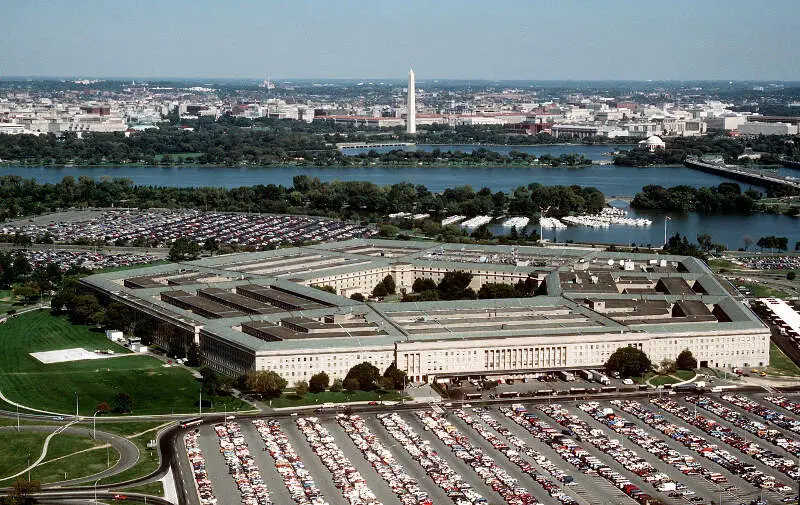
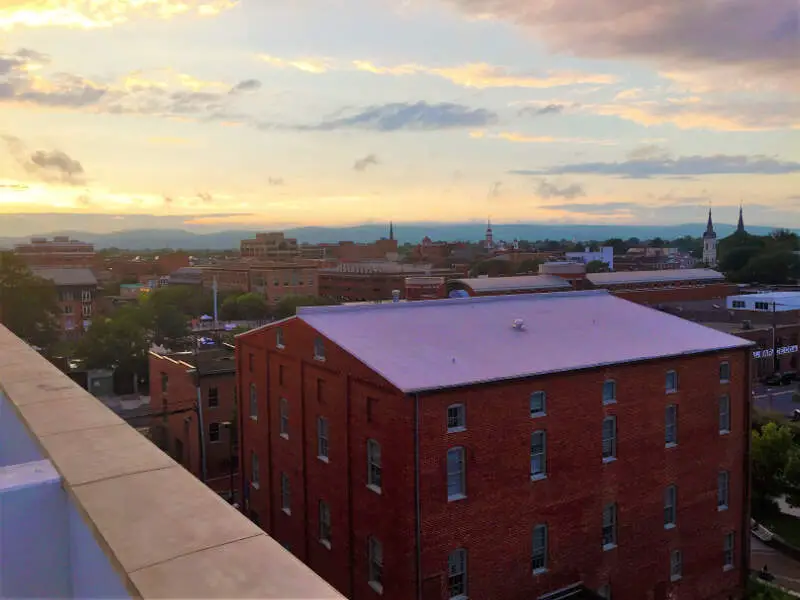
Frederick is a city and the county seat of Frederick County in the U.S. state of Maryland. It is part of the Baltimore-Washington Metropolitan Area. Frederick has long been an important crossroads, located at the intersection of a major north-south Indian trail, and east-west routes to the Chesapeake Bay, both at Baltimore and what became Washington, D.C. and across the Appalachian mountains to the Ohio River watershed. It is a part of the Washington-Arlington-Alexandria, DC-VA-MD-WV Metropolitan Statistical Area, which is part of a greater Washington-Baltimore-Arlington, DC-MD-VA-WV-PA Combined Statistical Area. The city’s population was 65,239 people at the 2010 United States Census, making it the second-largest incorporated city in Maryland, behind Baltimore. Frederick is home to Frederick Municipal Airport, which primarily accommodates general aviation traffic, and to the county’s largest employer U.S. Army’s Fort Detrick bioscience/communications research installation.
Data | Crime | Cost of living | Movers
#9 most diverse in Maryland
Riverdale Park, formerly known and often referred to as Riverdale, Maryland is a semi-urban town in Prince George’s County, Maryland, United States, a suburb in the Washington D.C. metropolitan area. The population was 6,956 as of 2010.
Data | Crime | Cost of living | Movers
#10 most diverse in Maryland
Data | Crime | Cost of living | Movers
The receipts
Compare the top ten
Pick a metric. The bars rescale. The red line is Maryland’s statewide median.
On the map
Where diversity lives in Maryland
Saturday Night Science
Methodology: How we determined the most diverse cities in Maryland for 2026
We still believe in the accuracy of data — especially from the Census — and Saturday Night Science. So that’s where we went to get the race breakdown across Maryland.
That leads us to the Census’s most recently available data, the 2020-2024 American Community Survey data from the US Census.
Specifically, we looked at table B03002: HISPANIC OR LATINO ORIGIN BY RACE. Here are the category names as defined by the Census:
- White alone*
- Black or African American alone*
- American Indian and Alaska Native alone*
- Asian alone*
- Native Hawaiian and Other Pacific Islander alone*
- Some other race alone*
- Two or more races*
- Hispanic or Latino
We limited our analysis to non-CDPs with a population greater than 5,000 people. That left us with 44 cities.
We then calculated the HHI for each city by finding the racial breakdown of a city in percent terms, squaring them, and then adding the squares together. This left us with scores ranging from 2,455 (Gaithersburg) to 8,041 (Thurmont).
Finally, we ranked each city based on the HHI, with a lower score being more diverse than a high score. Gaithersburg took the distinction of being the most diverse, while Thurmont was the least diverse city.
We updated this article for 2026. This report is our eleventh time ranking the most diverse places in Maryland.
The full plate
Race By City In Maryland For 2026
Click any column to sort. Search by city name.
| Rank | City | Population | HHI | % White | % Black | % Hispanic | % Asian |
|---|---|---|---|---|---|---|---|
| 1 | Gaithersburg | 69,825 | 2,455 | 29.7% | 14.6% | 30.5% | 20.3% |
| 2 | College Park | 34,540 | 2,532 | 37.2% | 23.6% | 17.7% | 15.8% |
| 3 | Rockville | 67,671 | 2,828 | 43.2% | 11.0% | 18.1% | 22.1% |
| 4 | Hyattsville | 20,966 | 2,841 | 28.4% | 24.3% | 37.5% | 5.1% |
| 5 | Cheverly | 6,096 | 2,968 | 24.0% | 44.7% | 16.9% | 4.1% |
| 6 | Takoma Park | 17,632 | 3,105 | 44.6% | 29.2% | 14.1% | 4.7% |
| 7 | Greenbelt | 24,678 | 3,113 | 19.0% | 47.9% | 19.2% | 7.7% |
| 8 | Frederick | 83,395 | 3,290 | 50.1% | 17.0% | 20.5% | 5.8% |
| 9 | Riverdale Park | 7,270 | 3,355 | 16.7% | 24.6% | 49.2% | 3.9% |
| 10 | Mount Rainier | 8,245 | 3,412 | 18.4% | 43.2% | 34.7% | 1.2% |
| 11 | Salisbury | 33,285 | 3,437 | 40.9% | 40.5% | 7.8% | 2.2% |
| 12 | Laurel | 29,798 | 3,464 | 12.1% | 52.3% | 22.2% | 8.2% |
| 13 | Aberdeen | 17,298 | 3,496 | 50.0% | 28.9% | 11.0% | 2.0% |
| 14 | Cambridge | 13,152 | 3,525 | 38.7% | 43.7% | 7.6% | 2.1% |
| 15 | Fruitland | 5,801 | 3,541 | 49.9% | 28.8% | 13.3% | 2.2% |
| 16 | La Plata | 10,683 | 3,573 | 46.7% | 35.8% | 6.2% | 3.3% |
| 17 | Bowie | 57,926 | 3,694 | 26.5% | 53.4% | 10.0% | 3.3% |
| 18 | Hagerstown | 43,665 | 3,867 | 56.6% | 21.0% | 12.2% | 1.4% |
| 19 | Annapolis | 40,720 | 3,940 | 57.3% | 20.2% | 14.8% | 3.0% |
| 20 | Baltimore | 573,243 | 4,190 | 26.0% | 58.5% | 8.2% | 2.6% |
| 21 | Elkton | 15,910 | 4,193 | 61.4% | 16.6% | 7.8% | 2.6% |
| 22 | New Carrollton | 13,564 | 4,289 | 4.5% | 55.9% | 33.4% | 1.6% |
| 23 | Easton | 17,308 | 4,606 | 64.3% | 15.7% | 14.6% | 2.1% |
| 24 | Bladensburg | 9,583 | 4,646 | 0.6% | 53.6% | 41.9% | 0.7% |
| 25 | Berlin | 5,232 | 4,812 | 65.5% | 20.7% | 4.0% | 0.5% |
| 26 | Havre de Grace | 14,994 | 4,903 | 66.9% | 19.0% | 5.6% | 2.4% |
| 27 | Brunswick | 8,450 | 4,949 | 68.2% | 8.4% | 12.3% | 2.8% |
| 28 | Walkersville | 6,414 | 5,168 | 69.9% | 7.5% | 13.5% | 4.6% |
| 29 | Cheste | 5,594 | 5,312 | 69.3% | 22.1% | 3.4% | 2.6% |
| 30 | Poolesville | 5,764 | 5,523 | 72.9% | 2.1% | 8.7% | 8.0% |
| 31 | Chesapeake Beach | 6,456 | 5,526 | 72.8% | 7.6% | 3.2% | 4.2% |
| 32 | Bel Air | 10,585 | 5,761 | 74.8% | 4.3% | 9.9% | 4.8% |
| 33 | Glenarden | 6,344 | 5,795 | 1.8% | 73.4% | 19.8% | 0.5% |
| 34 | Westminster | 20,445 | 5,834 | 75.3% | 8.0% | 8.8% | 4.0% |
| 35 | Frostburg | 6,977 | 6,675 | 80.8% | 11.5% | 2.0% | 3.2% |
| 36 | District Heights | 5,891 | 6,908 | 3.3% | 82.3% | 10.9% | 0.1% |
| 37 | Taneytown | 7,932 | 7,014 | 83.1% | 9.2% | 3.7% | 0.4% |
| 38 | Ocean City | 6,903 | 7,157 | 84.0% | 1.6% | 9.5% | 1.7% |
| 39 | Mount Airy | 9,805 | 7,217 | 84.5% | 2.6% | 7.6% | 0.9% |
| 40 | Manchester | 5,439 | 7,298 | 85.1% | 2.0% | 3.1% | 4.3% |
| 41 | Cumberland | 18,804 | 7,350 | 85.3% | 4.1% | 2.4% | 0.7% |
| 42 | Middl | 5,014 | 7,412 | 85.7% | 1.1% | 4.1% | 5.5% |
| 43 | Hampstead | 6,251 | 7,597 | 86.9% | 3.3% | 1.4% | 4.1% |
| 44 | Thurmont | 6,254 | 8,041 | 89.4% | 1.3% | 5.9% | 0.0% |
Source: U.S. Census ACS 2020-2024. 44 cities with more than 5,000 residents.
Summary
Summary: Diversity Across Maryland
If you’re looking for a scientific breakdown of diversity across Maryland, this is an accurate list.
The most diverse cities in Maryland are Gaithersburg, College Park, Rockville, Hyattsville, Cheverly, Takoma Park, Greenbelt, Frederick, Riverdale Park, and Mount Rainier. Not sold on Maryland? Take the two-minute Find Your Place quiz and see which state actually fits you.
Questions and answers
Most Diverse Cities In Maryland FAQs
What is the most diverse city in Maryland?
Gaithersburg is the most diverse city in Maryland for 2026, posting the lowest diversity index (2,455) of the 44 places we measured. College Park and Rockville are next.
What are the 10 most diverse cities in Maryland?
The ten most diverse cities in Maryland are Gaithersburg, College Park, Rockville, Hyattsville, Cheverly, Takoma Park, Greenbelt, Frederick, Riverdale Park, and Mount Rainier. We ranked all 44 places with more than 5,000 residents by their racial-diversity HHI.
How do you measure diversity?
We use a Herfindahl-Hirschman Index (HHI) across each city’s White, Black, Hispanic, and Asian population shares from the Census American Community Survey. A lower score means the mix is more even, so the lowest HHI wins.
What is the least diverse city in Maryland?
Thurmont is the least diverse city in Maryland, with a diversity index of 8,041. That means one group makes up most of its population.
Where does this data come from?
All population shares come from the Census Bureau’s American Community Survey (2020-2024). Diversity scores in Maryland range from 2,455 in Gaithersburg to 8,041 in Thurmont.


