Racial diversity in Mississippi is a mixed bag.
There are parts of Mississippi where there’s a high level of diversity. But where will you find the most diverse places in Mississippi?
To answer that question, we went to the US Census data. Using Saturday Night Science, we measured the Gini coefficient for all 61 cities in Mississippi to rank them from most to least diverse.
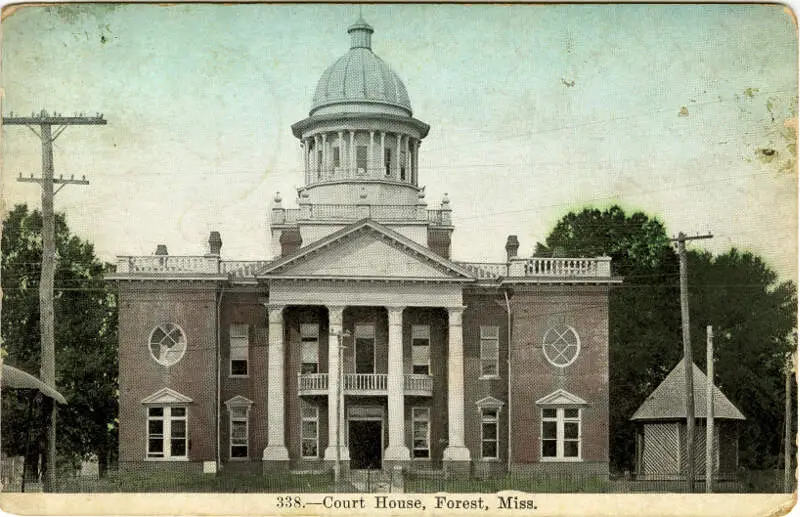
#1 most diverse in Mississippi
Data | Crime | Cost of living | Movers
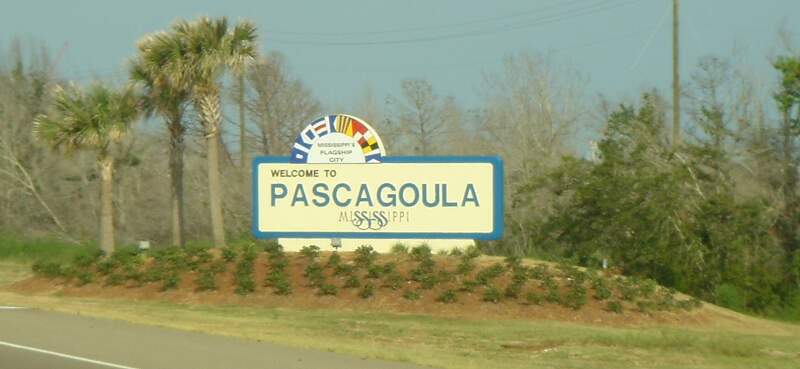
#2 most diverse in Mississippi
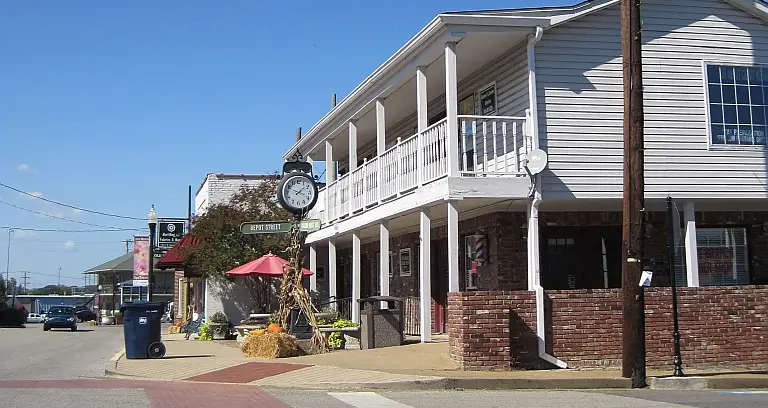
Pascagoula is a city in Jackson County, Mississippi, United States. It is the principal city of the Pascagoula, Mississippi Metropolitan Statistical Area, as a part of the Gulfport-Biloxi-Pascagoula, Mississippi Combined Statistical Area. The population was 26,200 at the 2000 census. It is the county seat of Jackson County.
Data | Crime | Cost of living | Movers
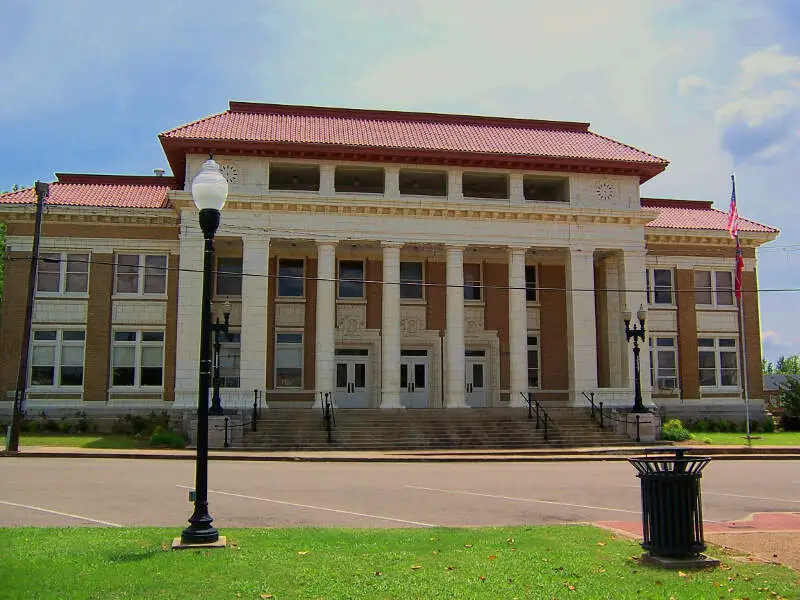
#3 most diverse in Mississippi
Pontotoc is a city in, and the county seat of, Pontotoc County, Mississippi, located to the west of the much larger city of Tupelo. The population was 5,625 at the 2010 census.
Data | Crime | Cost of living | Movers
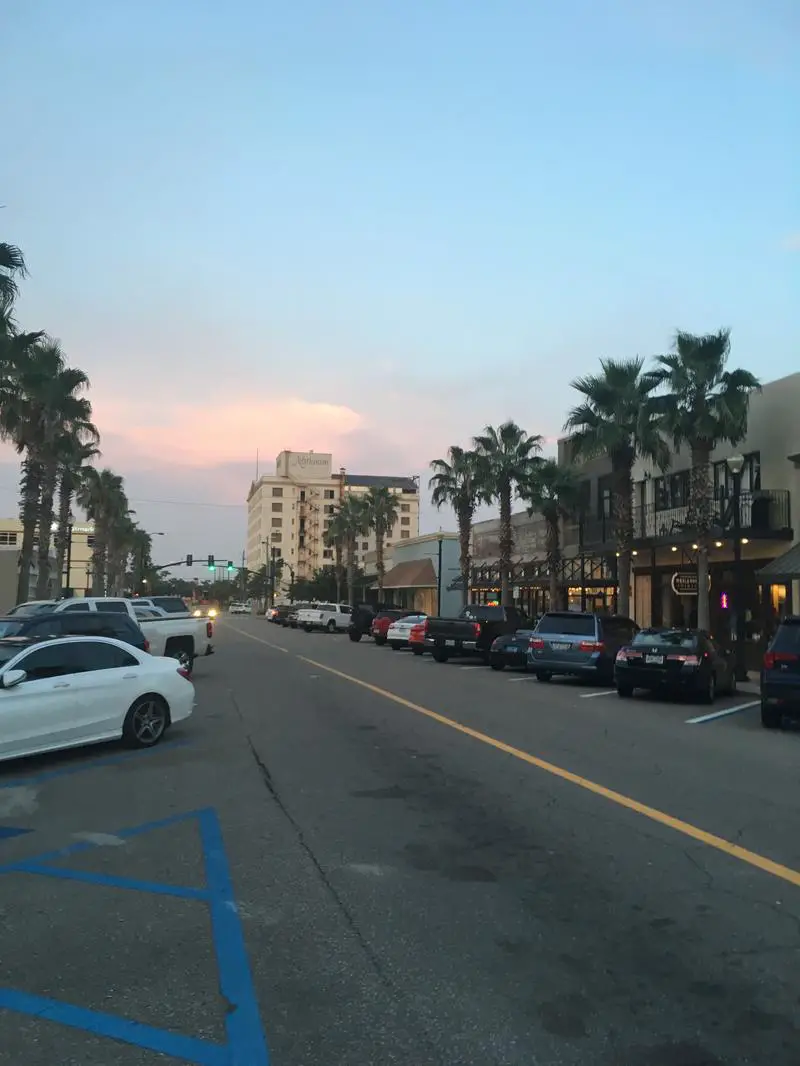
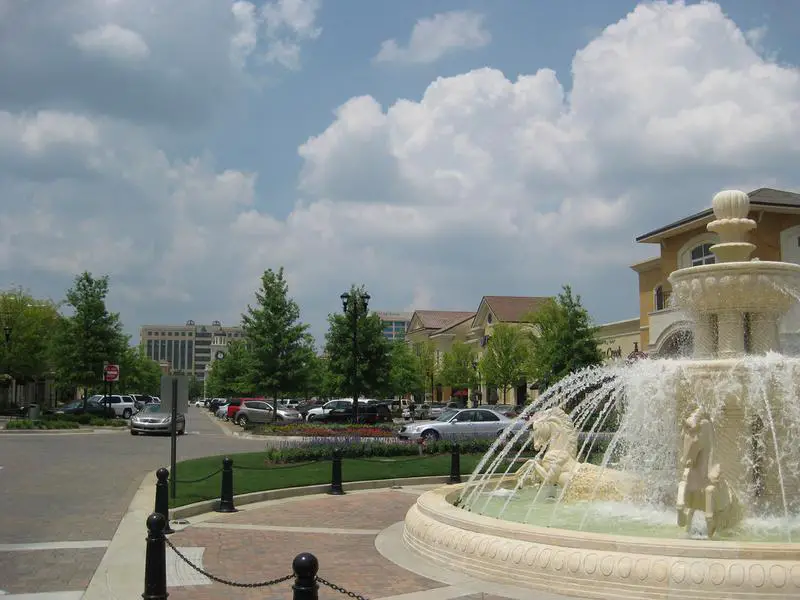
#4 most diverse in Mississippi
Gulfport is the second largest city in Mississippi after the state capital, Jackson. It is the larger of the two principal cities of the Gulfport-Biloxi, Mississippi Metropolitan Statistical Area, which is included in the Gulfport-Biloxi-Pascagoula, Mississippi Combined Statistical Area. As of the 2010 census, the city of Gulfport had a total population of 67,793. Gulfport is co-county seat with Biloxi of Harrison County, Mississippi. Gulfport is also home to the US Navy Atlantic Fleet Seabees.
Data | Crime | Cost of living | Movers
#5 most diverse in Mississippi
Ridgeland is a city in Madison County, Mississippi. The population was 24,047 at the 2010 census. It is part of the Jackson Metropolitan Statistical Area.
Data | Crime | Cost of living | Movers
#6 most diverse in Mississippi
Gautier is a city in Jackson County, Mississippi, along the Gulf of Mexico west of Pascagoula. It is part of the Pascagoula Metropolitan Statistical Area. The population was 18,572 at the 2010 census. In 2002, Gautier annexed land nearly doubling its population to 18,413 by 2010, according to the Gautier Comprehensive Plan 2030.
Data | Crime | Cost of living | Movers
#7 most diverse in Mississippi
Data | Crime | Cost of living | Movers
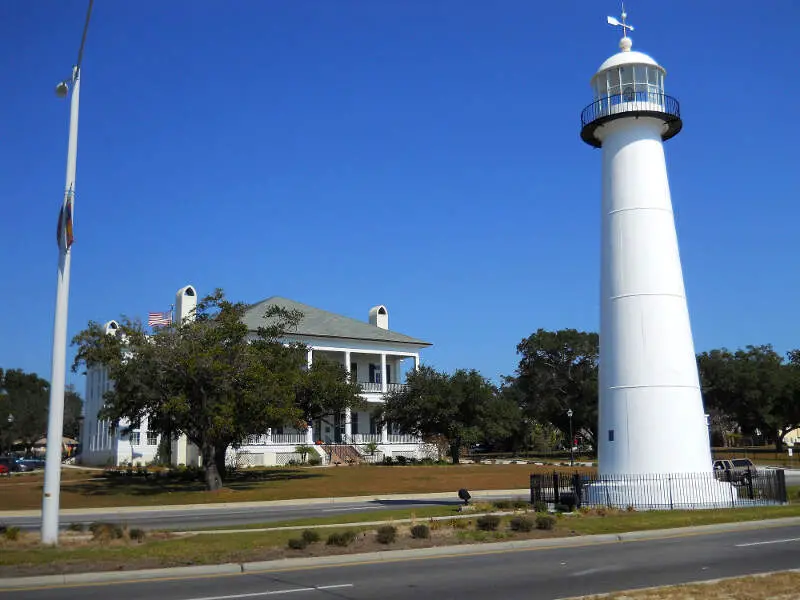
#8 most diverse in Mississippi
Biloxi is a city in Harrison County, Mississippi, United States. The 2010 United States Census recorded the population as 44,054, and in 2016 the estimated population was 45,975. Along with the adjoining city of Gulfport, Biloxi is a county seat of Harrison County. It was first settled by French colonists.
Data | Crime | Cost of living | Movers
#9 most diverse in Mississippi
Olive Branch is a city in DeSoto County, Mississippi, United States. The population was 33,484 at the 2010 census, up from 21,054 in 2000. Olive Branch is a suburb of Memphis, Tennessee, and is part of the Memphis Metropolitan Statistical Area, a region that consists of three counties in southwest Tennessee, five counties in northwest Mississippi, and two counties in eastern Arkansas. From 1990 to 2010 Olive Branch was the fastest growing city in the United States, with a growth rate of 838%. Along with other rapidly growing suburbs in DeSoto County, Olive Branch attributes most of its growth and development to the exodus of large numbers of middle-class families from central Memphis.
Data | Crime | Cost of living | Movers
#10 most diverse in Mississippi
Starkville is a city in and the county seat of Oktibbeha County, Mississippi, United States. The Starkville Micropolitan Statistical Area includes all of Oktibbeha County. The population was 23,888 at the 2010 census.
Data | Crime | Cost of living | Movers
The receipts
Compare the top ten
Pick a metric. The bars rescale. The red line is Mississippi’s statewide median.
On the map
Where diversity lives in Mississippi
Saturday Night Science
Methodology: How we determined the most diverse cities in Mississippi for 2026
We still believe in the accuracy of data — especially from the Census — and Saturday Night Science. So that’s where we went to get the race breakdown across Mississippi.
That leads us to the Census’s most recently available data, the 2020-2024 American Community Survey data from the US Census.
Specifically, we looked at table B03002: HISPANIC OR LATINO ORIGIN BY RACE. Here are the category names as defined by the Census:
- White alone*
- Black or African American alone*
- American Indian and Alaska Native alone*
- Asian alone*
- Native Hawaiian and Other Pacific Islander alone*
- Some other race alone*
- Two or more races*
- Hispanic or Latino
We limited our analysis to non-CDPs with a population greater than 5,000 people. That left us with 61 cities.
We then calculated the HHI for each city by finding the racial breakdown of a city in percent terms, squaring them, and then adding the squares together. This left us with scores ranging from 3,224 (Forest) to 7,939 (Yazoo City).
Finally, we ranked each city based on the HHI, with a lower score being more diverse than a high score. Forest took the distinction of being the most diverse, while Yazoo City was the least diverse city.
We updated this article for 2026. This report is our eleventh time ranking the most diverse places in Mississippi.
The full plate
Race By City In Mississippi For 2026
Click any column to sort. Search by city name.
| Rank | City | Population | HHI | % White | % Black | % Hispanic | % Asian |
|---|---|---|---|---|---|---|---|
| 1 | Forest | 5,357 | 3,224 | 23.0% | 37.3% | 36.0% | 0.1% |
| 2 | Pascagoula | 21,710 | 3,642 | 48.0% | 34.1% | 12.6% | 1.2% |
| 3 | Pontotoc | 5,806 | 3,704 | 53.9% | 22.9% | 15.2% | 0.0% |
| 4 | Gulfport | 73,003 | 3,720 | 47.3% | 37.3% | 6.8% | 1.7% |
| 5 | Ridgeland | 24,587 | 3,816 | 40.1% | 46.4% | 6.5% | 3.5% |
| 6 | Gautier | 19,046 | 3,819 | 53.1% | 29.5% | 10.3% | 1.5% |
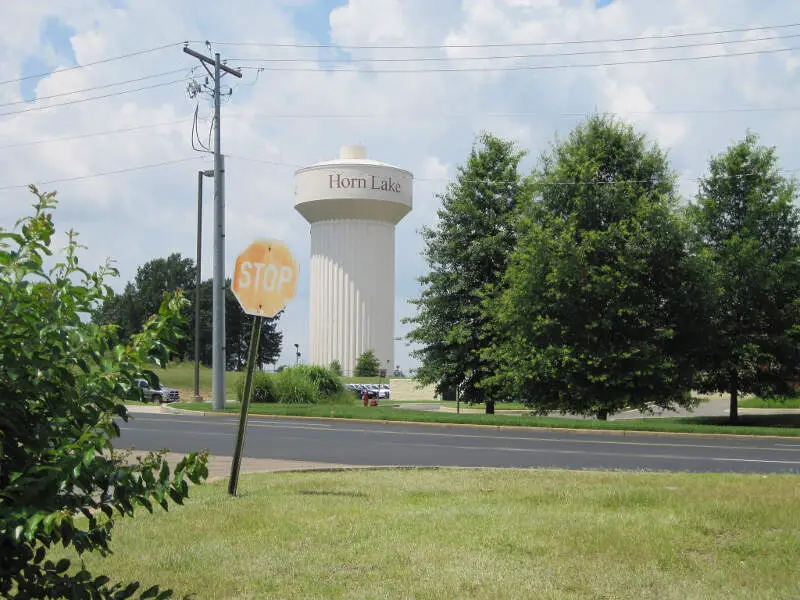
| 7 | Horn Lake | 26,647 | 3,872 | 35.7% | 50.0% | 9.2% | 0.8% |
| 8 | Biloxi | 48,861 | 4,046 | 59.4% | 18.4% | 10.8% | 3.6% |
| 9 | Olive Branch | 47,019 | 4,105 | 52.7% | 35.7% | 6.3% | 2.1% |
| 10 | Starkville | 25,721 | 4,114 | 52.7% | 36.0% | 3.8% | 4.6% |
| 11 | Clinton | 27,195 | 4,130 | 47.3% | 43.1% | 2.1% | 4.6% |
| 12 | Hattiesburg | 48,619 | 4,152 | 39.5% | 50.5% | 5.1% | 0.7% |
| 13 | Tupelo | 37,791 | 4,154 | 51.9% | 37.8% | 4.7% | 1.7% |
| 14 | Southaven | 56,226 | 4,158 | 50.7% | 39.3% | 5.3% | 1.2% |
| 15 | D’Iberville | 13,203 | 4,211 | 60.8% | 19.1% | 8.1% | 8.0% |
| 16 | Picayune | 11,900 | 4,237 | 52.1% | 38.5% | 5.1% | 0.0% |
| 17 | Pearl | 27,737 | 4,264 | 57.9% | 29.1% | 6.4% | 2.5% |
| 18 | Cleveland | 10,623 | 4,322 | 41.3% | 51.0% | 2.8% | 2.1% |
| 19 | New Albany | 7,663 | 4,437 | 60.2% | 27.3% | 7.7% | 0.6% |
| 20 | Philadelphia | 6,996 | 4,465 | 42.3% | 51.6% | 0.8% | 0.4% |
| 21 | Senatobia | 8,380 | 4,478 | 53.2% | 40.3% | 2.5% | 0.2% |
| 22 | Meridian | 34,137 | 4,514 | 30.3% | 59.7% | 2.3% | 1.2% |
| 23 | Laurel | 17,679 | 4,670 | 28.7% | 61.3% | 9.1% | 0.2% |
| 24 | Ripley | 5,377 | 4,743 | 65.5% | 16.4% | 12.1% | 0.0% |
| 25 | Brookhaven | 11,650 | 4,798 | 41.7% | 55.3% | 1.5% | 0.7% |
| 26 | Columbia | 6,632 | 4,838 | 59.6% | 35.8% | 1.7% | 0.0% |
| 27 | Oxford | 26,411 | 4,868 | 64.7% | 25.5% | 4.0% | 2.8% |
| 28 | Batesville | 7,387 | 4,870 | 42.2% | 55.6% | 1.1% | 0.1% |
| 29 | Grenada | 12,375 | 4,878 | 39.0% | 57.9% | 0.0% | 0.0% |
| 30 | Amory | 6,500 | 4,917 | 64.1% | 28.0% | 2.8% | 0.1% |
| 31 | Kosciusko | 6,933 | 4,962 | 38.9% | 58.7% | 1.4% | 0.0% |
| 32 | Columbus | 23,348 | 5,034 | 29.7% | 64.4% | 2.0% | 1.6% |
| 33 | Natchez | 14,192 | 5,067 | 34.5% | 62.2% | 0.4% | 0.0% |
| 34 | Louisville | 5,983 | 5,076 | 37.9% | 60.3% | 0.2% | 0.3% |
| 35 | Corinth | 14,323 | 5,137 | 68.5% | 19.5% | 7.0% | 0.9% |
| 36 | Richland | 7,346 | 5,232 | 70.2% | 15.7% | 4.3% | 3.5% |
| 37 | Moss Point | 11,957 | 5,264 | 22.5% | 68.7% | 6.2% | 0.8% |
| 38 | Pass Christian | 6,097 | 5,363 | 70.5% | 19.1% | 2.8% | 2.7% |
| 39 | Flowood | 10,587 | 5,373 | 71.0% | 17.0% | 3.9% | 3.7% |
| 40 | Booneville | 9,246 | 5,407 | 70.2% | 21.3% | 2.1% | 1.0% |
| 41 | West Point | 9,900 | 5,485 | 31.0% | 67.3% | 0.1% | 0.1% |
| 42 | Greenwood | 14,086 | 5,530 | 25.6% | 69.8% | 3.3% | 0.4% |
| 43 | Brandon | 25,542 | 5,565 | 69.5% | 27.1% | 1.7% | 0.4% |
| 44 | Petal | 11,294 | 5,601 | 72.8% | 16.1% | 5.5% | 1.7% |
| 45 | Byram | 12,799 | 5,689 | 24.8% | 71.2% | 2.2% | 1.0% |
| 46 | Holly Springs | 6,704 | 5,706 | 24.0% | 71.6% | 0.6% | 0.3% |
| 47 | Vicksburg | 20,589 | 5,738 | 23.7% | 71.9% | 2.3% | 0.1% |
| 48 | Hernando | 17,949 | 5,741 | 74.0% | 14.5% | 7.0% | 1.2% |
| 49 | McComb | 12,049 | 5,747 | 23.4% | 72.0% | 2.6% | 0.5% |
| 50 | Bay St. Louis | 10,188 | 5,937 | 75.6% | 13.7% | 4.6% | 1.3% |
| 51 | Canton | 10,811 | 5,973 | 19.6% | 74.6% | 5.4% | 0.0% |
| 52 | Ocean Springs | 18,646 | 6,019 | 76.6% | 7.4% | 8.4% | 4.9% |
| 53 | Madison | 27,946 | 6,176 | 77.3% | 12.7% | 2.3% | 5.9% |
| 54 | Waveland | 7,062 | 6,211 | 77.7% | 12.0% | 3.6% | 2.1% |
| 55 | Long Beach | 17,009 | 6,395 | 79.1% | 10.1% | 4.0% | 1.8% |
| 56 | Clarksdale | 14,231 | 6,734 | 13.4% | 80.9% | 3.8% | 0.4% |
| 57 | Jackson | 146,631 | 6,863 | 13.3% | 81.7% | 2.4% | 0.3% |
| 58 | Indianola | 9,062 | 6,865 | 15.0% | 81.5% | 1.7% | 0.4% |
| 59 | Greenville | 28,166 | 7,016 | 14.9% | 82.4% | 0.3% | 1.2% |
| 60 | Diamondhead | 9,338 | 7,182 | 84.3% | 2.6% | 5.5% | 1.4% |
| 61 | Yazoo City | 10,219 | 7,939 | 9.7% | 88.6% | 0.5% | 0.0% |
Source: U.S. Census ACS 2020-2024. 61 cities with more than 5,000 residents.
Summary
Summary: Diversity Across Mississippi
If you’re looking for a scientific breakdown of diversity across Mississippi, this is an accurate list.
The most diverse cities in Mississippi are Forest, Pascagoula, Pontotoc, Gulfport, Ridgeland, Gautier, Horn Lake, Biloxi, Olive Branch, and Starkville.


