
Before you decide to relocate to Iowa, it’s important to research the exact cost of living around the state. And that’s what we’re going to help you do.
These are the places in Iowa that cost a pretty penny — the most expensive cities in the state.
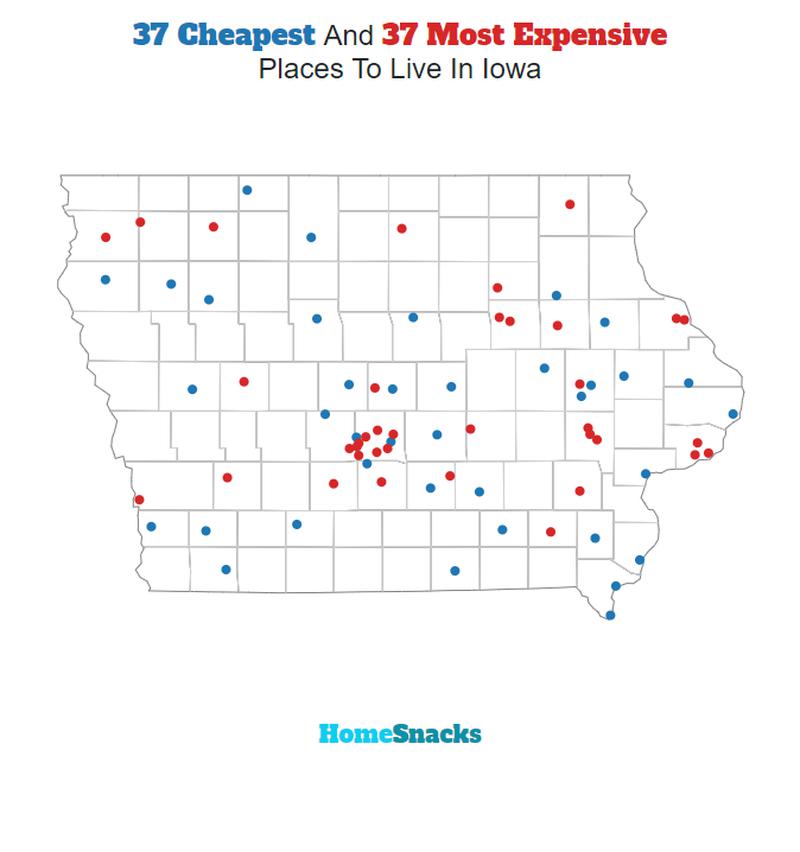
We used Saturday Night Science to compare the 2020-2024 American Community Survey on cost of living for the 85 places in Iowa with more than 5,000 people.
After we saved up for months and could finally afford it, we landed on this list of the ten most expensive cities in Iowa for 2026.
Table Of Contents: Top Ten | Methodology | Summary | Table
The 10 Most Expensive Places To Live In Iowa For 2026
What’s the most expensive place to live in Iowa? Well, HomeSnacks crunched the numbers and discovered that Polk City is the most expensive place to live in Iowa.
Maquoketa (the cheapest place to live in Iowa) can show these guys how to live on a budget in the coming years. Read on for how these places had costs rise faster than inflation.
And if you already knew these places were expensive, check out some more reading about Iowa and the most expensive cities in the country:
The 10 Most Expensive Places To Live In Iowa For 2026

/10
The overall cost of living in Polk City is 113. The median income in Polk City comes in at $164,389 and the average home value is $427,586 for 2026.

/10
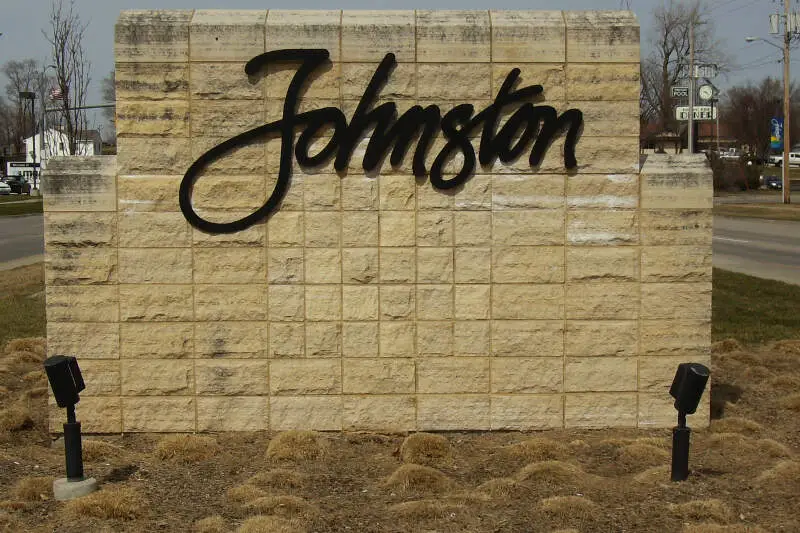
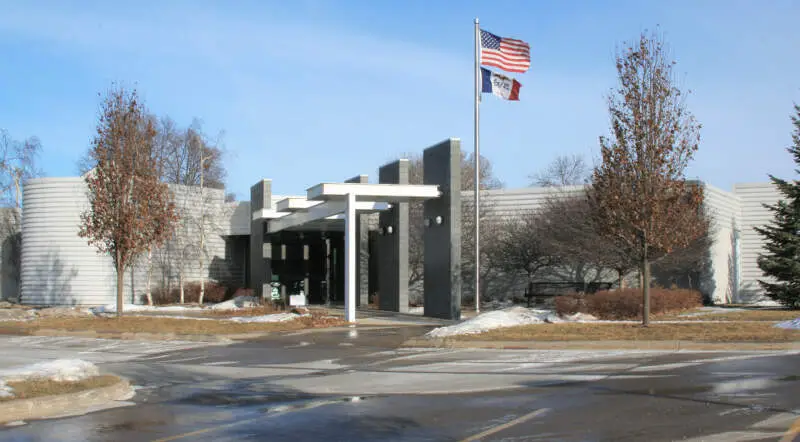
Population: 24,384
Cost Of Living Index: 110
Median Income: $106,551
Average Home Price: $394,440
Home Price To Income Ratio: 3.7x
More on Johnston: Data | Crime | Cost Of Living | Movers
The overall cost of living in Johnston is 110. The median income in Johnston comes in at $106,551 and the average home value is $394,440 for 2026.

/10
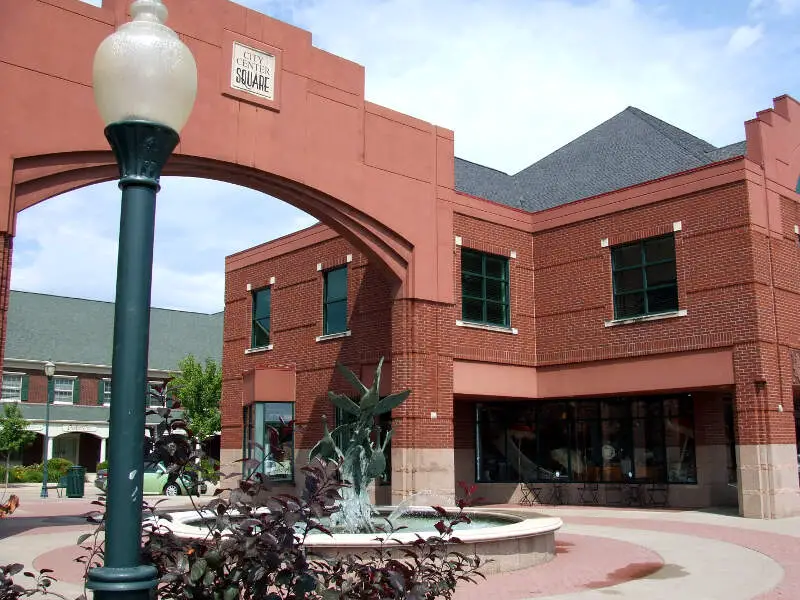
Population: 19,012
Cost Of Living Index: 110
Median Income: $132,121
Average Home Price: $425,730
Home Price To Income Ratio: 3.2x
More on Clive: Data | Crime | Cost Of Living | Movers
The overall cost of living in Clive is 110. The median income in Clive comes in at $132,121 and the average home value is $425,730 for 2026.
/10
Population: 5,989
Cost Of Living Index: 108
Median Income: $124,957
Average Home Price: $381,428
Home Price To Income Ratio: 3.1x
More on Asbury: Data | Crime | Cost Of Living | Movers
The overall cost of living in Asbury is 108. The median income in Asbury comes in at $124,957 and the average home value is $381,428 for 2026.

/10
Population: 46,595
Cost Of Living Index: 107
Median Income: $112,795
Average Home Price: $349,851
Home Price To Income Ratio: 3.1x
More on Urbandale: Data | Crime | Cost Of Living | Movers
The overall cost of living in Urbandale is 107. The median income in Urbandale comes in at $112,795 and the average home value is $349,851 for 2026.

/10
Population: 72,615
Cost Of Living Index: 106
Median Income: $108,198
Average Home Price: $338,168
Home Price To Income Ratio: 3.1x
More on Ankeny: Data | Crime | Cost Of Living | Movers
The overall cost of living in Ankeny is 106. The median income in Ankeny comes in at $108,198 and the average home value is $338,168 for 2026.

/10
Population: 23,234
Cost Of Living Index: 106
Median Income: $69,144
Average Home Price: $256,222
Home Price To Income Ratio: 3.7x
More on Coralville: Data | Crime | Cost Of Living | Movers
The overall cost of living in Coralville is 106. The median income in Coralville comes in at $69,144 and the average home value is $256,222 for 2026.

/10
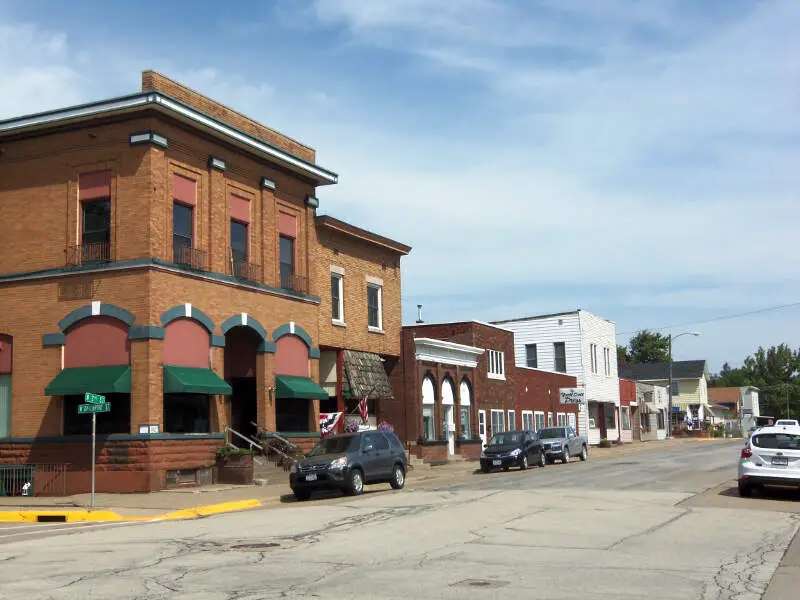
Population: 6,818
Cost Of Living Index: 106
Median Income: $106,316
Average Home Price: $347,340
Home Price To Income Ratio: 3.3x
More on Eldridge: Data | Crime | Cost Of Living | Movers
The overall cost of living in Eldridge is 106. The median income in Eldridge comes in at $106,316 and the average home value is $347,340 for 2026.

/10
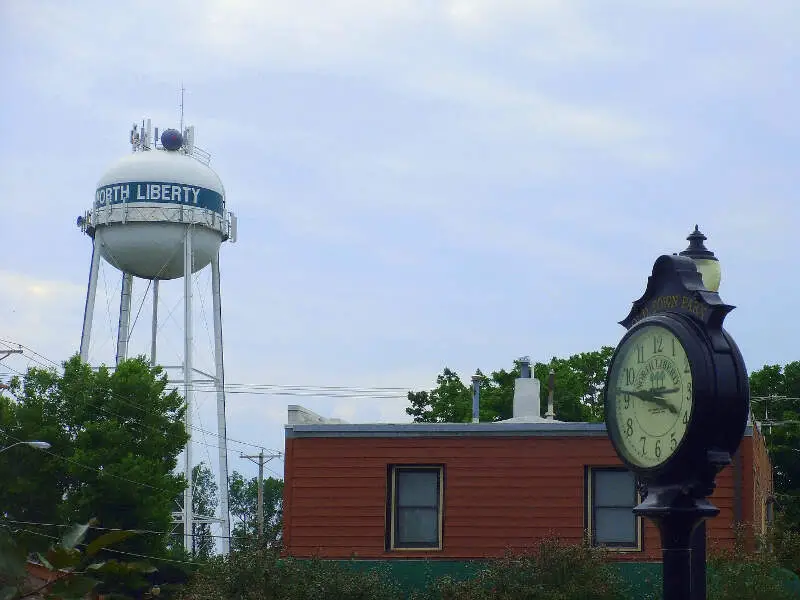
Population: 21,125
Cost Of Living Index: 105
Median Income: $102,102
Average Home Price: $307,635
Home Price To Income Ratio: 3.0x
More on North Liberty: Data | Crime | Cost Of Living | Movers
The overall cost of living in North Liberty is 105. The median income in North Liberty comes in at $102,102 and the average home value is $307,635 for 2026.

/10
Population: 39,647
Cost Of Living Index: 104
Median Income: $100,495
Average Home Price: $328,095
Home Price To Income Ratio: 3.3x
More on Bettendorf: Data | Crime | Cost Of Living | Movers
The overall cost of living in Bettendorf is 104. The median income in Bettendorf comes in at $100,495 and the average home value is $328,095 for 2026.
Methodology: How We Determined The Most Expensive Places To Live In The Hawkeye State For 2026
The two most important things to think about when it comes to being able to afford a city in Iowa are:
- How much money do I make?
- How much do I have to spend to live there?
You need to understand your costs in the context of how much money you make.
For example, if the median household earns $100,000 and spends $40,000 on housing, it’s actually cheaper to live there than a place with a median income of $50,000 and housing costs of $21,000. You might spend more on housing, but you have more money overall to play with.
With that example in mind, we derived several statistics from the latest Census American Community Survey 2020-2024 around incomes and costs. They are:
- Overall Cost Of Living Index
- Median Home Price / Median Income (lower is better)
- Median Income / Median Rent (Higher is better)
- Median Home Price
You can then compare these metrics in each of the places in Iowa to figure out which is the most expensive.
You are left with a “Cost of Living Index” by taking the average rank of each of these metrics for each city.
So we used that cost of living index to rank all of the 85 places in Iowa that have more than 5,000 people.
The place with the highest cost of living in Iowa according to the data is Polk City. We updated this article for 2026. This article is our eleventh time ranking the most expensive places to live in Iowa.
Summary: Taking A Chunk Out Of Your Paycheck In Iowa For 2026
Well, there you have it, the places in Iowa that have the highest cost of living, with Polk City ranking as the most expensive city in the Hawkeye State.
The most expensive cities in Iowa are Polk City, Johnston, Clive, Asbury, Urbandale, Ankeny, Coralville, Eldridge, North Liberty, and Bettendorf.
Here’s a look at the most affordable cities in Iowa according to the data:
- Maquoketa
- Cherokee
- Clarinda
For more Iowa reading, check out:
- Best Places To Live In Iowa
- Cheapest Places To Live In Iowa
- Most Dangerous Cities In Iowa
- Best Places To Raise A Family In Iowa
- Safest Places In Iowa
- Worst Places To Live In Iowa
Most Expensive Cities In Iowa
| Rank | City | Cost Of Living | Population | Median Income | Average Home Price | Home/Income Ratio |
|---|---|---|---|---|---|---|
| 1 | Polk City | 113 | 6,037 | $164,389 | $427,586 | 2.6x |
| 2 | Johnston | 110 | 24,384 | $106,551 | $394,440 | 3.7x |
| 3 | Clive | 110 | 19,012 | $132,121 | $425,730 | 3.2x |
| 4 | Asbury | 108 | 5,989 | $124,957 | $381,428 | 3.1x |
| 5 | Urbandale | 107 | 46,595 | $112,795 | $349,851 | 3.1x |
| 6 | Ankeny | 106 | 72,615 | $108,198 | $338,168 | 3.1x |
| 7 | Coralville | 106 | 23,234 | $69,144 | $256,222 | 3.7x |
| 8 | Eldridge | 106 | 6,818 | $106,316 | $347,340 | 3.3x |
| 9 | North Liberty | 105 | 21,125 | $102,102 | $307,635 | 3.0x |
| 10 | Bettendorf | 104 | 39,647 | $100,495 | $328,095 | 3.3x |
| 11 | Waukee | 104 | 29,236 | $101,029 | $338,880 | 3.4x |
| 12 | Iowa City | 103 | 75,752 | $58,546 | $298,092 | 5.1x |
| 13 | West Des Moines | 103 | 71,083 | $86,594 | $320,156 | 3.7x |
| 14 | Grimes | 103 | 16,366 | $120,037 | $348,193 | 2.9x |
| 15 | Pleasant Hill | 103 | 11,136 | $90,508 | $299,730 | 3.3x |
| 16 | Tiffin | 103 | 5,737 | $100,952 | $327,121 | 3.2x |
| 17 | Sergeant Bluff | 102 | 5,171 | $123,481 | $354,761 | 2.9x |
| 18 | Windsor Heights | 102 | 5,143 | $91,707 | $282,953 | 3.1x |
| 19 | Ames | 101 | 67,669 | $60,991 | $274,367 | 4.5x |
| 20 | Cedar Falls | 101 | 40,888 | $76,987 | $259,137 | 3.4x |
| 21 | Norwalk | 101 | 14,183 | $102,722 | $332,836 | 3.2x |
| 22 | Bondurant | 101 | 8,560 | $135,674 | $330,602 | 2.4x |
| 23 | Pella | 100 | 10,720 | $84,111 | $351,501 | 4.2x |
| 24 | Altoona | 99 | 21,495 | $86,114 | $317,901 | 3.7x |
| 25 | Sioux Center | 99 | 8,454 | $92,983 | $345,761 | 3.7x |
| 26 | Spirit Lake | 99 | 5,518 | $65,720 | $328,917 | 5.0x |
| 27 | Decorah | 98 | 7,535 | $64,366 | $304,334 | 4.7x |
| 28 | Adel | 97 | 6,430 | $95,250 | $390,597 | 4.1x |
| 29 | Indianola | 95 | 16,044 | $75,453 | $309,171 | 4.1x |
| 30 | Waverly | 95 | 10,494 | $80,284 | $271,473 | 3.4x |
| 31 | Algona | 95 | 5,377 | $56,040 | $179,883 | 3.2x |
| 32 | Marion | 94 | 41,896 | $86,743 | $271,355 | 3.1x |
| 33 | Le Mars | 94 | 10,640 | $74,701 | $275,107 | 3.7x |
| 34 | Clear Lake | 94 | 7,607 | $79,415 | $322,830 | 4.1x |
| 35 | Dubuque | 93 | 59,174 | $65,845 | $245,146 | 3.7x |
| 36 | Hiawatha | 93 | 7,206 | $66,270 | $254,299 | 3.8x |
| 37 | Orange City | 93 | 6,426 | $82,122 | $314,345 | 3.8x |
| 38 | Glenwood | 93 | 5,144 | $71,790 | $310,532 | 4.3x |
| 39 | Cedar Rapids | 92 | 137,264 | $70,424 | $204,111 | 2.9x |
| 40 | Muscatine | 92 | 23,489 | $58,117 | $184,866 | 3.2x |
| 41 | Grinnell | 92 | 9,505 | $65,320 | $208,193 | 3.2x |
| 42 | Winterset | 92 | 5,416 | $67,708 | $289,607 | 4.3x |
| 43 | Storm Lake | 91 | 11,428 | $62,765 | $177,022 | 2.8x |
| 44 | Independence | 91 | 6,164 | $73,806 | $216,073 | 2.9x |
| 45 | Des Moines | 90 | 212,421 | $65,932 | $208,165 | 3.2x |
| 46 | Davenport | 90 | 100,913 | $66,200 | $187,412 | 2.8x |
| 47 | Newton | 90 | 15,700 | $57,771 | $200,884 | 3.5x |
| 48 | Carroll | 90 | 10,208 | $69,706 | $200,080 | 2.9x |
| 49 | Washington | 90 | 7,290 | $55,373 | $190,721 | 3.4x |
| 50 | Sioux City | 89 | 86,101 | $68,906 | $196,299 | 2.8x |
| 51 | Waterloo | 89 | 67,008 | $57,480 | $143,280 | 2.5x |
| 52 | Burlington | 89 | 23,728 | $59,000 | $123,914 | 2.1x |
| 53 | Spencer | 89 | 11,400 | $59,667 | $193,030 | 3.2x |
| 54 | Nevada | 89 | 6,983 | $75,094 | $241,439 | 3.2x |
| 55 | Council Bluffs | 88 | 62,586 | $64,578 | $223,906 | 3.5x |
| 56 | Boone | 88 | 12,424 | $69,222 | $210,007 | 3.0x |
| 57 | Fort Madison | 88 | 10,133 | $50,705 | $109,639 | 2.2x |
| 58 | Fairfield | 88 | 9,456 | $51,311 | $158,193 | 3.1x |
| 59 | Mount Pleasant | 88 | 8,951 | $61,042 | $191,461 | 3.1x |
| 60 | Sheldon | 88 | 5,474 | $62,159 | $220,402 | 3.5x |
| 61 | Clinton | 87 | 24,322 | $60,230 | $127,331 | 2.1x |
| 62 | Denison | 87 | 8,260 | $65,684 | $176,094 | 2.7x |
| 63 | Estherville | 87 | 5,839 | $54,124 | $122,713 | 2.3x |
| 64 | Anamosa | 87 | 5,629 | $60,650 | $243,589 | 4.0x |
| 65 | Mason City | 86 | 27,050 | $64,804 | $154,095 | 2.4x |
| 66 | Keokuk | 86 | 9,662 | $52,711 | $80,981 | 1.5x |
| 67 | Atlantic | 86 | 6,763 | $61,141 | $158,965 | 2.6x |
| 68 | Creston | 85 | 7,435 | $52,633 | $152,978 | 2.9x |
| 69 | Osceola | 85 | 5,523 | $68,284 | $187,628 | 2.7x |
| 70 | Manchester | 85 | 5,191 | $61,191 | $222,973 | 3.6x |
| 71 | Ottumwa | 84 | 25,430 | $61,103 | $121,424 | 2.0x |
| 72 | Fort Dodge | 84 | 24,827 | $60,649 | $129,004 | 2.1x |
| 73 | Oskaloosa | 84 | 11,504 | $64,004 | $186,482 | 2.9x |
| 74 | Perry | 84 | 7,985 | $68,910 | $172,451 | 2.5x |
| 75 | Knoxville | 84 | 7,473 | $61,599 | $203,229 | 3.3x |
| 76 | Charles City | 84 | 7,232 | $59,180 | $140,720 | 2.4x |
| 77 | Red Oak | 84 | 5,510 | $50,109 | $136,873 | 2.7x |
| 78 | Iowa Falls | 84 | 5,038 | $50,417 | $130,588 | 2.6x |
| 79 | Marshalltown | 83 | 27,626 | $69,068 | $173,581 | 2.5x |
| 80 | Webster City | 83 | 7,769 | $63,430 | $147,379 | 2.3x |
| 81 | Oelwein | 83 | 5,834 | $46,653 | $109,878 | 2.4x |
| 82 | Centerville | 82 | 5,372 | $46,563 | $80,251 | 1.7x |
| 83 | Clarinda | 82 | 5,353 | $46,348 | $125,018 | 2.7x |
| 84 | Cherokee | 82 | 5,154 | $61,750 | $148,065 | 2.4x |
| 85 | Maquoketa | 81 | 6,075 | $60,240 | $197,794 | 3.3x |