The Lone Star State is a massive place that can accommodate all walks of life. But we’ve done the research to discover which cities are the most expensive to live in Texas for 2026.
Just where are these deep pockets of extreme wealth in Texas? By and large, the places you’ll see on this list are in the southern region of the state, with many cities no farther than an hour outside of Houston or San Antonio.
If you put a premium on live music, then you won’t mind paying extra to live in Austin, the city with the most live music venues per capita in the country. If you’re looking for the priciest suburb of Dallas, Addison is the spot for you.
How did we come up with this list of pricey places? We looked at the cost of living from the Census to compare home prices and rents across Texas. We found that you need to earn at least $181,352/year to live in the upper echelon of Texan society.
$250,001 median income · $2,891,619 median home · #1 home prices in Texas
Highland Park is a town in central Dallas County, Texas, United States. It is among the five wealthiest locations in Texas, and the most affluent suburb of Dallas. The population was 8,564 at the 2010 census. It is located between the Dallas North Tollway and U.S. Route 75, 4 miles north of downtown Dallas.
Data | Crime | Cost of living | Movers
$250,001 median income · $2,420,171 median home · #2 home prices in Texas
University Park is a city in Dallas County, Texas, United States, an inner northern suburb of Dallas. The population was 23,068 at the 2010 census. The city is home to Southern Methodist University.
Data | Crime | Cost of living | Movers
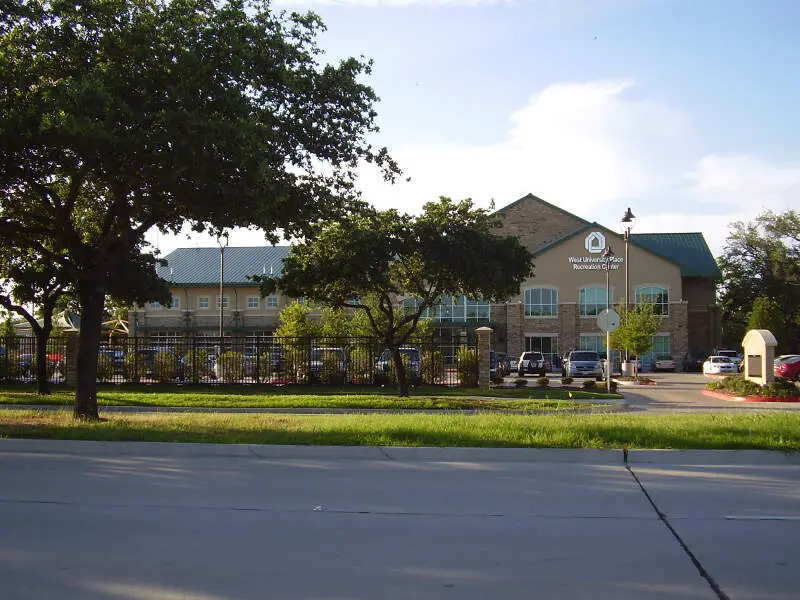
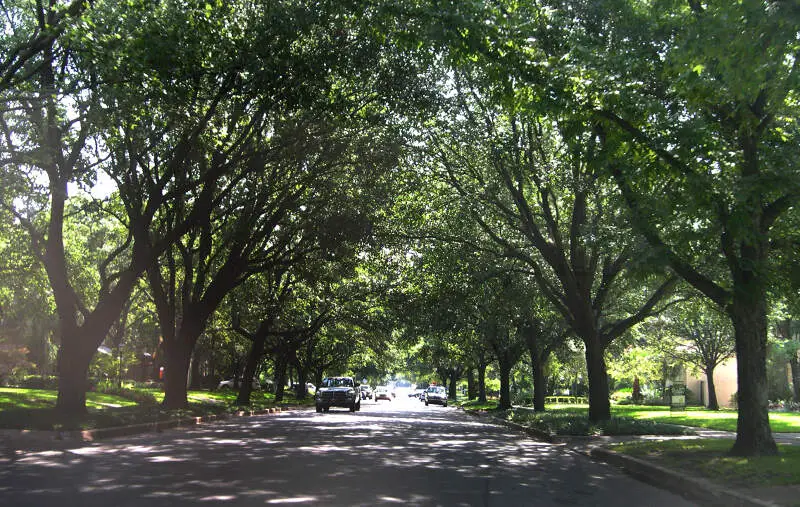
$250,001 median income · $1,560,991 median home · #3 home prices in Texas
West University Place, often called West University or West U for short, is a city located in the U.S. state of Texas within the Houston-The Woodlands-Sugar Land metropolitan area and southwestern Harris County. As of the 2010 U.S. Census, the population of the city was 14,787. It is nicknamed “The Neighborhood City” and is mainly a bedroom community for upper-class families.
Data | Crime | Cost of living | Movers
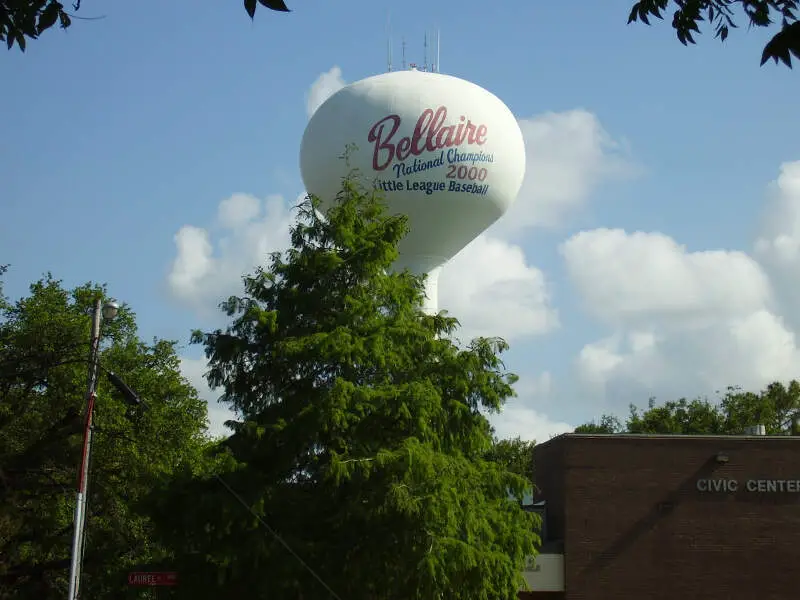
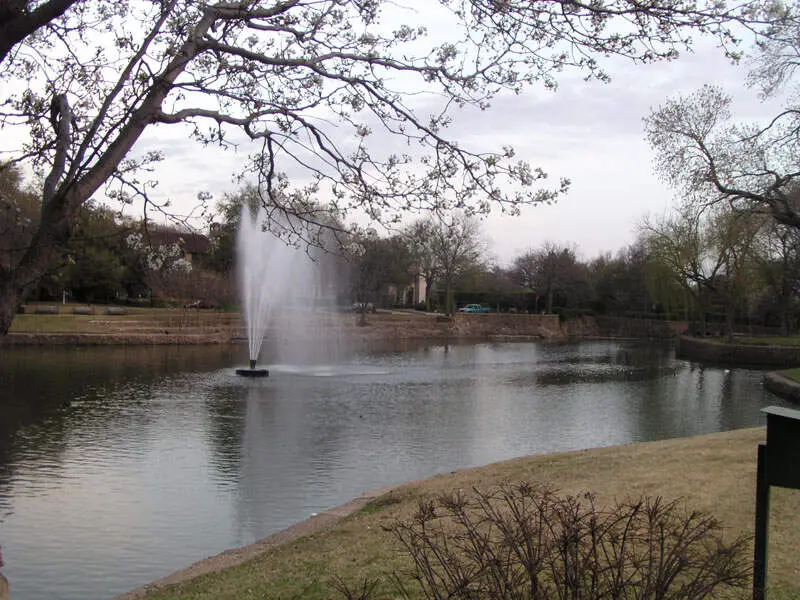
$244,015 median income · $1,164,142 median home · #5 home prices in Texas
Bellaire is a city in southwest Harris County, Texas, United States, within the Houston-Sugar Land-Baytown metropolitan area. As of the 2010 U.S. Census, the city population was 16,855 and is surrounded by the cities of Houston and West University Place.
Data | Crime | Cost of living | Movers
$229,080 median income · $1,088,169 median home · #6 home prices in Texas
Data | Crime | Cost of living | Movers
$186,400 median income · $883,660 median home · #9 home prices in Texas
Data | Crime | Cost of living | Movers
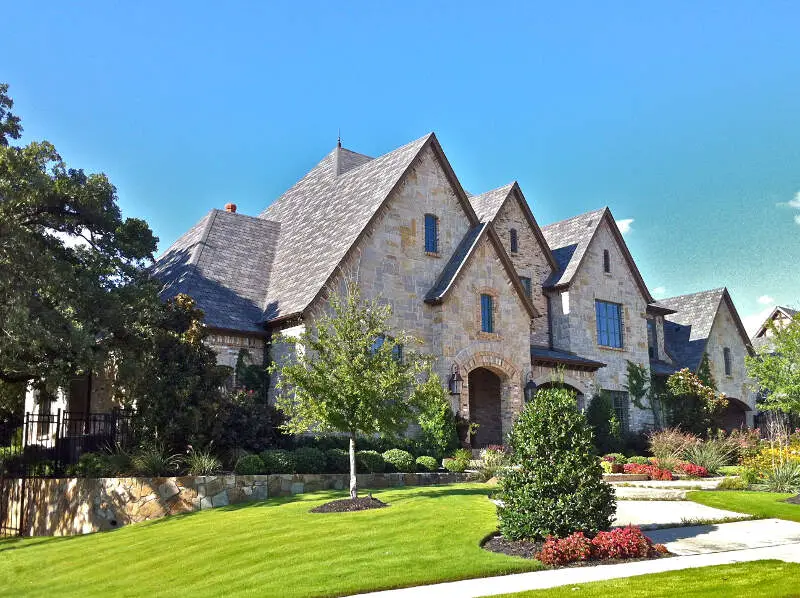
$250,001 median income · $1,301,365 median home · #4 home prices in Texas
Southlake is a city located predominantly in Tarrant County with minor areas extending into Denton County in the U.S. state of Texas. Southlake is a suburb in the Dallas/Fort Worth Metropolitan area. As of the 2010 census it had a population of 26,575. Southlake is known for public schools, Southlake Town Square, its wealth, Gateway Church and Carroll High School’s 8-time state champion Football and Men’s Swim & Dive team.
Data | Crime | Cost of living | Movers
$221,364 median income · $1,074,131 median home · #7 home prices in Texas
Data | Crime | Cost of living | Movers
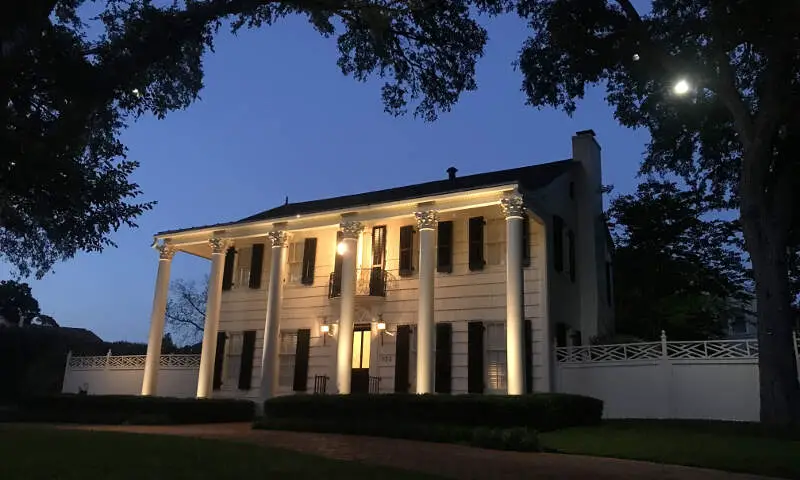
$183,088 median income · $731,192 median home · #13 home prices in Texas
Alamo Heights is an incorporated city that is surrounded by the city of San Antonio in Bexar County in the U.S. state of Texas. At the time of the 2010 census, the population of Alamo Heights was 7,031. It is part of the Greater San Antonio metropolitan area. A portion of the University of the Incarnate Word is in Alamo Heights. The current mayor of Alamo Heights is The Honorable Bobby Rosenthal.
Data | Crime | Cost of living | Movers
$181,352 median income · $594,342 median home · #24 home prices in Texas
Data | Crime | Cost of living | Movers
The receipts
Compare the top ten
Pick a metric. The bars rescale. The red line is Texas’s statewide median.
Texas statewide median: $300,957
Texas statewide median: $78,476
On the map
Mapping the most expensive places in Texas
Saturday Night Science
Methodology: How We Determined The Most Expensive Places To Live In The Lone Star State For 2026
The two most important things to think about when it comes to being able to afford a city in Texas are how much money you make and how much you have to spend to live there.
You need to understand your costs in the context of how much money you make.
For example, if the median household earns $100,000 and spends $40,000 on housing, it’s actually cheaper to live there than a place with a median income of $50,000 and housing costs of $21,000. You might spend more on housing, but you have more money overall to play with.
With that example in mind, we derived several statistics from the latest Census American Community Survey 2020-2024 around incomes and costs. They are:
- Overall Cost Of Living Index
- Median Home Price / Median Income (lower is better)
- Median Income / Median Rent (Higher is better)
- Median Home Price
You can then compare these metrics in each of the places in Texas to figure out which is the most expensive.
You are left with a “Cost of Living Index” by taking the average rank of each of these metrics for each city.
So we used that cost of living index to rank all of the 372 places in Texas that have more than 5,000 people.
The place with the highest cost of living in Texas according to the data is Highland Park. We updated this article for 2026. This article is our eleventh time ranking the most expensive places to live in Texas.
The full plate
Most Expensive Cities In Texas
Click any column to sort. Search by city name.
| Rank | City | Cost Of Living | Population | Median Income | Average Home Price | Home/Income Ratio |
|---|---|---|---|---|---|---|
| 1 | Highland Park | 256 | 8,773 | $250,001 | $2,891,619 | 11.6x |
| 2 | University Park | 245 | 25,155 | $250,001 | $2,420,171 | 9.7x |
| 3 | West University Place | 236 | 14,982 | $250,001 | $1,560,991 | 6.2x |
| 4 | Bellaire | 185 | 17,206 | $244,015 | $1,164,142 | 4.8x |
| 5 | Parker | 180 | 5,999 | $229,080 | $1,088,169 | 4.8x |
| 6 | Terrell Hills | 179 | 5,070 | $186,400 | $883,660 | 4.7x |
| 7 | Southlake | 165 | 31,137 | $250,001 | $1,301,365 | 5.2x |
| 8 | Lucas | 159 | 8,351 | $221,364 | $1,074,131 | 4.9x |
| 9 | Alamo Heights | 159 | 7,492 | $183,088 | $731,192 | 4.0x |
| 10 | Argyle | 158 | 5,371 | $181,352 | $594,342 | 3.3x |
| 11 | Fair Oaks Ranch | 154 | 10,728 | $174,327 | $697,347 | 4.0x |
| 12 | Colleyville | 151 | 26,012 | $218,328 | $913,049 | 4.2x |
| 13 | Heath | 147 | 10,777 | $220,828 | $708,331 | 3.2x |
| 14 | Bee Cave | 146 | 8,862 | $111,172 | $823,338 | 7.4x |
| 15 | Lakeway | 145 | 19,307 | $190,060 | $741,100 | 3.9x |
| 16 | Fulshear | 143 | 34,868 | $187,035 | $505,480 | 2.7x |
| 17 | Prosper | 142 | 37,869 | $195,281 | $784,350 | 4.0x |
| 18 | Keller | 136 | 45,976 | $174,950 | $652,144 | 3.7x |
| 19 | Trophy Club | 136 | 13,733 | $201,054 | $701,041 | 3.5x |
| 20 | Fairview | 134 | 10,783 | $109,347 | $660,166 | 6.0x |
| 21 | Frisco | 133 | 219,304 | $150,212 | $656,758 | 4.4x |
| 22 | Coppell | 132 | 42,154 | $146,235 | $619,492 | 4.2x |
| 23 | Murphy | 131 | 21,188 | $175,699 | $571,960 | 3.3x |
| 24 | Northlake | 129 | 8,283 | $123,469 | $497,061 | 4.0x |
| 25 | Flower Mound | 128 | 78,389 | $161,235 | $609,719 | 3.8x |
| 26 | Highland Village | 128 | 16,101 | $159,828 | $587,436 | 3.7x |
| 27 | Helotes | 128 | 9,630 | $132,675 | $462,259 | 3.5x |
| 28 | Sugar Land | 126 | 110,016 | $136,217 | $447,176 | 3.3x |
| 29 | Grapevine | 125 | 51,139 | $111,376 | $552,148 | 5.0x |
| 30 | Melissa | 125 | 20,136 | $138,763 | $434,769 | 3.1x |
| 31 | Sunnyvale | 125 | 8,336 | $170,348 | $631,290 | 3.7x |
| 32 | Dripping Springs | 125 | 7,405 | $109,364 | $689,080 | 6.3x |
| 33 | Austin | 124 | 979,539 | $93,658 | $508,530 | 5.4x |
| 34 | Hickory Creek | 124 | 5,611 | $148,852 | $494,276 | 3.3x |
| 35 | Cedar Park | 123 | 78,301 | $129,545 | $471,699 | 3.6x |
| 36 | Addison | 123 | 17,290 | $73,854 | $490,587 | 6.6x |
| 37 | Oak Point | 123 | 5,887 | $126,290 | $419,835 | 3.3x |
| 38 | McKinney | 122 | 210,600 | $124,215 | $481,963 | 3.9x |
| 39 | Boerne | 122 | 20,518 | $84,541 | $554,313 | 6.6x |
| 40 | Plano | 120 | 290,594 | $112,253 | $498,989 | 4.4x |
| 41 | Allen | 120 | 110,265 | $130,901 | $493,532 | 3.8x |
| 42 | Celina | 120 | 34,268 | $170,894 | $546,742 | 3.2x |
| 43 | Roanoke | 120 | 10,286 | $97,295 | $428,021 | 4.4x |
| 44 | Fate | 119 | 22,884 | $132,752 | $361,762 | 2.7x |
| 45 | Willow Park | 119 | 5,874 | $132,045 | $407,700 | 3.1x |
| 46 | Georgetown | 118 | 85,999 | $95,062 | $426,799 | 4.5x |
| 47 | Little Elm | 118 | 54,820 | $119,219 | $403,397 | 3.4x |
| 48 | Jersey Village | 118 | 7,817 | $79,750 | $385,932 | 4.8x |
| 49 | Friendswood | 117 | 41,030 | $126,508 | $457,135 | 3.6x |
| 50 | Aledo | 117 | 5,825 | $163,231 | $537,268 | 3.3x |
| 51 | Richardson | 116 | 118,731 | $98,111 | $440,400 | 4.5x |
| 52 | Leander | 116 | 74,067 | $139,048 | $425,972 | 3.1x |
| 53 | Buda | 116 | 15,859 | $123,766 | $354,685 | 2.9x |
| 54 | Mont Belvieu | 116 | 9,020 | $132,781 | $439,307 | 3.3x |
| 55 | League City | 115 | 116,215 | $121,099 | $372,300 | 3.1x |
| 56 | Wylie | 115 | 60,334 | $119,522 | $421,548 | 3.5x |
| 57 | Bulverde | 115 | 6,486 | $112,188 | $476,432 | 4.2x |
| 58 | Carrollton | 113 | 133,740 | $101,396 | $406,040 | 4.0x |
| 59 | Mansfield | 113 | 77,510 | $121,126 | $444,293 | 3.7x |
| 60 | Cibolo | 113 | 35,109 | $122,365 | $335,092 | 2.7x |
| 61 | Seabrook | 113 | 13,768 | $102,726 | $348,376 | 3.4x |
| 62 | Lago Vista | 113 | 9,650 | $113,457 | $402,383 | 3.5x |
| 63 | Providence Village | 113 | 8,721 | $110,430 | $372,220 | 3.4x |
| 64 | College Station | 112 | 124,570 | $50,900 | $349,041 | 6.9x |
| 65 | Sachse | 112 | 30,491 | $131,808 | $433,037 | 3.3x |
| 66 | Anna | 112 | 24,330 | $105,593 | $349,537 | 3.3x |
| 67 | Fredericksburg | 112 | 11,419 | $64,534 | $517,758 | 8.0x |
| 68 | Woodway | 112 | 9,570 | $115,108 | $368,723 | 3.2x |
| 69 | Lavon | 112 | 6,498 | $131,303 | $349,797 | 2.7x |
| 70 | Nassau Bay | 112 | 5,230 | $71,696 | $397,247 | 5.5x |
| 71 | Round Rock | 111 | 127,786 | $99,287 | $407,077 | 4.1x |
| 72 | Pearland | 111 | 127,514 | $118,842 | $382,157 | 3.2x |
| 73 | Missouri City | 111 | 76,558 | $94,390 | $336,288 | 3.6x |
| 74 | Rowlett | 111 | 65,463 | $112,081 | $371,473 | 3.3x |
| 75 | Rockwall | 111 | 51,168 | $115,580 | $480,553 | 4.2x |
| 76 | The Colony | 111 | 45,454 | $114,511 | $406,282 | 3.5x |
| 77 | Corinth | 111 | 23,385 | $120,580 | $410,565 | 3.4x |
| 78 | Hutto | 110 | 35,483 | $118,834 | $338,960 | 2.9x |
| 79 | North Richland Hills | 109 | 70,780 | $97,305 | $367,728 | 3.8x |
| 80 | Pflugerville | 109 | 65,971 | $117,799 | $377,293 | 3.2x |
| 81 | Midlothian | 109 | 39,356 | $126,641 | $450,602 | 3.6x |
| 82 | Manvel | 109 | 14,758 | $118,808 | $443,743 | 3.7x |
| 83 | Selma | 109 | 11,503 | $97,066 | $289,155 | 3.0x |
| 84 | Justin | 109 | 5,447 | $114,157 | $371,851 | 3.3x |
| 85 | Lewisville | 108 | 131,080 | $89,233 | $393,896 | 4.4x |
| 86 | New Braunfels | 108 | 104,643 | $86,021 | $350,104 | 4.1x |
| 87 | Kyle | 108 | 56,823 | $90,323 | $299,795 | 3.3x |
| 88 | Schertz | 108 | 44,050 | $99,948 | $314,686 | 3.1x |
| 89 | Princeton | 108 | 25,229 | $105,200 | $294,071 | 2.8x |
| 90 | Red Oak | 108 | 17,077 | $104,561 | $344,822 | 3.3x |
| 91 | Bastrop | 108 | 11,156 | $81,551 | $351,852 | 4.3x |
| 92 | Midland | 107 | 136,640 | $89,585 | $328,325 | 3.7x |
| 93 | Cedar Hill | 107 | 48,879 | $101,909 | $314,931 | 3.1x |
| 94 | Manor | 107 | 18,603 | $84,529 | $323,301 | 3.8x |
| 95 | Iowa Colony | 107 | 12,891 | $144,092 | $339,032 | 2.4x |
| 96 | Dallas | 106 | 1,307,930 | $70,518 | $309,421 | 4.4x |
| 97 | Euless | 106 | 60,421 | $82,167 | $357,017 | 4.3x |
| 98 | Burleson | 106 | 52,918 | $93,928 | $338,945 | 3.6x |
| 99 | Farmers Branch | 106 | 36,645 | $91,186 | $377,734 | 4.1x |
| 100 | Forney | 106 | 31,532 | $104,112 | $311,401 | 3.0x |
Source: U.S. Census ACS 2020-2024, Zillow research. 372 places with more than 5,000 residents.
Summary
Summary: Taking A Chunk Out Of Your Paycheck In Texas For 2026
Well, there you have it, the places in Texas that have the highest cost of living, with Highland Park ranking as the most expensive city in the Lone Star State.
The most expensive cities in Texas are Highland Park, University Park, West University Place, Bellaire, Parker, Terrell Hills, Southlake, Lucas, Alamo Heights, and Argyle.


