Most Hispanic/Latino cities in Maryland research summary. We used Saturday Night Science to analyze Maryland’s most recent Census data to determine the most Hispanic/Latino cities based on the percentage of Hispanic/Latino residents.
49.2% Hispanic · #1 most Hispanic in Maryland
Riverdale Park, formerly known and often referred to as Riverdale, Maryland is a semi-urban town in Prince George’s County, Maryland, United States, a suburb in the Washington D.C. metropolitan area. The population was 6,956 as of 2010.
Data | Crime | Cost of living | Movers
41.9% Hispanic · #2 most Hispanic in Maryland
Bladensburg is a town in Prince George’s County, Maryland, United States. The population was 9,148 at the 2010 census. Areas in Bladensburg have the ZIP code 20710. Bladensburg is 8.6 miles from central Washington, D.C.
Data | Crime | Cost of living | Movers
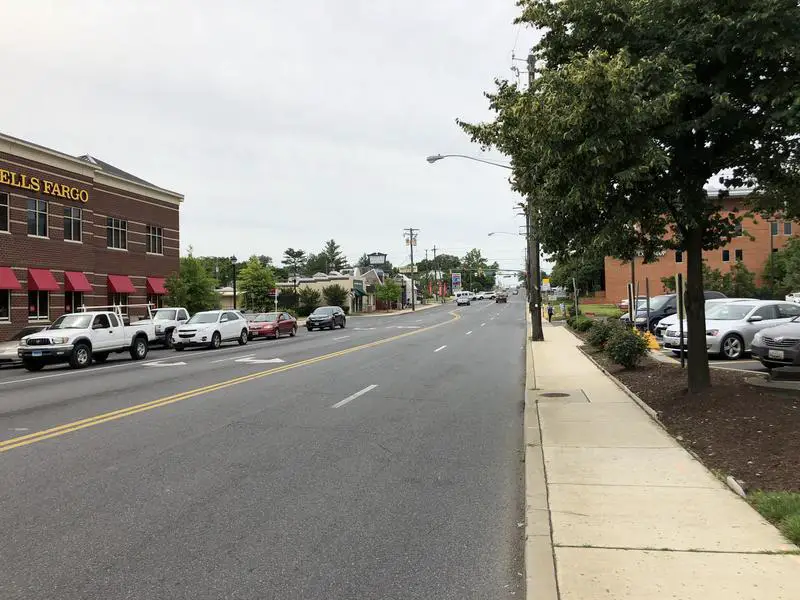
37.5% Hispanic · #3 most Hispanic in Maryland
Hyattsville is a city in Prince George’s County, Maryland, and also a close, urban suburb of Washington, D.C. The population was 17,557 at the 2010 United States Census.
Data | Crime | Cost of living | Movers
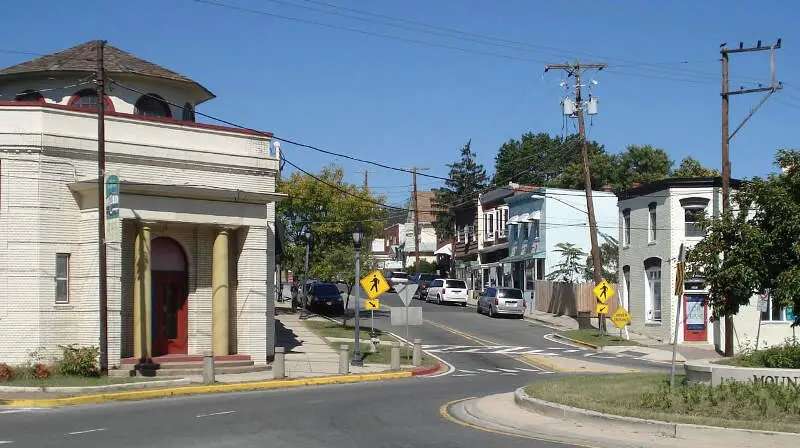
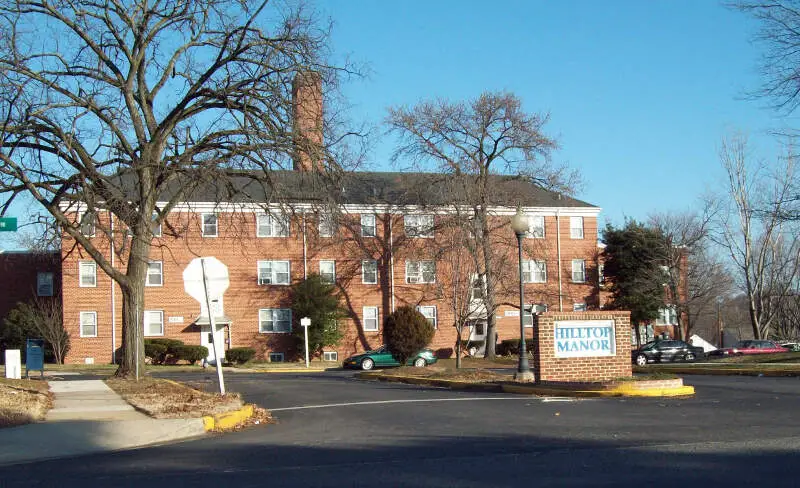
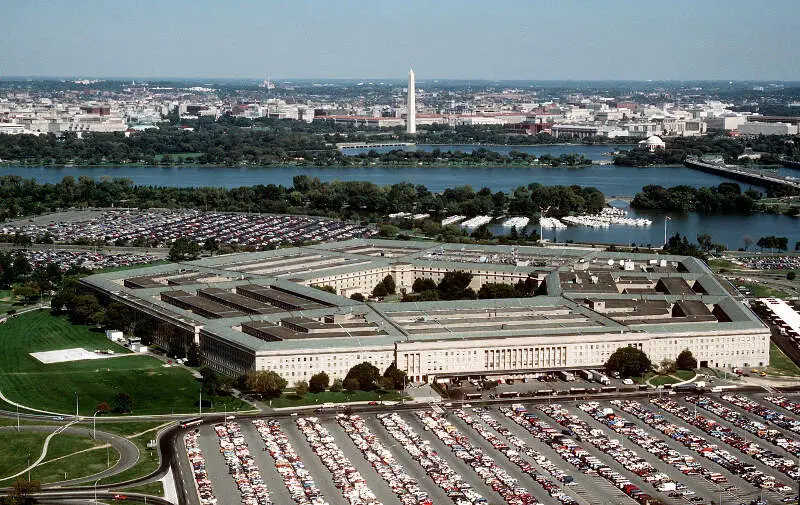
34.7% Hispanic · #4 most Hispanic in Maryland
Data | Crime | Cost of living | Movers
33.4% Hispanic · #5 most Hispanic in Maryland
New Carrollton is a city located in central Prince George’s County, Maryland, in the United States. As of the 2010 U.S. Census, the population was 12,135. New Carrollton is located 12 miles east of central Washington, D.C.
Data | Crime | Cost of living | Movers
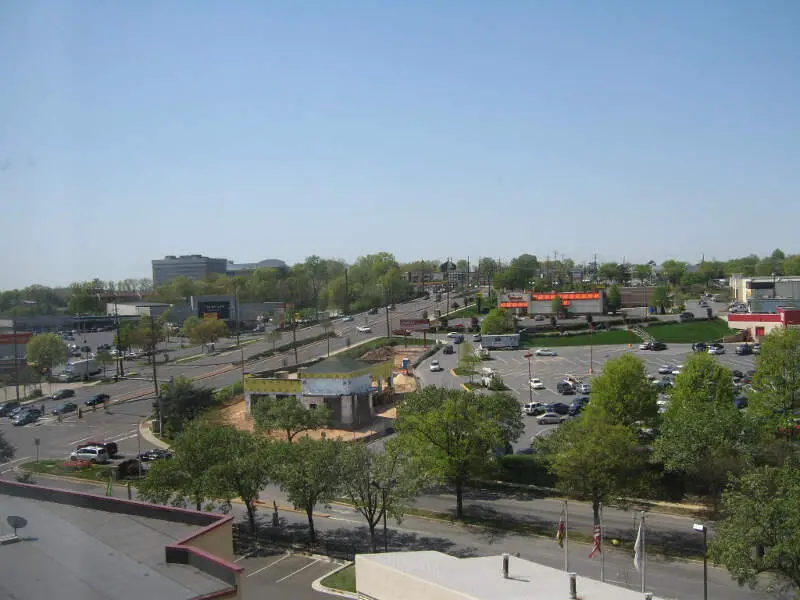
30.5% Hispanic · #6 most Hispanic in Maryland
Gaithersburg ), officially the City of Gaithersburg, is a city in Montgomery County, Maryland. At the time of the 2010 U.S. Census, Gaithersburg had a population of 59,933, making it the fourth largest incorporated city in the state, behind Baltimore, Frederick, and Rockville. Gaithersburg is located to the northwest of Washington, D.C., and is considered a suburb and a primary city within the Washington-Arlington-Alexandria, DC-VA-MD-WV Metropolitan Statistical Area. Gaithersburg was incorporated as a town in 1878 and as a city in 1968.
Data | Crime | Cost of living | Movers
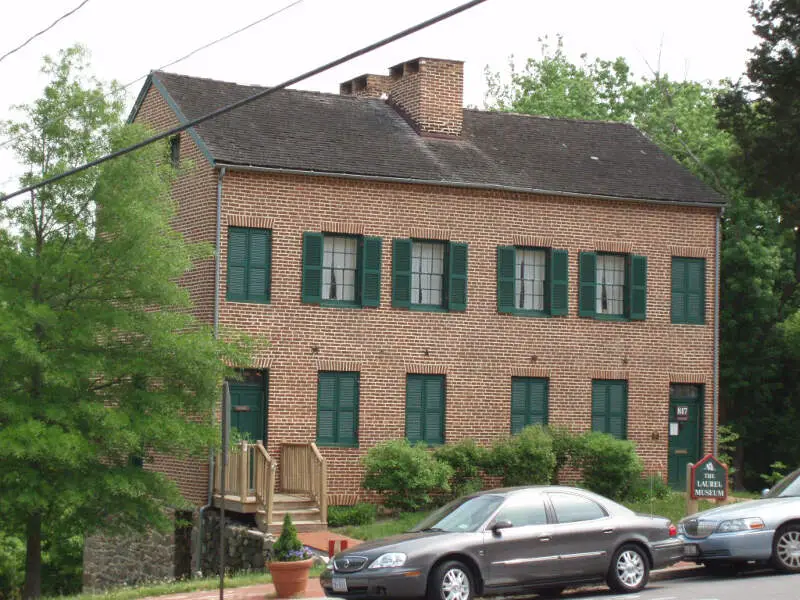
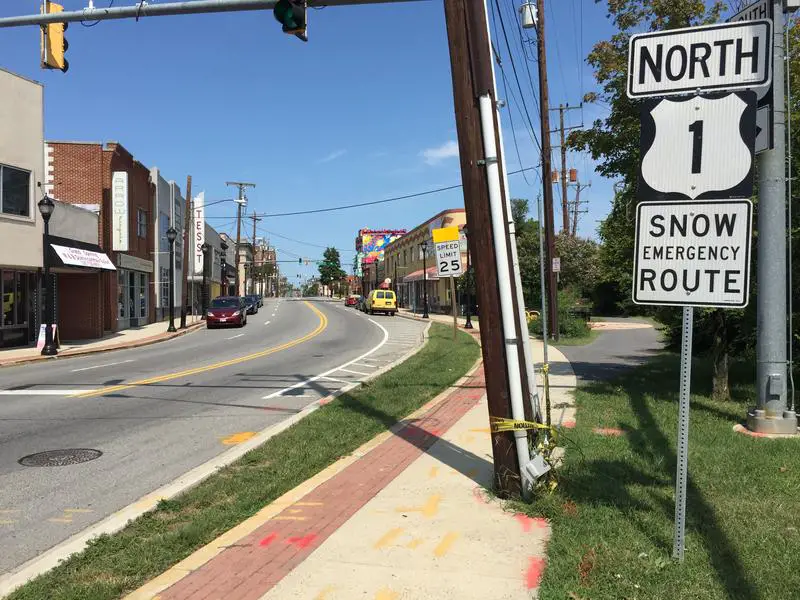
22.2% Hispanic · #7 most Hispanic in Maryland
Laurel is a city in northern Prince George’s County, Maryland, in the United States, located almost midway between Washington, D.C., and Baltimore on the banks of the Patuxent River. Founded as a mill town in the early 19th century, the arrival of the Baltimore & Ohio Railroad in 1835 expanded local industry and later enabled the city to become an early commuter town for Washington and Baltimore workers. Largely residential today, the city maintains a historic district centered on its Main Street, highlighting its industrial past.
Data | Crime | Cost of living | Movers
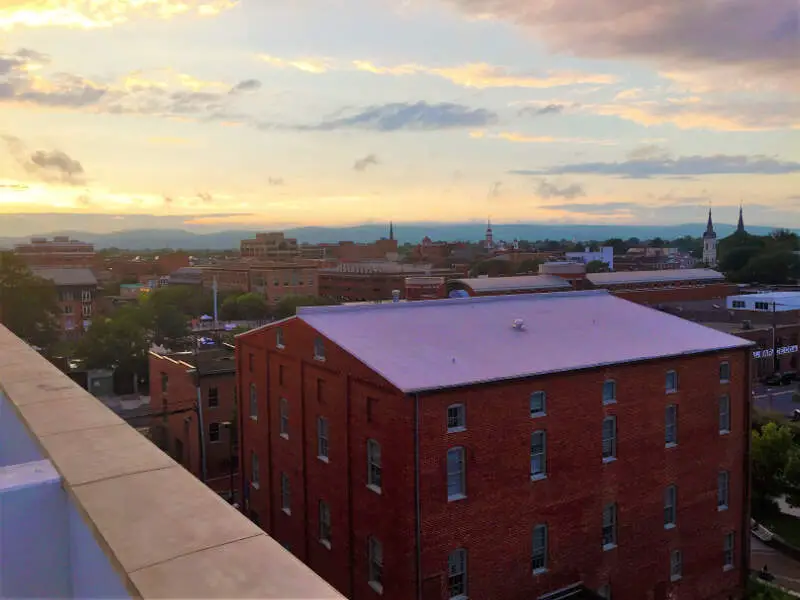
20.5% Hispanic · #8 most Hispanic in Maryland
Frederick is a city and the county seat of Frederick County in the U.S. state of Maryland. It is part of the Baltimore-Washington Metropolitan Area. Frederick has long been an important crossroads, located at the intersection of a major north-south Indian trail, and east-west routes to the Chesapeake Bay, both at Baltimore and what became Washington, D.C. and across the Appalachian mountains to the Ohio River watershed. It is a part of the Washington-Arlington-Alexandria, DC-VA-MD-WV Metropolitan Statistical Area, which is part of a greater Washington-Baltimore-Arlington, DC-MD-VA-WV-PA Combined Statistical Area. The city’s population was 65,239 people at the 2010 United States Census, making it the second-largest incorporated city in Maryland, behind Baltimore. Frederick is home to Frederick Municipal Airport, which primarily accommodates general aviation traffic, and to the county’s largest employer U.S. Army’s Fort Detrick bioscience/communications research installation.
Data | Crime | Cost of living | Movers
19.8% Hispanic · #9 most Hispanic in Maryland
Glenarden is a city in Prince George’s County, Maryland, United States. The population was 6,000 at the 2010 census.
Data | Crime | Cost of living | Movers
19.2% Hispanic · #10 most Hispanic in Maryland
Greenbelt is a city in Prince George’s County, Maryland, United States. Contained within today’s City of Greenbelt is the historic planned community now known locally as “Old Greenbelt” and designated as the Greenbelt Historic District. Greenbelt’s population was 23,068 at the 2010 U.S. Census.
Data | Crime | Cost of living | Movers
The receipts
Compare the top ten
Pick a metric. The bars rescale. The red line is Maryland’s statewide median.
On the map
Where Maryland’s Hispanic and Latino communities live
Saturday Night Science
Methodology: How We Determined The Cities In Maryland With The Largest Hispanic Population For 2026
We used Saturday Night Science to compare data on race from the US Census for every city in Maryland.
Maryland’s most recently available data comes from the 2020-2024 American Community Survey.
Specifically, we looked at table B03002: Hispanic OR LATINO ORIGIN BY RACE. Here are the category names as defined by the Census:
- Hispanic or Latino
- White alone*
- Black or African American alone*
- American Indian and Alaska Native alone*
- Asian alone*
- Native Hawaiian and Other Pacific Islander alone*
- Some other race alone*
- Two or more races*
Our particular column of interest here was the number of people who identified as Hispanic or Latino.
We limited our analysis to places in Maryland with a population greater than 5,000 people. That left us with 39 cities.
We then calculated the percentage of Hispanic or Latino residents in each Maryland city. The percentages ranked from 49.2% to 1.4%.
Finally, we ranked each city based on the percentage of the Hispanic or Latino population, with a higher percentage being more Hispanic or Latino. Riverdale Park was the most Hispanic or Latino, while Hampstead was the least Hispanic or Latino city.
We updated this article for 2026. This article represents our eleventh time ranking the cities in Maryland with the largest Hispanic/Latino population.
The full plate
Cities In Maryland By Hispanic Population
Click any column to sort. Search by city name.
| Rank | City | Population | Hispanic Population | % Hispanic |
|---|---|---|---|---|
| 1 | Riverdale Park | 7,270 | 3,580 | 49.2% |
| 2 | Bladensburg | 9,583 | 4,019 | 41.9% |
| 3 | Hyattsville | 20,966 | 7,863 | 37.5% |
| 4 | Mount Rainier | 8,245 | 2,861 | 34.7% |
| 5 | New Carrollton | 13,564 | 4,534 | 33.4% |
| 6 | Gaithersburg | 69,825 | 21,331 | 30.5% |
| 7 | Laurel | 29,798 | 6,607 | 22.2% |
| 8 | Frederick | 83,395 | 17,109 | 20.5% |
| 9 | Glenarden | 6,344 | 1,255 | 19.8% |
| 10 | Greenbelt | 24,678 | 4,727 | 19.2% |
| 11 | Rockville | 67,671 | 12,242 | 18.1% |
| 12 | College Park | 34,540 | 6,110 | 17.7% |
| 13 | Cheverly | 6,096 | 1,033 | 16.9% |
| 14 | Annapolis | 40,720 | 6,013 | 14.8% |
| 15 | Easton | 17,308 | 2,520 | 14.6% |
| 16 | Takoma Park | 17,632 | 2,482 | 14.1% |
| 17 | Walkersville | 6,414 | 867 | 13.5% |
| 18 | Brunswick | 8,450 | 1,043 | 12.3% |
| 19 | Hagerstown | 43,665 | 5,326 | 12.2% |
| 20 | Aberdeen | 17,298 | 1,900 | 11.0% |
| 21 | District Heights | 5,891 | 641 | 10.9% |
| 22 | Bowie | 57,926 | 5,783 | 10.0% |
| 23 | Bel Air | 10,585 | 1,052 | 9.9% |
| 24 | Ocean City | 6,903 | 657 | 9.5% |
| 25 | Westminster | 20,445 | 1,799 | 8.8% |
| 26 | Baltimore | 573,243 | 47,018 | 8.2% |
| 27 | Elkton | 15,910 | 1,245 | 7.8% |
| 28 | Salisbury | 33,285 | 2,597 | 7.8% |
| 29 | Mount Airy | 9,805 | 749 | 7.6% |
| 30 | Cambridge | 13,152 | 1,003 | 7.6% |
| 31 | La Plata | 10,683 | 665 | 6.2% |
| 32 | Thurmont | 6,254 | 366 | 5.9% |
| 33 | Havre de Grace | 14,994 | 842 | 5.6% |
| 34 | Taneytown | 7,932 | 295 | 3.7% |
| 35 | Cheste | 5,594 | 188 | 3.4% |
| 36 | Chesapeake Beach | 6,456 | 209 | 3.2% |
| 37 | Cumberland | 18,804 | 460 | 2.4% |
| 38 | Frostburg | 6,977 | 143 | 2.0% |
| 39 | Hampstead | 6,251 | 87 | 1.4% |
Source: U.S. Census ACS 2020-2024. 39 cities with more than 5,000 residents.
Summary
Summary: Hispanic or Latino Populations Across Maryland
According to the most recent data, this is an accurate list if you’re looking for a breakdown of Latino populations for each place across Maryland.
The most Hispanic/Latino cities in Maryland are Riverdale Park, Bladensburg, Hyattsville, Mount Rainier, New Carrollton, Gaithersburg, Laurel, Frederick, Glenarden, and Greenbelt.


