Most Hispanic/Latino cities in Oregon research summary. We used Saturday Night Science to analyze Oregon’s most recent Census data to determine the most Hispanic/Latino cities based on the percentage of Hispanic/Latino residents.
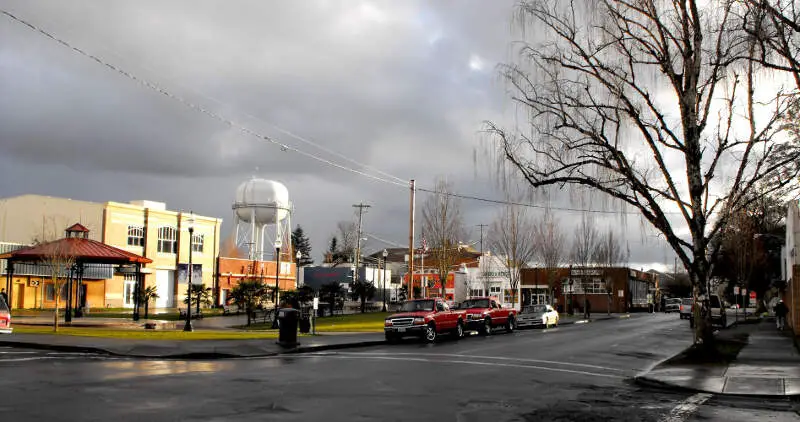
61.4% Hispanic · #1 most Hispanic in Oregon
Woodburn is a city in Marion County, Oregon, United States. Incorporated in 1889, the community had been platted in 1871 after the arrival of the railroad. The city is located in the northern end of the Willamette Valley between Portland and Salem. Interstate 5 connects it to major cities to the north and south. Oregon routes 211, 214, 219, and 99E also serve the city, as do Union Pacific and Willamette Valley Railway freight rail lines.
Data | Crime | Cost of living | Movers
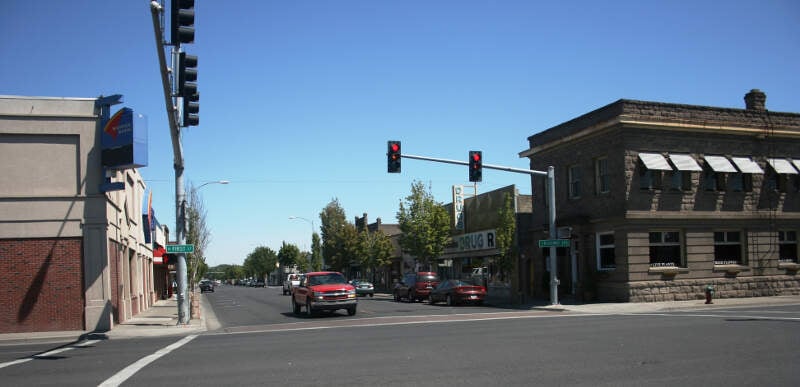
54.5% Hispanic · #2 most Hispanic in Oregon
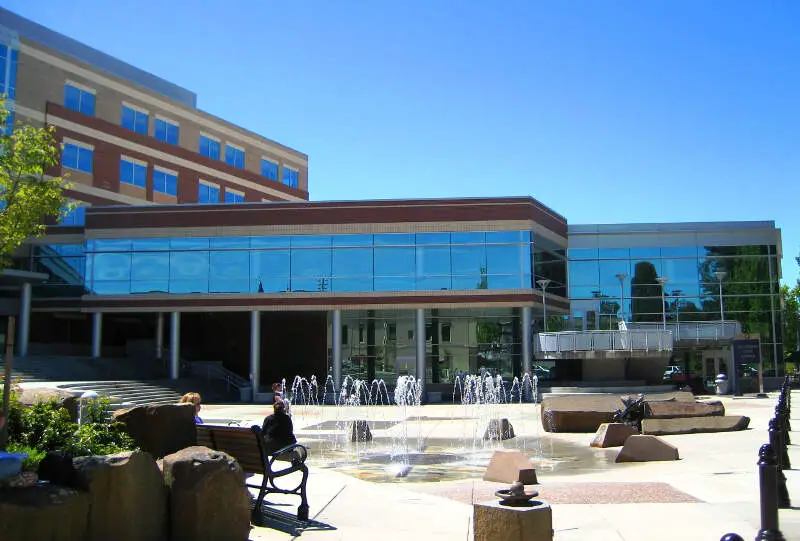
Hermiston is a city in Umatilla County, Oregon, United States. The population of 17,985 makes it the largest city in Eastern Oregon. Hermiston is the largest, and fastest-growing, city in the Hermiston-Pendleton Micropolitan Statistical Area, the eighth largest Core Based Statistical Area in Oregon with a combined population of 87,062 at the 2010 census. Hermiston sits near the junction of I-82 and I-84, & is 7 miles south of the Columbia River, Lake Wallula, and the McNary Dam. The Hermiston area has become a transportation and logistics hub due to the proximity of the I-82 and I-84 interchange, and central location between the major Pacific Northwest metropolitan areas. The city is also known for its watermelons, which are part of its branding.
Data | Crime | Cost of living | Movers
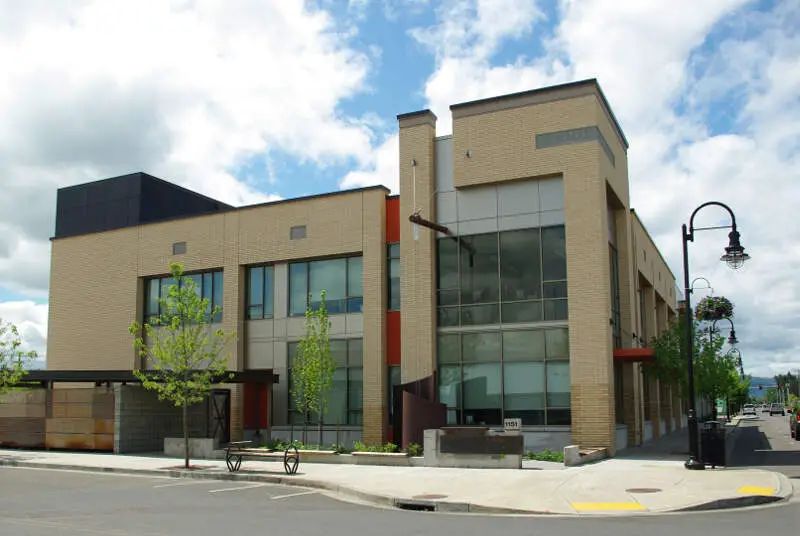
51.3% Hispanic · #3 most Hispanic in Oregon
Cornelius is a city in Washington County, Oregon, United States. Located in the Portland metropolitan area, the city’s population was 11,869 at the 2010 census. The city lies along Tualatin Valley Highway between Forest Grove to the west and Hillsboro to the east. Cornelius was incorporated in 1893 and is named for founder Thomas R. Cornelius.
Data | Crime | Cost of living | Movers

45.4% Hispanic · #4 most Hispanic in Oregon
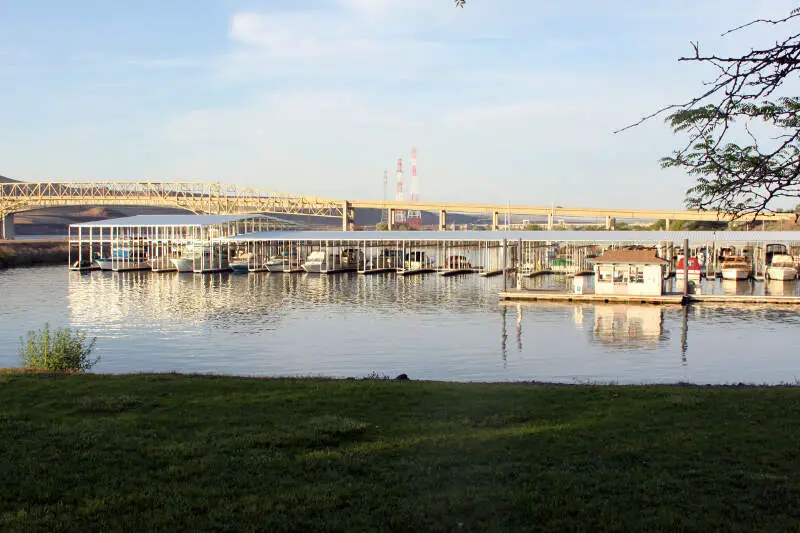
Ontario is the largest city in Malheur County, Oregon, United States. It lies along the Snake River at the Idaho border. The population was 11,366 at the 2010 census. The city is the largest community in the region of far eastern Oregon, also known as the Western Treasure Valley.
Data | Crime | Cost of living | Movers
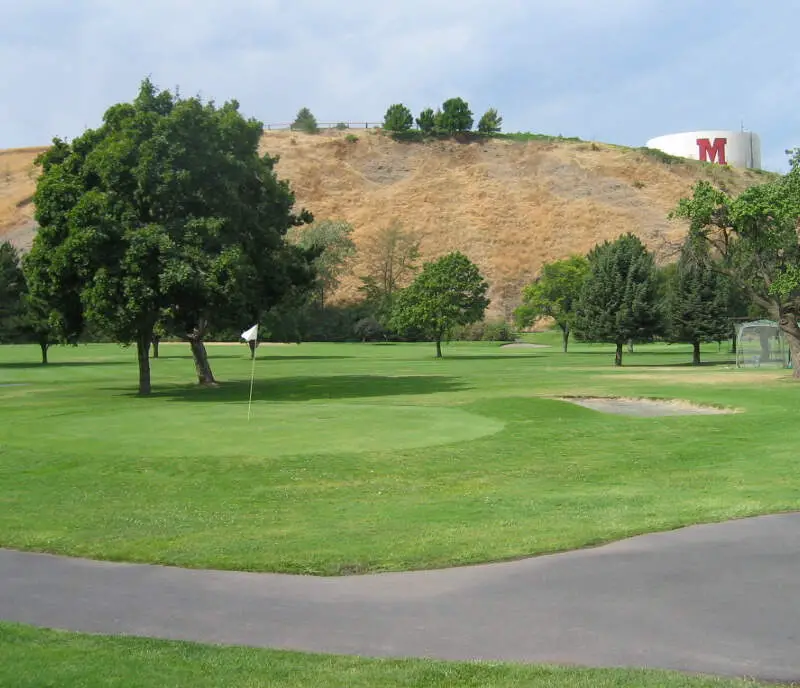
41.2% Hispanic · #5 most Hispanic in Oregon
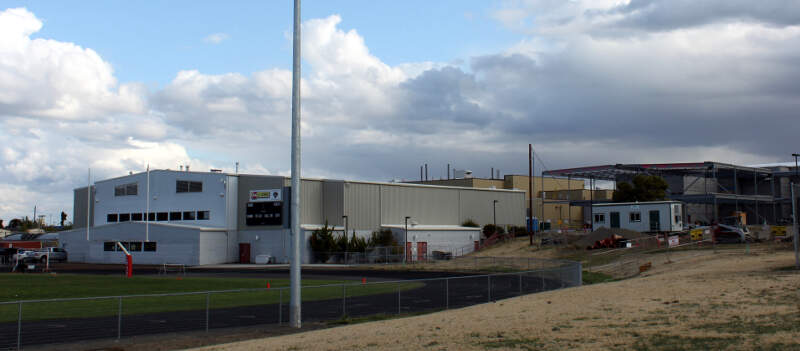
Milton-Freewater is a city in Umatilla County, Oregon, United States. The city received its current name in 1951 when the neighboring rival cities of Milton and Freewater voted to merge. The population was 7,050 at the 2010 census. It is part of the Pendleton-Hermiston Micropolitan Statistical Area. Milton-Freewater is home to a growing wine industry.
Data | Crime | Cost of living | Movers
39.0% Hispanic · #6 most Hispanic in Oregon
Umatilla is a city in Umatilla County, Oregon, United States. It is named for the Umatilla River, which enters the Columbia River on the side of the city. The river is named after the Umatilla Tribe. The city is on the south side of the Columbia River along U.S. Route 730 and I-82.
Data | Crime | Cost of living | Movers
38.5% Hispanic · #7 most Hispanic in Oregon
Independence is a city in Polk County, Oregon, United States, on the west bank of the Willamette River along Oregon Route 51, and east of nearby Monmouth. It is part of the Salem Metropolitan Statistical Area. Thirty square blocks of the oldest part of Independence form the National Register of Historic Places-listed Independence Historic District.
Data | Crime | Cost of living | Movers
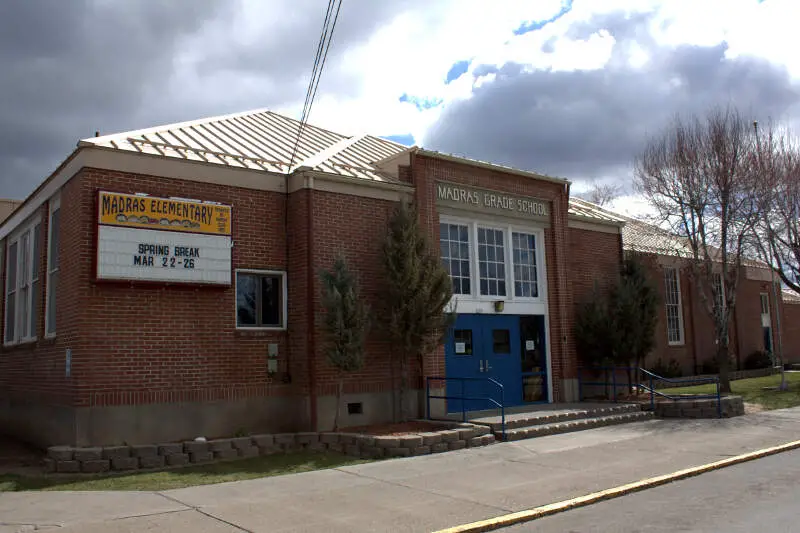
31.9% Hispanic · #8 most Hispanic in Oregon
Madras is a city in Jefferson County, Oregon, United States. Originally called “The Basin” after the circular valley the city is in, it is unclear whether Madras was named in 1903 for the cotton fabric called “Madras” that originated in the city of Madras in Tamil Nadu, India, or from the name of the city itself. The population was 6,046 at the 2010 census. It is the county seat of Jefferson County.
Data | Crime | Cost of living | Movers
31.1% Hispanic · #9 most Hispanic in Oregon
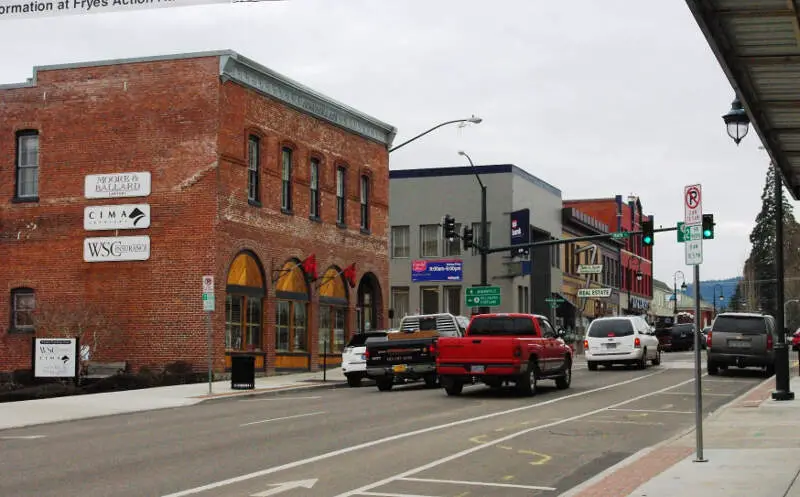
Forest Grove is a city in Washington County, Oregon, United States, 25 miles west of Portland. Originally a small farm town, it is now primarily a bedroom suburb of Portland. Settled in the 1840s, the town was platted in 1850, then incorporated in 1872, making it the first city in Washington County. The population was 21,083 at the 2010 census, an increase of 19.1% over the 2000 figure.
Data | Crime | Cost of living | Movers
25.8% Hispanic · #10 most Hispanic in Oregon
Hillsboro is the fifth-largest city in the State of Oregon and is the county seat of Washington County. Lying in the Tualatin Valley on the west side of the Portland metropolitan area, the city hosts many high-technology companies, such as Intel, that comprise what has become known as the Silicon Forest. At the 2010 Census, the city’s population was 91,611.
Data | Crime | Cost of living | Movers
The receipts
Compare the top ten
Pick a metric. The bars rescale. The red line is Oregon’s statewide median.
On the map
Where Oregon’s Hispanic and Latino communities live
Saturday Night Science
Methodology: How We Determined The Cities In Oregon With The Largest Hispanic Population For 2026
We used Saturday Night Science to compare data on race from the US Census for every city in Oregon.
Oregon’s most recently available data comes from the 2020-2024 American Community Survey.
Specifically, we looked at table B03002: Hispanic OR LATINO ORIGIN BY RACE. Here are the category names as defined by the Census:
- Hispanic or Latino
- White alone*
- Black or African American alone*
- American Indian and Alaska Native alone*
- Asian alone*
- Native Hawaiian and Other Pacific Islander alone*
- Some other race alone*
- Two or more races*
Our particular column of interest here was the number of people who identified as Hispanic or Latino.
We limited our analysis to places in Oregon with a population greater than 5,000 people. That left us with 73 cities.
We then calculated the percentage of Hispanic or Latino residents in each Oregon city. The percentages ranked from 61.4% to 2.8%.
Finally, we ranked each city based on the percentage of the Hispanic or Latino population, with a higher percentage being more Hispanic or Latino. Woodburn was the most Hispanic or Latino, while Sutherlin was the least Hispanic or Latino city.
We updated this article for 2026. This article represents our eleventh time ranking the cities in Oregon with the largest Hispanic/Latino population.
The full plate
Cities In Oregon By Hispanic Population
Click any column to sort. Search by city name.
| Rank | City | Population | Hispanic Population | % Hispanic |
|---|---|---|---|---|
| 1 | Woodburn | 27,875 | 17,127 | 61.4% |
| 2 | Hermiston | 19,546 | 10,656 | 54.5% |
| 3 | Cornelius | 14,255 | 7,319 | 51.3% |
| 4 | Ontario | 11,842 | 5,378 | 45.4% |
| 5 | Milton-Freewater | 7,036 | 2,897 | 41.2% |
| 6 | Umatilla | 7,508 | 2,927 | 39.0% |
| 7 | Independence | 10,199 | 3,927 | 38.5% |
| 8 | Madras | 7,676 | 2,447 | 31.9% |
| 9 | Forest Grove | 26,529 | 8,243 | 31.1% |
| 10 | Hillsboro | 108,231 | 27,971 | 25.8% |
| 11 | Salem | 178,865 | 45,440 | 25.4% |
| 12 | Fairview | 10,735 | 2,561 | 23.9% |
| 13 | Tualatin | 27,763 | 6,488 | 23.4% |
| 14 | Keizer | 39,082 | 9,119 | 23.3% |
| 15 | Hood River | 8,361 | 1,934 | 23.1% |
| 16 | The Dalles | 15,917 | 3,412 | 21.4% |
| 17 | Gresham | 112,378 | 23,672 | 21.1% |
| 18 | McMinnville | 34,596 | 6,930 | 20.0% |
| 19 | Sheridan | 6,339 | 1,264 | 19.9% |
| 20 | Monmouth | 11,428 | 2,274 | 19.9% |
| 21 | Beaverton | 97,812 | 18,867 | 19.3% |
| 22 | Medford | 86,315 | 15,510 | 18.0% |
| 23 | Central Point | 19,216 | 3,358 | 17.5% |
| 24 | Canby | 18,134 | 3,053 | 16.8% |
| 25 | Newberg | 26,066 | 4,379 | 16.8% |
| 26 | Albany | 56,839 | 9,390 | 16.5% |
| 27 | Astoria | 10,109 | 1,591 | 15.7% |
| 28 | Redmond | 36,092 | 5,656 | 15.7% |
| 29 | Wilsonville | 26,974 | 4,164 | 15.4% |
| 30 | Stayton | 8,292 | 1,268 | 15.3% |
| 31 | Springfield | 61,499 | 9,276 | 15.1% |
| 32 | Klamath Falls | 22,115 | 3,318 | 15.0% |
| 33 | Newport | 10,583 | 1,533 | 14.5% |
| 34 | Tigard | 56,011 | 7,972 | 14.2% |
| 35 | Lincoln City | 9,968 | 1,403 | 14.1% |
| 36 | Silverton | 10,456 | 1,421 | 13.6% |
| 37 | Talent | 6,254 | 821 | 13.1% |
| 38 | Troutdale | 15,923 | 2,014 | 12.6% |
| 39 | Portland | 641,165 | 76,761 | 12.0% |
| 40 | Pendleton | 16,950 | 1,998 | 11.8% |
| 41 | Prineville | 11,470 | 1,350 | 11.8% |
| 42 | Eugene | 179,591 | 21,021 | 11.7% |
| 43 | Dallas | 17,531 | 1,934 | 11.0% |
| 44 | Grants Pass | 39,311 | 4,320 | 11.0% |
| 45 | Seaside | 7,192 | 779 | 10.8% |
| 46 | Brookings | 6,703 | 724 | 10.8% |
| 47 | Lebanon | 19,344 | 2,077 | 10.7% |
| 48 | Gladstone | 11,977 | 1,260 | 10.5% |
| 49 | Corvallis | 59,960 | 6,102 | 10.2% |
| 50 | Roseburg | 23,778 | 2,375 | 10.0% |
| 51 | Cottage Grove | 10,698 | 1,056 | 9.9% |
| 52 | Sherwood | 20,307 | 1,953 | 9.6% |
| 53 | St. Helens | 14,258 | 1,327 | 9.3% |
| 54 | Bend | 103,390 | 9,518 | 9.2% |
| 55 | Coos Bay | 15,925 | 1,433 | 9.0% |
| 56 | Milwaukie | 21,392 | 1,882 | 8.8% |
| 57 | Ashland | 21,259 | 1,856 | 8.7% |
| 58 | Happy Valley | 26,738 | 2,291 | 8.6% |
| 59 | Scappoose | 8,179 | 691 | 8.4% |
| 60 | Molalla | 10,186 | 846 | 8.3% |
| 61 | Junction City | 6,947 | 563 | 8.1% |
| 62 | Winston | 5,690 | 459 | 8.1% |
| 63 | Eagle Point | 9,839 | 762 | 7.7% |
| 64 | North Bend | 10,171 | 756 | 7.4% |
| 65 | West Linn | 26,935 | 1,988 | 7.4% |
| 66 | Oregon City | 37,755 | 2,647 | 7.0% |
| 67 | Baker City | 10,210 | 647 | 6.3% |
| 68 | La Grande | 13,058 | 785 | 6.0% |
| 69 | Lake Oswego | 40,381 | 2,287 | 5.7% |
| 70 | Florence | 9,482 | 485 | 5.1% |
| 71 | Sandy | 12,854 | 641 | 5.0% |
| 72 | Sweet Home | 10,078 | 409 | 4.1% |
| 73 | Sutherlin | 8,599 | 241 | 2.8% |
Source: U.S. Census ACS 2020-2024. 73 cities with more than 5,000 residents.
Summary
Summary: Hispanic or Latino Populations Across Oregon
According to the most recent data, this is an accurate list if you’re looking for a breakdown of Latino populations for each place across Oregon.
The most Hispanic/Latino cities in Oregon are Woodburn, Hermiston, Cornelius, Ontario, Milton-Freewater, Umatilla, Independence, Madras, Forest Grove, and Hillsboro.


