
Most Hispanic/Latino cities in Texas research summary. We used Saturday Night Science to analyze Texas’s most recent Census data to determine the most Hispanic/Latino cities based on the percentage of Hispanic/Latino residents. Here are the results of our analysis:
-
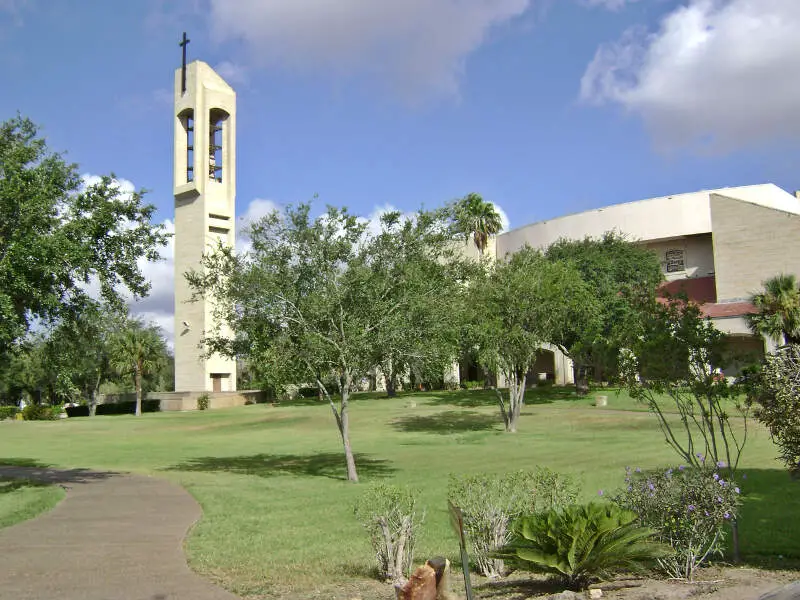
The most Hispanic/Latino city in Texas is Hidalgo, based on the most recent Census data.
-
Hidalgo is 98.72% Hispanic/Latino.
-
The least Hispanic/Latino city in Texas is Highland Park.
-
Highland Park is 4.41% Hispanic/Latino.
-
Texas is 39.7% Hispanic/Latino.
-
Texas is the 3rd most Hispanic/Latino state in the United States.
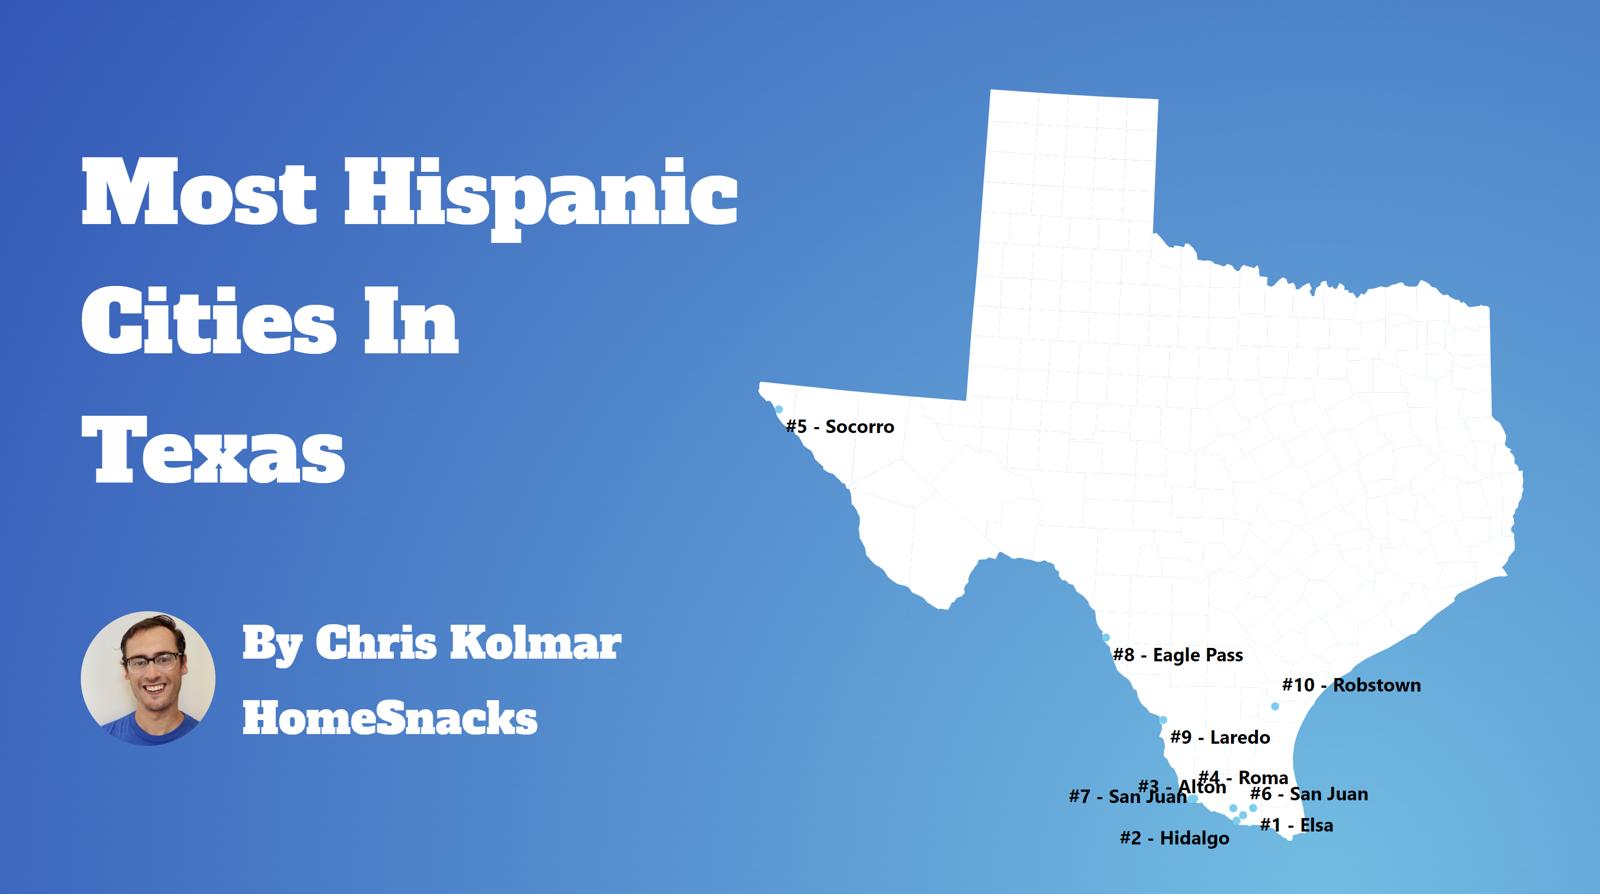
Table Of Contents: Top Ten | Methodology | Summary | Table
What’s the city in Texas with the largest Hispanic/Latino population? Hidalgo took the number one overall spot for the largest Hispanic population in Texas for 2026.
Continue below to see how we crunched the numbers and how your town ranked.
To see where Texas ranked as a state on diversity, we have a ranking of the most diverse states in America.
And if you already knew these places were Hispanic, check out the best places to live in Texas or the safest places in Texas.

/10
Population: 14,498
# Of Hispanic/Latino Residents: 14,313
% Hispanic/Latino: 98.72%
More on Hidalgo: Data | Crime | Cost Of Living | Movers

/10
Population: 5,697
# Of Hispanic/Latino Residents: 5,602
% Hispanic/Latino: 98.33%
More on Elsa: Data | Crime | Cost Of Living | Movers

/10
Population: 20,214
# Of Hispanic/Latino Residents: 19,568
% Hispanic/Latino: 96.8%
More on Alton: Data | Crime | Cost Of Living | Movers


/10
Population: 11,545
# Of Hispanic/Latino Residents: 11,151
% Hispanic/Latino: 96.59%
More on Roma: Data | Crime | Cost Of Living | Movers

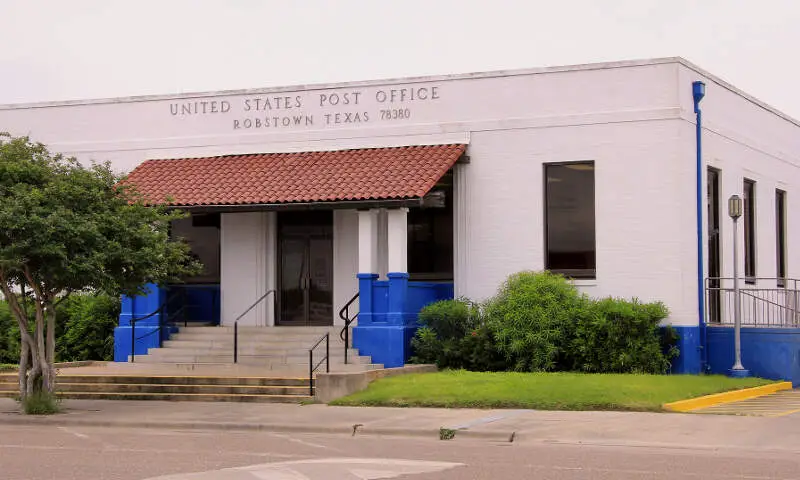
/10
Population: 10,236
# Of Hispanic/Latino Residents: 9,881
% Hispanic/Latino: 96.53%
More on Robstown: Data | Crime | Cost Of Living | Movers

/10
Population: 36,149
# Of Hispanic/Latino Residents: 34,886
% Hispanic/Latino: 96.51%
More on San Juan: Data | Crime | Cost Of Living | Movers
/10
Population: 15,396
# Of Hispanic/Latino Residents: 14,778
% Hispanic/Latino: 95.99%
More on Rio Grande City: Data | Crime | Cost Of Living | Movers

/10
Population: 37,123
# Of Hispanic/Latino Residents: 35,344
% Hispanic/Latino: 95.21%
More on Socorro: Data | Crime | Cost Of Living | Movers

/10
Population: 257,619
# Of Hispanic/Latino Residents: 244,911
% Hispanic/Latino: 95.07%
More on Laredo: Data | Crime | Cost Of Living | Movers

/10
Population: 80,333
# Of Hispanic/Latino Residents: 76,062
% Hispanic/Latino: 94.68%
More on Pharr: Data | Crime | Cost Of Living | Movers
Methodology: How We Determined The Cities In Texas With The Largest Hispanic Population For 2026
We used Saturday Night Science to compare data on race from the US Census for every city in Texas.
Texas’s most recently available data comes from the 2020-2024 American Community Survey.
Specifically, we looked at table B03002: Hispanic OR LATINO ORIGIN BY RACE. Here are the category names as defined by the Census:
- Hispanic or Latino
- White alone*
- Black or African American alone*
- American Indian and Alaska Native alone*
- Asian alone*
- Native Hawaiian and Other Pacific Islander alone*
- Some other race alone*
- Two or more races*
Our particular column of interest here was the number of people who identified as Hispanic or Latino.
We limited our analysis to places in Texas with a population greater than 5,000 people. That left us with 324 cities.
We then calculated the percentage of Hispanic or Latino residents in each Texas city. The percentages ranked from 98.7% to 4.4%.
Finally, we ranked each city based on the percentage of the Hispanic or Latino population, with a higher score being more Hispanic or Latino than a lower score. Hidalgo was the most Hispanic or Latino, while Highland Park was the least Hispanic or Latino city.
We updated this article for 2026. This article represents our eleventh time ranking the cities in Texas with the largest Hispanic/Latino population.
Read on for more information on how the cities in Texas ranked by population of Hispanic or Latino residents or, for a more general take on diversity in America, head over to our ranking of the most diverse cities in America.
Summary: Hispanic or Latino Populations Across Texas
According to the most recent data, this is an accurate list if you’re looking for a breakdown of Latino populations for each place across Texas.
The most Hispanic/Latino cities in Texas are Hidalgo, Elsa, Alton, Roma, Robstown, San Juan, Rio Grande City, Socorro, Laredo, and Pharr.
If you’re curious enough, here are the least Hispanic or Latino places in Texas:
- Highland Park
- Murphy
- Gun Barrel City
For more Texas reading, check out:
Most Hispanic Cities In Texas
| Rank | City | Population | Hispanic Pop. | % Hispanic |
|---|---|---|---|---|
| 1 | Hidalgo | 14,498 | 14,313 | 98.72% |
| 2 | Elsa | 5,697 | 5,602 | 98.33% |
| 3 | Alton | 20,214 | 19,568 | 96.8% |
| 4 | Roma | 11,545 | 11,151 | 96.59% |
| 5 | Robstown | 10,236 | 9,881 | 96.53% |
| 6 | San Juan | 36,149 | 34,886 | 96.51% |
| 7 | Rio Grande City | 15,396 | 14,778 | 95.99% |
| 8 | Socorro | 37,123 | 35,344 | 95.21% |
| 9 | Laredo | 257,619 | 244,911 | 95.07% |
| 10 | Pharr | 80,333 | 76,062 | 94.68% |
| 11 | Eagle Pass | 28,339 | 26,700 | 94.22% |
| 12 | Brownsville | 189,177 | 177,847 | 94.01% |
| 13 | Crystal City | 6,159 | 5,777 | 93.8% |
| 14 | San Benito | 24,709 | 22,951 | 92.89% |
| 15 | Palmview | 15,921 | 14,692 | 92.28% |
| 16 | Mercedes | 16,733 | 15,416 | 92.13% |
| 17 | South Houston | 16,033 | 14,750 | 92.0% |
| 18 | Donna | 16,833 | 15,439 | 91.72% |
| 19 | Horizon City | 23,668 | 21,461 | 90.68% |
| 20 | Jacinto City | 9,432 | 8,548 | 90.63% |
| 21 | La Feria | 6,891 | 6,222 | 90.29% |
| 22 | Galena Park | 10,487 | 9,420 | 89.83% |
| 23 | Pearsall | 9,045 | 8,063 | 89.14% |
| 24 | Los Fresnos | 8,291 | 7,327 | 88.37% |
| 25 | Weslaco | 42,229 | 37,110 | 87.88% |
| 26 | Mission | 87,038 | 76,397 | 87.77% |
| 27 | Mcallen | 145,385 | 126,523 | 87.03% |
| 28 | Raymondville | 10,185 | 8,863 | 87.02% |
| 29 | Edinburg | 104,550 | 90,694 | 86.75% |
| 30 | Del Rio | 34,668 | 29,575 | 85.31% |
| 31 | Alamo | 20,255 | 17,169 | 84.76% |
| 32 | Hereford | 14,840 | 12,540 | 84.5% |
| 33 | Alice | 17,707 | 14,849 | 83.86% |
| 34 | Harlingen | 72,087 | 59,314 | 82.28% |
| 35 | El Paso | 680,130 | 552,274 | 81.2% |
| 36 | Port Isabel | 5,111 | 4,039 | 79.03% |
| 37 | Uvalde | 15,417 | 12,074 | 78.32% |
| 38 | Fort Stockton | 8,278 | 6,332 | 76.49% |
| 39 | Sinton | 5,584 | 4,220 | 75.57% |
| 40 | Beeville | 13,412 | 9,966 | 74.31% |
| 41 | Kermit | 5,689 | 4,219 | 74.16% |
| 42 | Kingsville | 24,994 | 18,245 | 73.0% |
| 43 | Muleshoe | 5,667 | 4,081 | 72.01% |
| 44 | Floresville | 8,007 | 5,685 | 71.0% |
| 45 | Pasadena | 149,433 | 105,892 | 70.86% |
| 46 | Lamesa | 8,393 | 5,750 | 68.51% |
| 47 | River Oaks | 7,584 | 4,977 | 65.62% |
| 48 | Plainview | 19,711 | 12,865 | 65.27% |
| 49 | Brownfield | 8,738 | 5,683 | 65.04% |
| 50 | San Antonio | 1,479,835 | 955,906 | 64.6% |
| 51 | Gonzales | 7,200 | 4,517 | 62.74% |
| 52 | Odessa | 115,322 | 72,314 | 62.71% |
| 53 | Port Lavaca | 11,358 | 7,117 | 62.66% |
| 54 | Corpus Christi | 317,419 | 196,942 | 62.04% |
| 55 | Kirby | 8,117 | 4,992 | 61.5% |
| 56 | Perryton | 8,585 | 5,261 | 61.28% |
| 57 | Hondo | 8,713 | 5,252 | 60.28% |
| 58 | Littlefield | 5,822 | 3,502 | 60.15% |
| 59 | Everman | 6,106 | 3,667 | 60.06% |
| 60 | Monahans | 7,452 | 4,473 | 60.02% |
| 61 | Freeport | 10,621 | 6,288 | 59.2% |
| 62 | Levelland | 12,466 | 7,326 | 58.77% |
| 63 | Seguin | 33,754 | 19,752 | 58.52% |
| 64 | Luling | 5,531 | 3,233 | 58.45% |
| 65 | Rosenberg | 40,646 | 23,741 | 58.41% |
| 66 | Yoakum | 5,846 | 3,396 | 58.09% |
| 67 | Dumas | 14,452 | 8,393 | 58.08% |
| 68 | Clute | 10,715 | 6,203 | 57.89% |
| 69 | Pleasanton | 11,011 | 6,309 | 57.3% |
| 70 | Dalhart | 7,902 | 4,520 | 57.2% |
| 71 | Bay City | 17,730 | 10,096 | 56.94% |
| 72 | Leon Valley | 11,446 | 6,500 | 56.79% |
| 73 | Humble | 16,521 | 9,199 | 55.68% |
| 74 | Mount Pleasant | 16,136 | 8,847 | 54.83% |
| 75 | Andrews | 13,468 | 7,338 | 54.48% |
| 76 | Slaton | 5,761 | 3,122 | 54.19% |
| 77 | Helotes | 9,630 | 5,184 | 53.83% |
| 78 | Victoria | 65,625 | 35,210 | 53.65% |
| 79 | Big Spring | 23,975 | 12,766 | 53.25% |
| 80 | Balch Springs | 27,255 | 14,489 | 53.16% |
| 81 | Lockhart | 15,326 | 8,056 | 52.56% |
| 82 | Kyle | 56,823 | 29,459 | 51.84% |
| 83 | Baytown | 85,205 | 44,015 | 51.66% |
| 84 | Seagoville | 19,352 | 9,919 | 51.26% |
| 85 | Bellmead | 10,566 | 5,408 | 51.18% |
| 86 | Alpine | 6,014 | 2,985 | 49.63% |
| 87 | Seminole | 7,184 | 3,562 | 49.58% |
| 88 | Snyder | 11,241 | 5,532 | 49.21% |
| 89 | Richmond | 12,582 | 6,160 | 48.96% |
| 90 | El Campo | 12,202 | 5,874 | 48.14% |
| 91 | Cameron | 5,416 | 2,598 | 47.97% |
| 92 | Willis | 6,878 | 3,279 | 47.67% |
| 93 | Cuero | 8,165 | 3,866 | 47.35% |
| 94 | Elgin | 11,563 | 5,420 | 46.87% |
| 95 | Grand Prairie | 201,883 | 94,084 | 46.6% |
| 96 | Hempstead | 6,137 | 2,860 | 46.6% |
| 97 | Aransas Pass | 8,972 | 4,148 | 46.23% |
| 98 | Midland | 136,640 | 62,712 | 45.9% |
| 99 | Garland | 246,844 | 112,837 | 45.71% |
| 100 | Ennis | 22,588 | 10,295 | 45.58% |