
Most Native American places in Georgia research summary. We used Saturday Night Science to research the Georgia cities with the highest percentage of Native American residents for 2025. The data comes from the American Community Survey 2019-2023 vintage, which breaks down race by origin.
-
The city with the highest percentage of Native Americans is Dahlonega. 0.56% of people in Dahlonega are Native Americans.
-
The city with the lowest percentage of Native Americans is Conyers. 0.00% of people in Conyers are Native American.
-
The city with the most Native Americans is Atlanta. 671 people in Atlanta are Native American.
-
The city with the fewest Native Americans is Conyers. 0 people in Conyers are Native American.
-
The United States has 1,751,338 Native Americans and is 0.53% Native American.
Table Of Contents: Top Ten | Methodology | Summary | Table
The 10 Cities In Georgia With The Largest Native American Population For 2025
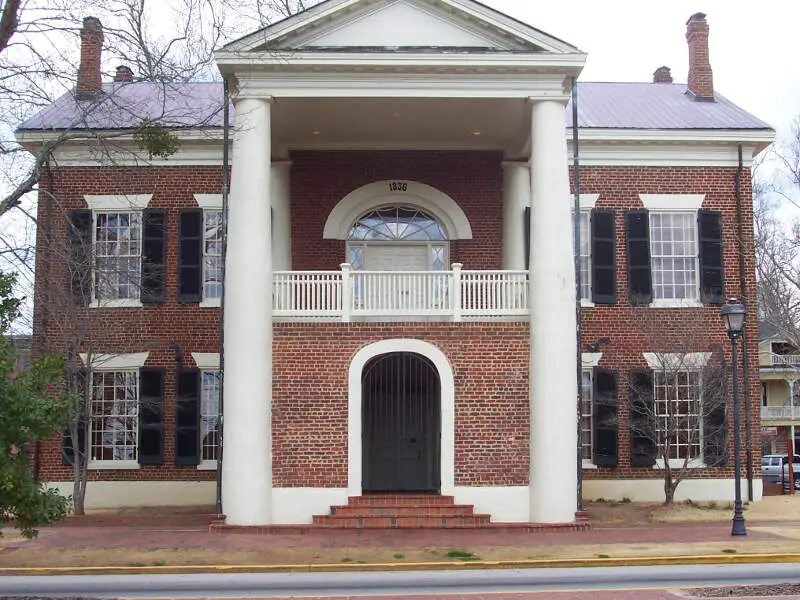
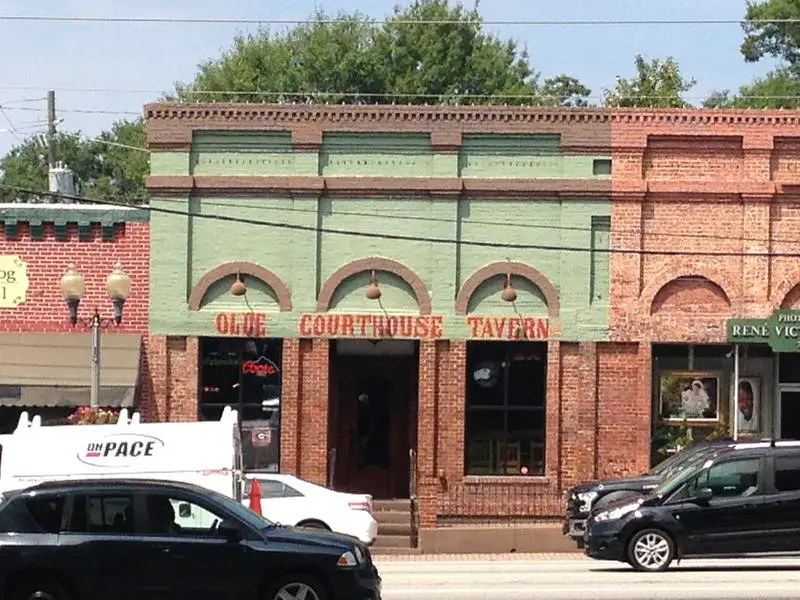
Which city in Georgia had the largest Native American population? The place with the largest Native American population in Georgia for 2025 is Dahlonega. 0.56 of Dahlonega identify as Native American.
To see where Georgia ranked as a state on diversity, we have a ranking of the most diverse states in America.
And if you already knew these places were Native American, check out the best places to live in Georgia or the most diverse places in Georgia.
Read below to see how we crunched the numbers and how your town ranked.
Cities In Georgia With The Largest Native American Population For 2025

/10
Population: 7,194
# Of Native American Residents: 40
% Native American: 0.56%
More on Dahlonega: Data


/10
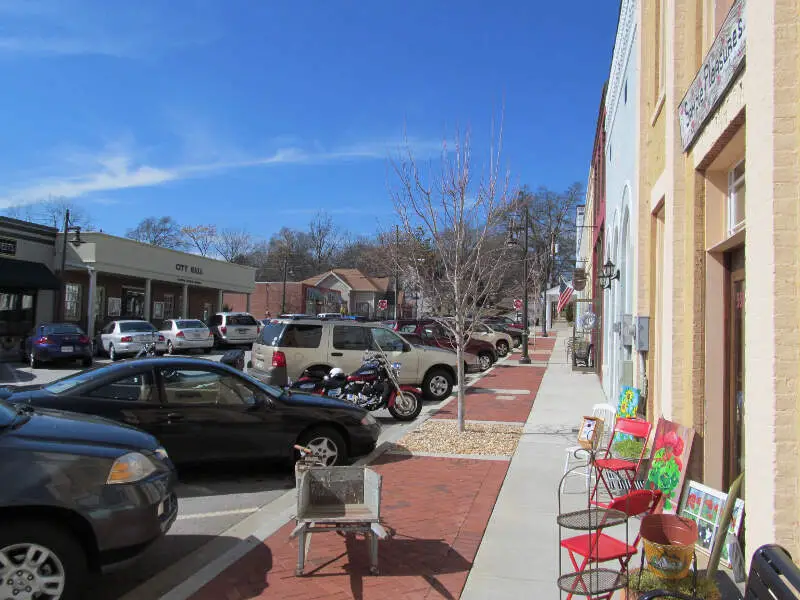
Population: 10,967
# Of Native American Residents: 56
% Native American: 0.51%
More on Lovejoy: Data

/10
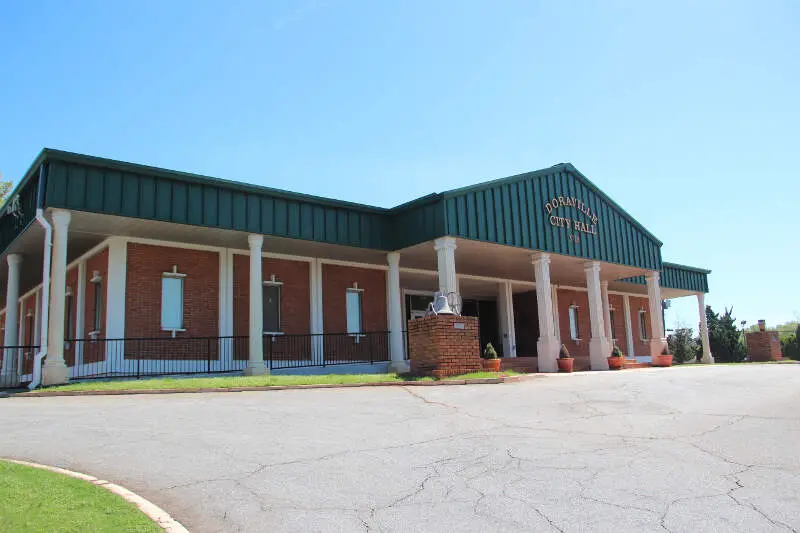
Population: 10,738
# Of Native American Residents: 49
% Native American: 0.46%
More on Doraville: Data
/10
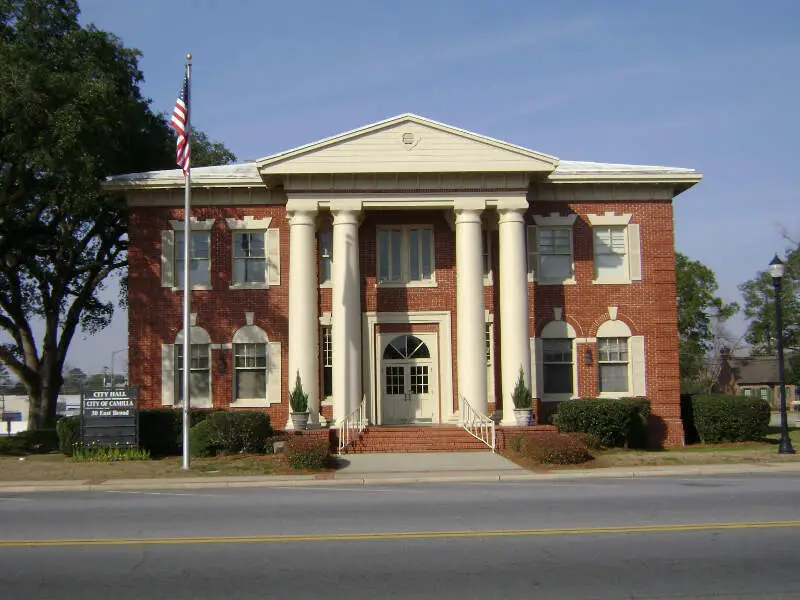
Population: 5,158
# Of Native American Residents: 21
% Native American: 0.41%
More on Camilla: Data

/10
Population: 9,181
# Of Native American Residents: 37
% Native American: 0.4%
More on Cusseta-Chattahoochee County Unified Government: Data

/10
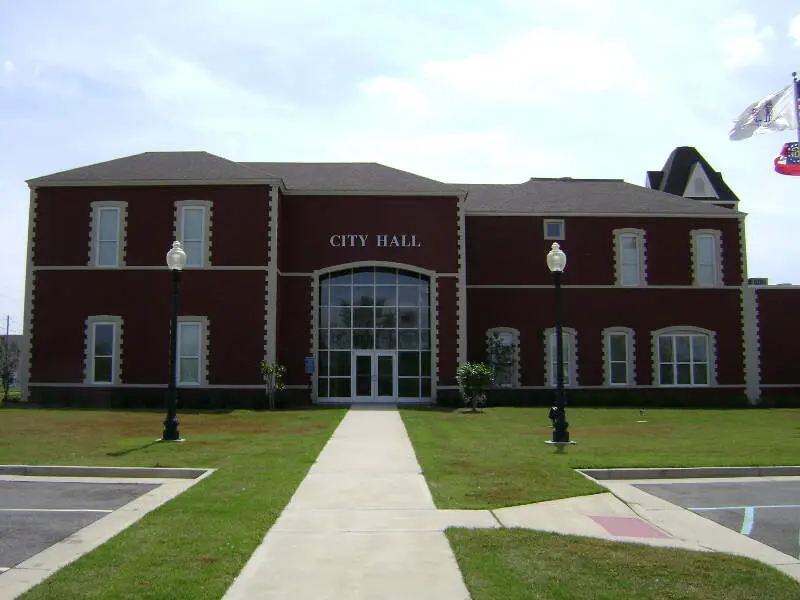
Population: 8,962
# Of Native American Residents: 29
% Native American: 0.32%
More on Fitzgerald: Data

/10
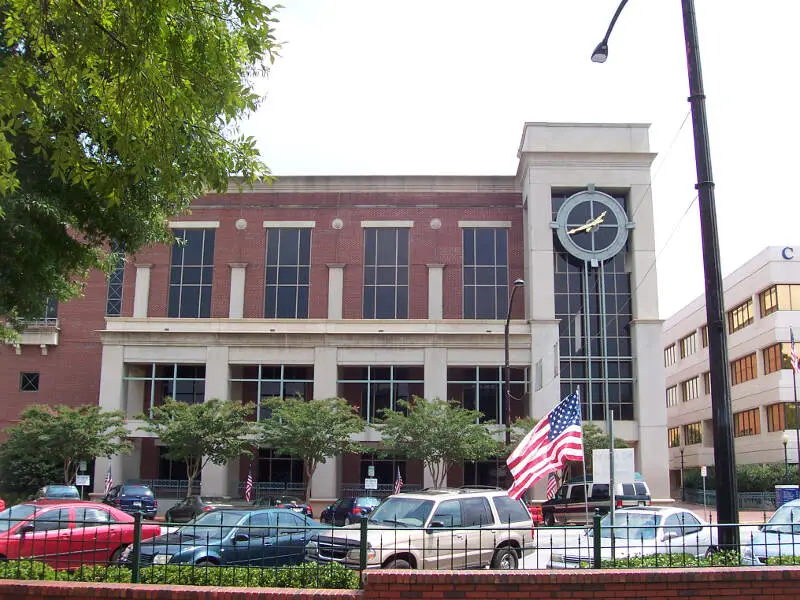
Population: 19,364
# Of Native American Residents: 62
% Native American: 0.32%
More on Fayetteville: Data

/10
Population: 10,286
# Of Native American Residents: 24
% Native American: 0.23%
More on Flowery Branch: Data

/10
Population: 61,773
# Of Native American Residents: 136
% Native American: 0.22%
More on Marietta: Data

/10
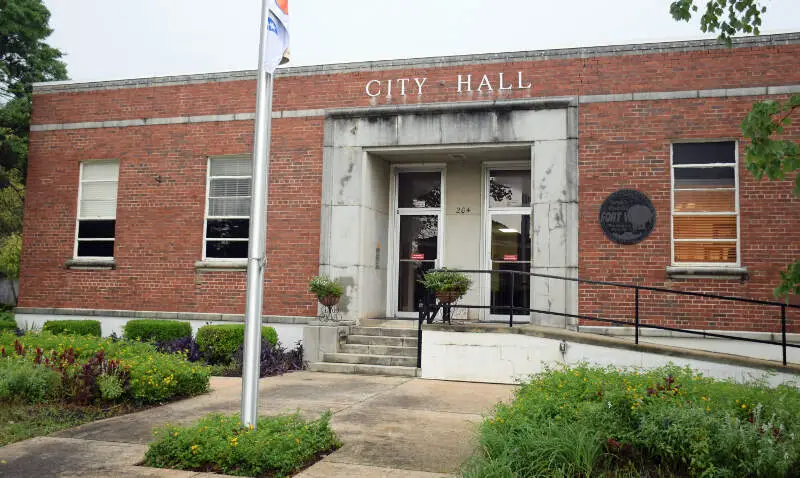
Population: 8,808
# Of Native American Residents: 18
% Native American: 0.2%
More on Fort Valley: Data
Methodology: How We Determined The Cities In Georgia With The Largest Native American Population For 2025
We still believe in the accuracy of data — especially from the Census. So that’s where we went to get the race breakdown across Georgia.
We used Saturday Night Science to analyze the Census’s most recently available data, the 2019-2023 American Community Survey data.
Specifically, we looked at table B03002: Hispanic OR LATINO ORIGIN BY RACE. Here are the category names as defined by the Census:
- Hispanic or Latino
- White alone*
- Black or African American alone*
- American Indian and Alaska Native alone*
- Asian alone*
- Native Hawaiian and Other Pacific Islander alone*
- Some other race alone*
- Two or more races*
Our particular column of interest here was the number of people identifying as American Indian and Alaska Native alone.
We limited our analysis to places with a population greater than 5,000 people. That left us with 121 cities.
We then calculated the percentage of residents that are American Indian and Alaska Native. The percentages ranked from 0.56 to 0.00.
Finally, we ranked each city based on the percentage of the American Indian and Alaska Native population, with a higher score being more American Indian and Alaska Native than a lower score. Dahlonega took the distinction of being the most American Indian and Alaska Native, while Conyers was the least Native American city.
We updated this article for 2025. This article is our tenth time ranking the cities in Georgia with the largest Native American population.
Summary: Native American Populations Across Georgia
If you’re looking for a breakdown of Native American populations across Georgia according to the most recent data, this is an accurate list.
The most Native American cities in Georgia are Dahlonega, Lovejoy, Doraville, Camilla, Cusseta-Chattahoochee County unified government, Fitzgerald, Fayetteville, Flowery Branch, Marietta, and Fort Valley.
If you’re curious enough, here are the least Native American places in Georgia:
- Conyers
- Snellville
- College Park
For more Georgia reading, check out:
- Best Places To Raise A Family In Georgia
- Richest Cities In Georgia
- Cheapest Places To Live In Georgia
Most Native American Places In Georgia
| Rank | City | Population | Native American Population | % Native American |
|---|---|---|---|---|
| 1 | Dahlonega | 7,194 | 40 | 0.56% |
| 2 | Lovejoy | 10,967 | 56 | 0.51% |
| 3 | Doraville | 10,738 | 49 | 0.46% |
| 4 | Camilla | 5,158 | 21 | 0.41% |
| 5 | Cusseta-Chattahoochee County Unified Government | 9,181 | 37 | 0.4% |
| 6 | Fitzgerald | 8,962 | 29 | 0.32% |
| 7 | Fayetteville | 19,364 | 62 | 0.32% |
| 8 | Flowery Branch | 10,286 | 24 | 0.23% |
| 9 | Marietta | 61,773 | 136 | 0.22% |
| 10 | Fort Valley | 8,808 | 18 | 0.2% |
| 11 | Thomasville | 18,720 | 37 | 0.2% |
| 12 | Stone Mountain | 6,639 | 13 | 0.2% |
| 13 | Jonesboro | 6,137 | 12 | 0.2% |
| 14 | Decatur | 24,470 | 47 | 0.19% |
| 15 | Norcross | 17,669 | 33 | 0.19% |
| 16 | Auburn | 8,222 | 15 | 0.18% |
| 17 | Locust Grove | 9,931 | 18 | 0.18% |
| 18 | Chamblee | 30,369 | 51 | 0.17% |
| 19 | Canton | 34,587 | 58 | 0.17% |
| 20 | Dallas | 14,440 | 23 | 0.16% |
| 21 | Warner Robins | 81,438 | 129 | 0.16% |
| 22 | Kingsland | 19,101 | 30 | 0.16% |
| 23 | Lagrange | 31,479 | 49 | 0.16% |
| 24 | Athens-Clarke County Unified Government (Balance) | 126,987 | 195 | 0.15% |
| 25 | Douglas | 11,720 | 16 | 0.14% |
| 26 | Pooler | 27,235 | 37 | 0.14% |
| 27 | Atlanta | 499,287 | 671 | 0.13% |
| 28 | Stockbridge | 35,475 | 47 | 0.13% |
| 29 | Richmond Hill | 17,408 | 23 | 0.13% |
| 30 | Peachtree City | 38,977 | 51 | 0.13% |
| 31 | Vidalia | 10,762 | 14 | 0.13% |
| 32 | St. Marys | 18,805 | 24 | 0.13% |
| 33 | Carrollton | 27,058 | 34 | 0.13% |
| 34 | Milton | 41,305 | 49 | 0.12% |
| 35 | Brunswick | 15,248 | 18 | 0.12% |
| 36 | Valdosta | 55,222 | 62 | 0.11% |
| 37 | Roswell | 92,577 | 103 | 0.11% |
| 38 | Lawrenceville | 30,626 | 33 | 0.11% |
| 39 | Cedartown | 10,211 | 11 | 0.11% |
| 40 | Forest Park | 19,619 | 21 | 0.11% |
| 41 | Barnesville | 6,070 | 6 | 0.1% |
| 42 | Dalton | 34,402 | 34 | 0.1% |
| 43 | Johns Creek | 82,115 | 75 | 0.09% |
| 44 | Jesup | 9,863 | 9 | 0.09% |
| 45 | Hapeville | 6,590 | 6 | 0.09% |
| 46 | Hinesville | 35,282 | 30 | 0.09% |
| 47 | Smyrna | 56,285 | 47 | 0.08% |
| 48 | Statesboro | 33,705 | 27 | 0.08% |
| 49 | Cairo | 10,067 | 8 | 0.08% |
| 50 | Alpharetta | 66,355 | 52 | 0.08% |
| 51 | Bainbridge | 14,353 | 11 | 0.08% |
| 52 | Albany | 67,939 | 51 | 0.08% |
| 53 | Lilburn | 14,939 | 11 | 0.07% |
| 54 | Suwanee | 21,811 | 16 | 0.07% |
| 55 | Lafayette | 6,944 | 5 | 0.07% |
| 56 | Columbus | 204,383 | 140 | 0.07% |
| 57 | Augusta-Richmond County Consolidated Government (Balance) | 201,504 | 138 | 0.07% |
| 58 | Garden City | 10,375 | 7 | 0.07% |
| 59 | Sugar Hill | 25,285 | 16 | 0.06% |
| 60 | East Point | 38,233 | 24 | 0.06% |
| 61 | Sandy Springs | 107,198 | 67 | 0.06% |
| 62 | Fort Oglethorpe | 10,332 | 6 | 0.06% |
| 63 | Newnan | 43,510 | 23 | 0.05% |
| 64 | Savannah | 147,546 | 74 | 0.05% |
| 65 | Cordele | 10,107 | 5 | 0.05% |
| 66 | Milledgeville | 16,873 | 8 | 0.05% |
| 67 | Douglasville | 36,284 | 15 | 0.04% |
| 68 | Acworth | 22,370 | 9 | 0.04% |
| 69 | Powder Springs | 17,414 | 7 | 0.04% |
| 70 | Cumming | 7,869 | 3 | 0.04% |
| 71 | Riverdale | 14,866 | 5 | 0.03% |
| 72 | Duluth | 31,958 | 10 | 0.03% |
| 73 | Waycross | 13,813 | 4 | 0.03% |
| 74 | Holly Springs | 17,693 | 5 | 0.03% |
| 75 | Villa Rica | 17,798 | 4 | 0.02% |
| 76 | Woodstock | 36,297 | 5 | 0.01% |
| 77 | Moultrie | 14,545 | 2 | 0.01% |
| 78 | Gainesville | 44,051 | 4 | 0.01% |
| 79 | Kennesaw | 33,627 | 3 | 0.01% |
| 80 | Eatonton | 6,430 | 0 | 0.0% |
| 81 | Toccoa | 9,173 | 0 | 0.0% |
| 82 | Buford | 17,611 | 0 | 0.0% |
| 83 | Bremen | 7,364 | 0 | 0.0% |
| 84 | Swainsboro | 7,561 | 0 | 0.0% |
| 85 | Sylvester | 5,557 | 0 | 0.0% |
| 86 | Thomaston | 9,798 | 0 | 0.0% |
| 87 | Braselton | 14,139 | 0 | 0.0% |
| 88 | Thomson | 6,824 | 0 | 0.0% |
| 89 | Tifton | 17,140 | 0 | 0.0% |
| 90 | Tyrone | 7,803 | 0 | 0.0% |
| 91 | Monroe | 15,336 | 0 | 0.0% |
| 92 | Union City | 27,300 | 0 | 0.0% |
| 93 | Blakely | 5,276 | 0 | 0.0% |
| 94 | Austell | 8,351 | 0 | 0.0% |
| 95 | Hampton | 8,491 | 0 | 0.0% |
| 96 | Americus | 15,910 | 0 | 0.0% |
| 97 | Adel | 5,619 | 0 | 0.0% |
| 98 | Waynesboro | 5,700 | 0 | 0.0% |
| 99 | Winder | 18,847 | 0 | 0.0% |
| 100 | Calhoun | 17,611 | 0 | 0.0% |