Most Native American places in Georgia research summary. We used Saturday Night Science to research the Georgia cities with the highest percentage of Native American residents for 2026. The data comes from the American Community Survey 2020-2024 vintage, which breaks down race by origin.
The city with the highest percentage of Native Americans is Carrollton. 0.56% of people in Carrollton are Native Americans.
The city with the lowest percentage of Native Americans is Fort Oglethorpe. 0.00% of people in Fort Oglethorpe are Native American.
The city with the most Native Americans is Atlanta. 654 people in Atlanta are Native American.
The city with the fewest Native Americans is Fort Oglethorpe. 0 people in Fort Oglethorpe are Native American.
The United States has 1,698,432 Native Americans and is 0.51% Native American.
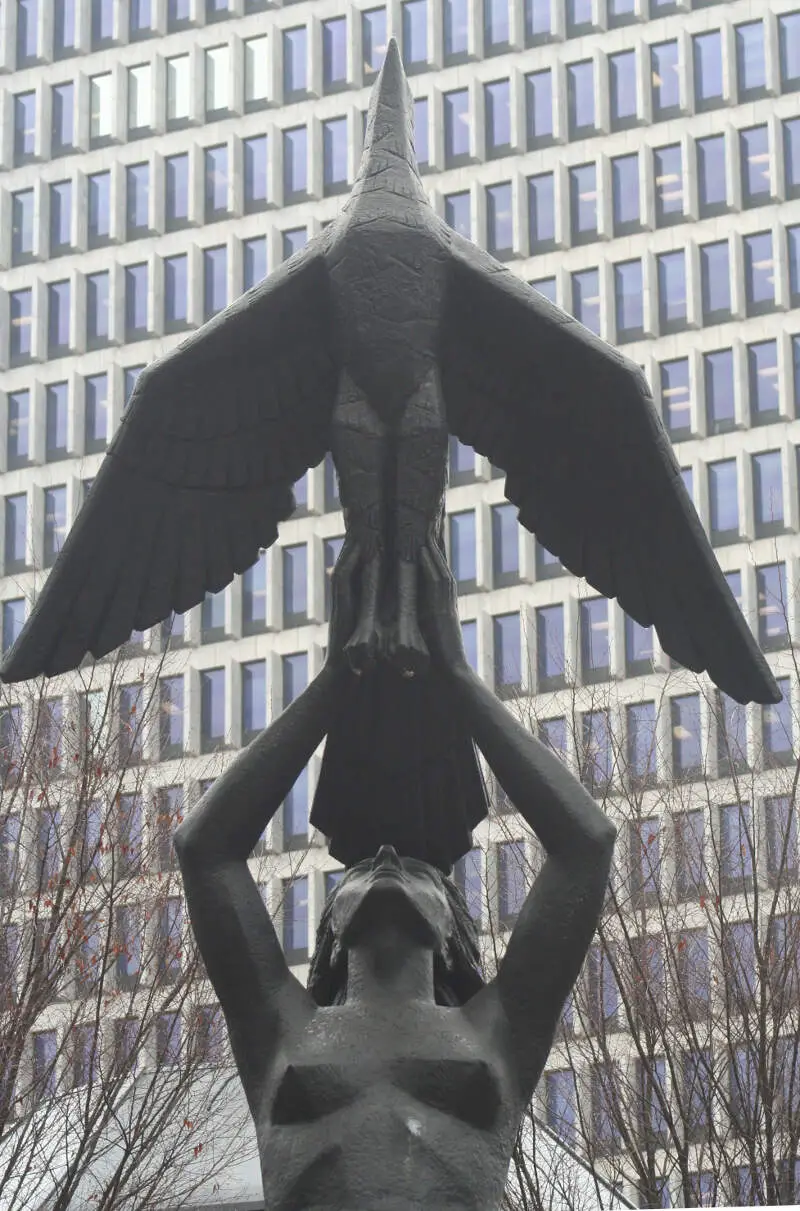
Which city in Georgia had the largest Native American population? The place with the largest Native American population in Georgia for 2026 is Carrollton. 0.56% of Carrollton identify as Native American.
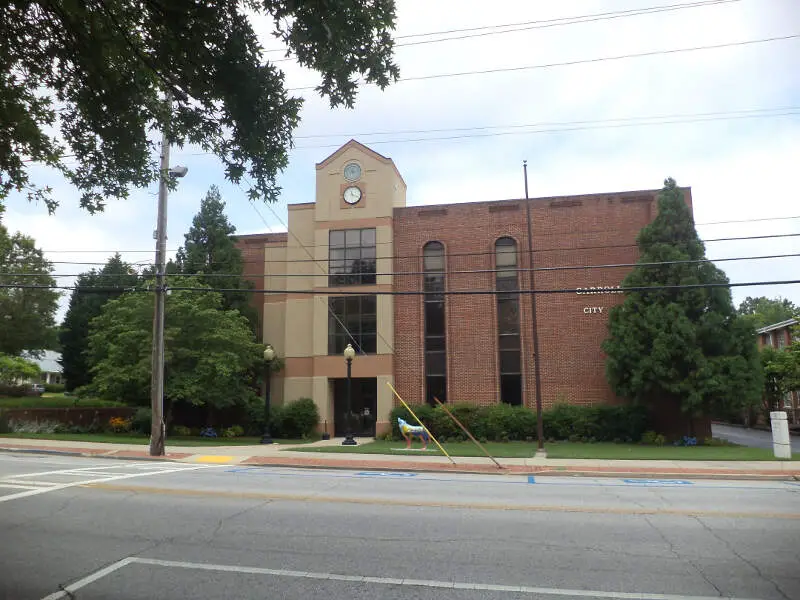
0.6% Native American · 154 Native American residents
Carrollton, Georgia is a town located in the north west region of Georgia, United States. It is located within the Atlanta Metropolitan Area, and it is about ten miles from the Alabama state line. As of the 2015 United States Census, the city had a population of 25,515. The city is rapidly growing as the University of West Georgia continues to expand. The city is the county seat of Carroll County.
Data | Crime | Cost of living | Movers
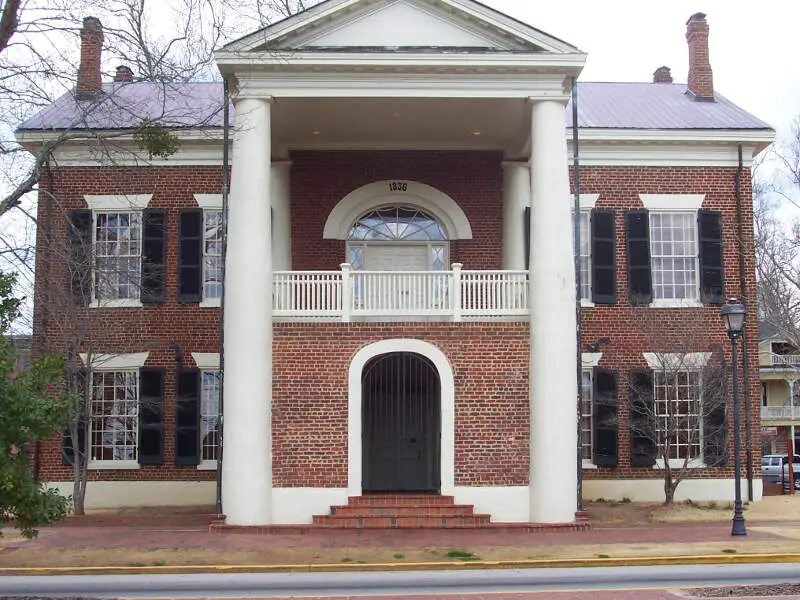
0.5% Native American · 39 Native American residents
The city of Dahlonega is the county seat of Lumpkin County, Georgia, United States. As of the 2010 census, the city had a population of 5,242.
Data | Crime | Cost of living | Movers
0.4% Native American · 37 Native American residents
Data | Crime | Cost of living | Movers
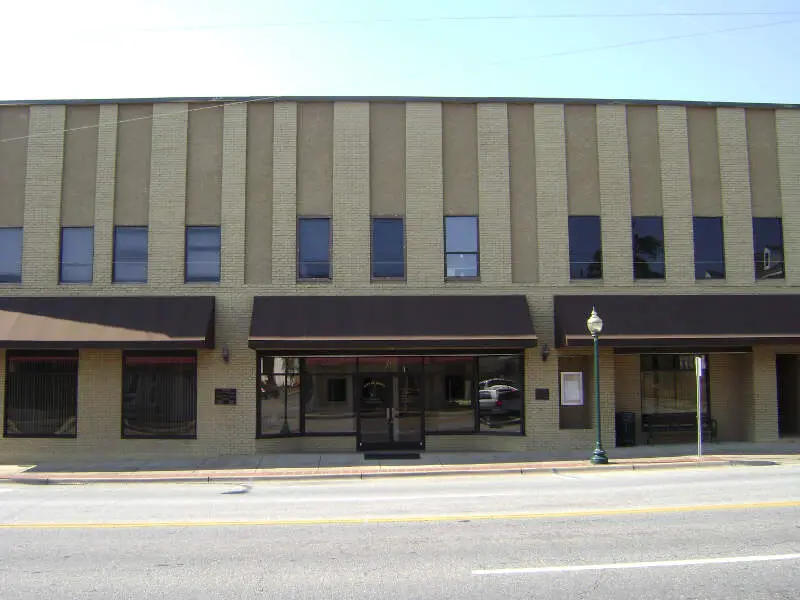
0.4% Native American · 36 Native American residents
Cairo is a city in Grady County, Georgia, United States. As of the 2010 census, the city had a population of 9,607. The city is the county seat of Grady County.
Data | Crime | Cost of living | Movers
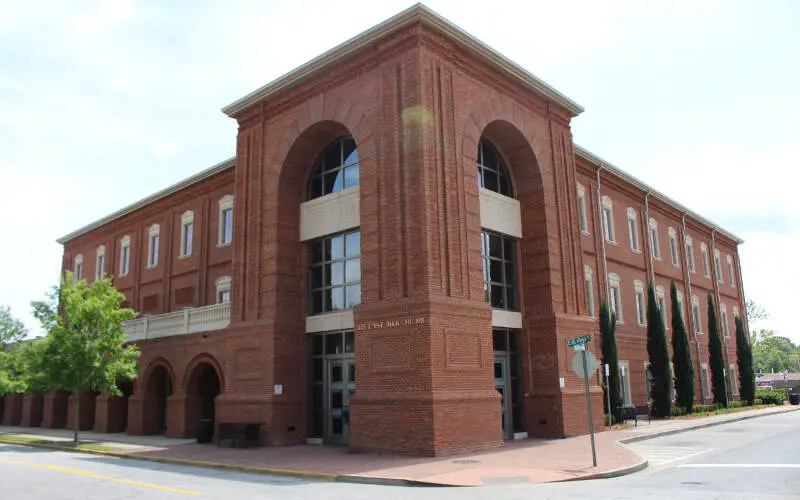
0.4% Native American · 125 Native American residents
Hinesville is a city in Liberty County, Georgia, United States. The population was 33,437 at the 2010 census. The city is the county seat of Liberty County. Nearby Fort Stewart and the principal city of Hinesville are part of the Hinesville-Fort Stewart metropolitan statistical area, which comprises all of Liberty County and neighboring Long County.
Data | Crime | Cost of living | Movers
0.3% Native American · 36 Native American residents
Data | Crime | Cost of living | Movers
0.3% Native American · 23 Native American residents
The city of Fitzgerald is the county seat of Ben Hill County in the U.S. state of Georgia. As of the 2010 census, it had a population of 9,053. It is the principal city of the Fitzgerald Micropolitan Statistical Area, which includes all of Ben Hill and Irwin counties.
Data | Crime | Cost of living | Movers
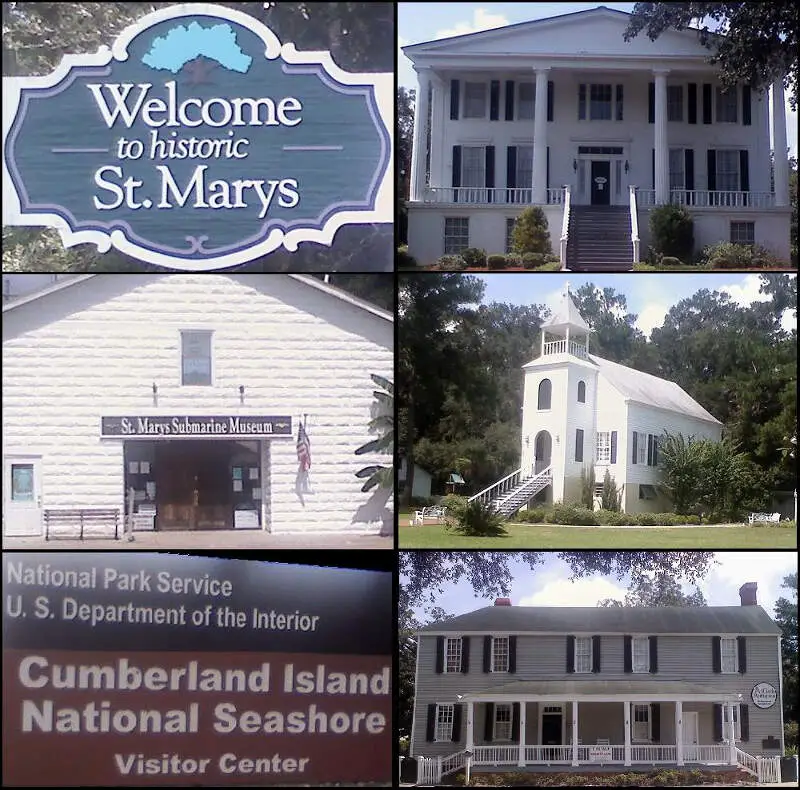
0.3% Native American · 48 Native American residents
St. Marys is a city in Camden County, Georgia, United States. The city is the gateway to Cumberland Island National Seashore, the largest of the Georgia Coast’s barrier islands. The National Seashore’s visitor center and boat access are both located at the St. Marys waterfront. The city is also home to the annual St. Marys Rock Shrimp Festival, the St. Marys Submarine Museum, and Crooked River State Park. Its territory is immediately bordered by Kings Bay Naval Submarine Base, which is the home port for several Ohio-class submarines. The population of St. Marys was 17,121 as of the 2010 Census.
Data | Crime | Cost of living | Movers
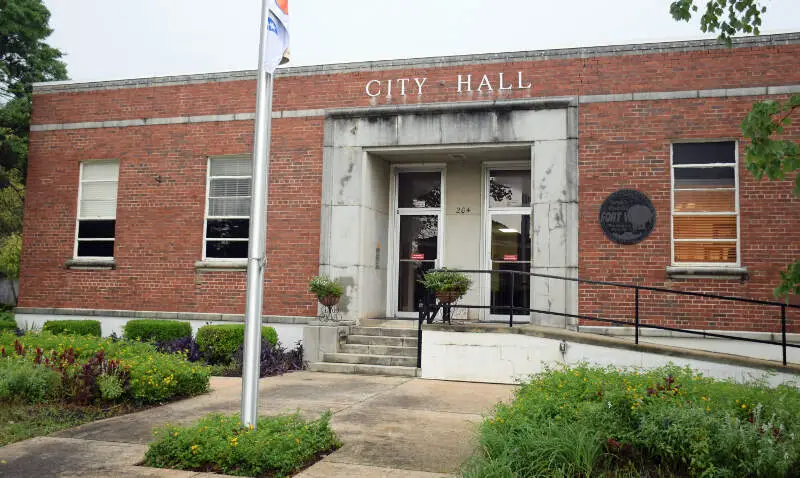
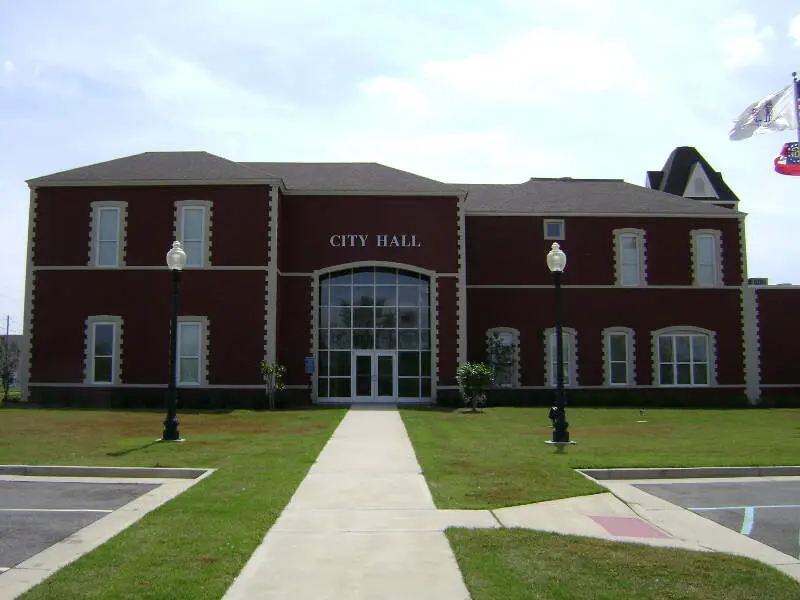
0.2% Native American · 22 Native American residents
Fort Valley is a city in and the county seat of Peach County, Georgia, United States. As of the 2010 census, the city had a population of 9,815.
Data | Crime | Cost of living | Movers
0.2% Native American · 48 Native American residents
Fayetteville is a city in Fayette County, Georgia, United States. As of the 2010 census, the city had a population of 15,945, up from 11,148 at the 2000 census. The city is the county seat of Fayette County. Fayetteville is located 22 miles south of downtown Atlanta.
Data | Crime | Cost of living | Movers
The receipts
Compare the top ten
Pick a metric. The bars rescale. The red line is Georgia’s statewide median.
On the map
Where Georgia’s Native American population is concentrated
Saturday Night Science
Methodology: How We Determined The Cities In Georgia With The Largest Native American Population For 2026
We still believe in the accuracy of data — especially from the Census. So that’s where we went to get the race breakdown across Georgia.
We used Saturday Night Science to analyze the Census’s most recently available data, the 2020-2024 American Community Survey data.
Specifically, we looked at table B03002: Hispanic OR LATINO ORIGIN BY RACE. Here are the category names as defined by the Census:
- Hispanic or Latino
- White alone
- Black or African American alone
- American Indian and Alaska Native alone
- Asian alone
- Native Hawaiian and Other Pacific Islander alone
- Some other race alone
- Two or more races
Our particular column of interest here was the number of people identifying as American Indian and Alaska Native alone.
We limited our analysis to places with a population greater than 5,000 people. That left us with 121 cities.
We then calculated the percentage of residents that are American Indian and Alaska Native. The percentages ranked from 0.56 to 0.00.
Finally, we ranked each city based on the percentage of the American Indian and Alaska Native population, with a higher score being more American Indian and Alaska Native than a lower score. Carrollton took the distinction of being the most American Indian and Alaska Native, while Fort Oglethorpe was the least Native American city.
We updated this article for 2026. This article is our eleventh time ranking the cities in Georgia with the largest Native American population.
The full plate
Most Native American Places In Georgia
Click any column to sort. Search by city name.
| Rank | City | Population | Native American Population | % Native American |
|---|---|---|---|---|
| 1 | Carrollton | 27,392 | 154 | 0.6% |
| 2 | Dahlonega | 7,299 | 39 | 0.5% |
| 3 | Cusseta-Chattahoochee County unified government | 8,887 | 37 | 0.4% |
| 4 | Cairo | 10,055 | 36 | 0.4% |
| 5 | Hinesville | 35,679 | 125 | 0.4% |
| 6 | Lovejoy | 11,508 | 36 | 0.3% |
| 7 | Fitzgerald | 8,918 | 23 | 0.3% |
| 8 | St. Marys | 19,166 | 48 | 0.3% |
| 9 | Fort Valley | 8,858 | 22 | 0.2% |
| 10 | Fayetteville | 19,719 | 48 | 0.2% |
| 11 | Forest Park | 19,504 | 45 | 0.2% |
| 12 | Norcross | 18,007 | 41 | 0.2% |
| 13 | Chamblee | 30,895 | 60 | 0.2% |
| 14 | Douglas | 11,749 | 22 | 0.2% |
| 15 | Marietta | 62,263 | 115 | 0.2% |
| 16 | Stone Mountain | 6,623 | 12 | 0.2% |
| 17 | Flowery Branch | 10,925 | 19 | 0.2% |
| 18 | Athens-Clarke County unified government (balance) | 127,345 | 219 | 0.2% |
| 19 | Decatur | 24,518 | 40 | 0.2% |
| 20 | Lilburn | 15,390 | 25 | 0.2% |
| 21 | Duluth | 32,426 | 51 | 0.2% |
| 22 | Locust Grove | 10,532 | 16 | 0.2% |
| 23 | Peachtree City | 39,576 | 58 | 0.1% |
| 24 | Thomasville | 18,666 | 27 | 0.1% |
| 25 | Kennesaw | 34,605 | 50 | 0.1% |
| 26 | Dallas | 14,714 | 20 | 0.1% |
| 27 | Hapeville | 6,630 | 9 | 0.1% |
| 28 | Perry | 23,001 | 30 | 0.1% |
| 29 | Atlanta | 505,268 | 654 | 0.1% |
| 30 | LaFayette | 6,967 | 9 | 0.1% |
| 31 | Kingsland | 19,627 | 25 | 0.1% |
| 32 | Auburn | 8,711 | 11 | 0.1% |
| 33 | Canton | 35,741 | 43 | 0.1% |
| 34 | Johns Creek | 81,988 | 98 | 0.1% |
| 35 | Vidalia | 10,752 | 12 | 0.1% |
| 36 | Albany | 67,224 | 72 | 0.1% |
| 37 | Austell | 8,447 | 9 | 0.1% |
| 38 | Acworth | 22,473 | 23 | 0.1% |
| 39 | Valdosta | 55,252 | 54 | 0.1% |
| 40 | Cedartown | 10,227 | 9 | 0.1% |
| 41 | Sandy Springs | 107,087 | 89 | 0.1% |
| 42 | Barnesville | 6,121 | 5 | 0.1% |
| 43 | LaGrange | 32,078 | 26 | 0.1% |
| 44 | Suwanee | 22,349 | 18 | 0.1% |
| 45 | Smyrna | 56,633 | 44 | 0.1% |
| 46 | Lawrenceville | 30,954 | 24 | 0.1% |
| 47 | Milton | 41,546 | 31 | 0.1% |
| 48 | Waycross | 13,756 | 10 | 0.1% |
| 49 | Alpharetta | 66,855 | 47 | 0.1% |
| 50 | Roswell | 92,621 | 60 | 0.1% |
| 51 | Stockbridge | 35,737 | 23 | 0.1% |
| 52 | Warner Robins | 82,990 | 51 | 0.1% |
| 53 | Riverdale | 14,792 | 9 | 0.1% |
| 54 | Snellville | 21,620 | 13 | 0.1% |
| 55 | Milledgeville | 16,748 | 10 | 0.1% |
| 56 | Holly Springs | 18,627 | 11 | 0.1% |
| 57 | Cumming | 8,469 | 5 | 0.1% |
| 58 | Garden City | 10,426 | 6 | 0.1% |
| 59 | Bremen | 7,488 | 4 | 0.1% |
| 60 | Douglasville | 37,536 | 20 | 0.1% |
| 61 | Statesboro | 34,149 | 18 | 0.1% |
| 62 | Braselton | 15,178 | 8 | 0.1% |
| 63 | Pooler | 28,466 | 15 | 0.1% |
| 64 | Augusta-Richmond County consolidated government (balance) | 201,528 | 102 | 0.1% |
| 65 | Cordele | 9,994 | 5 | 0.1% |
| 66 | Savannah | 147,898 | 73 | 0.0% |
| 67 | Bainbridge | 14,404 | 7 | 0.0% |
| 68 | Newnan | 44,235 | 21 | 0.0% |
| 69 | Loganville | 15,527 | 7 | 0.0% |
| 70 | Columbus | 203,711 | 91 | 0.0% |
| 71 | Powder Springs | 18,009 | 8 | 0.0% |
| 72 | Dublin | 16,136 | 7 | 0.0% |
| 73 | Sugar Hill | 26,128 | 5 | 0.0% |
| 74 | Americus | 15,813 | 3 | 0.0% |
| 75 | Woodstock | 37,381 | 6 | 0.0% |
| 76 | East Point | 38,335 | 6 | 0.0% |
| 77 | Moultrie | 14,588 | 2 | 0.0% |
| 78 | Brunswick | 15,307 | 2 | 0.0% |
| 79 | Dalton | 34,538 | 4 | 0.0% |
| 80 | Villa Rica | 18,551 | 2 | 0.0% |
| 81 | Doraville | 11,134 | 1 | 0.0% |
| 82 | Gainesville | 45,032 | 4 | 0.0% |
| 83 | Tifton | 17,210 | 1 | 0.0% |
| 102 | Rome | 38,189 | 0 | 0.0% |
| 102 | Cartersville | 24,074 | 0 | 0.0% |
| 102 | Blakely | 5,238 | 0 | 0.0% |
| 102 | Jonesboro | 6,143 | 0 | 0.0% |
| 102 | Centerville | 8,505 | 0 | 0.0% |
| 102 | Jesup | 9,942 | 0 | 0.0% |
| 102 | Richmond Hill | 18,181 | 0 | 0.0% |
| 102 | Jefferson | 14,990 | 0 | 0.0% |
| 102 | Clarkston | 14,557 | 0 | 0.0% |
| 102 | Monroe | 15,648 | 0 | 0.0% |
| 102 | Sandersville | 5,601 | 0 | 0.0% |
| 102 | Adel | 5,641 | 0 | 0.0% |
| 102 | Hampton | 8,687 | 0 | 0.0% |
| 102 | Grovetown | 17,014 | 0 | 0.0% |
| 102 | Griffin | 23,761 | 0 | 0.0% |
| 102 | Buford | 17,997 | 0 | 0.0% |
| 102 | Camilla | 5,124 | 0 | 0.0% |
Source: U.S. Census ACS 2020-2024, table B03002. 121 Georgia cities with more than 5,000 residents.
Summary
Summary: Native American Populations Across Georgia
If you’re looking for a breakdown of Native American populations across Georgia according to the most recent data, this is an accurate list.
The most Native American cities in Georgia are Carrollton, Dahlonega, Cusseta-Chattahoochee County unified government, Cairo, Hinesville, Lovejoy, Fitzgerald, St. Marys, Fort Valley, and Fayetteville.


