Most Native American places in North Carolina research summary. We used Saturday Night Science to research the North Carolina cities with the highest percentage of Native American residents for 2026. The data comes from the American Community Survey 2020-2024 vintage, which breaks down race by origin.
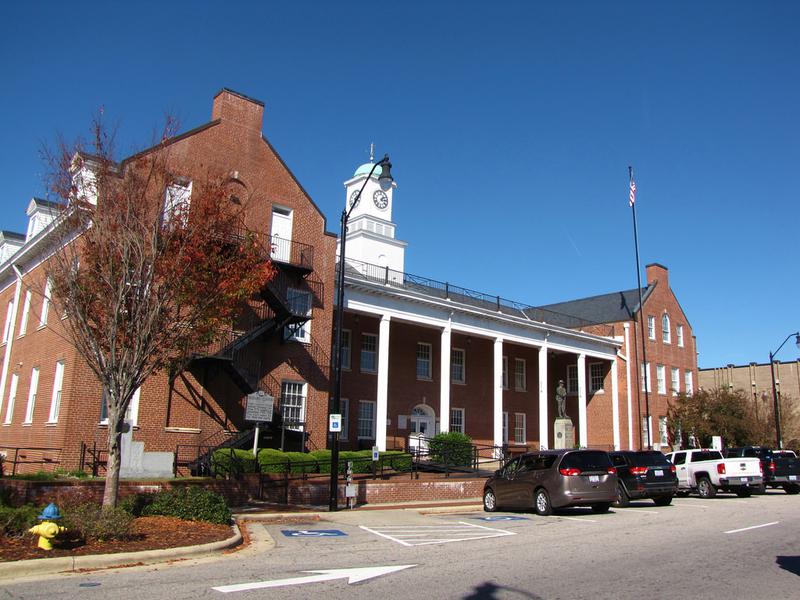
The city with the highest percentage of Native Americans is Lumberton. 12.42% of people in Lumberton are Native Americans.
The city with the lowest percentage of Native Americans is Gibsonville. 0.00% of people in Gibsonville are Native American.
The city with the most Native Americans is Lumberton. 2,342 people in Lumberton are Native American.
The city with the fewest Native Americans is Gibsonville. 0 people in Gibsonville are Native American.
The United States has 1,698,432 Native Americans and is 0.51% Native American.
Which city in North Carolina had the largest Native American population? The place with the largest Native American population in North Carolina for 2026 is Lumberton. 12.42% of Lumberton identify as Native American.
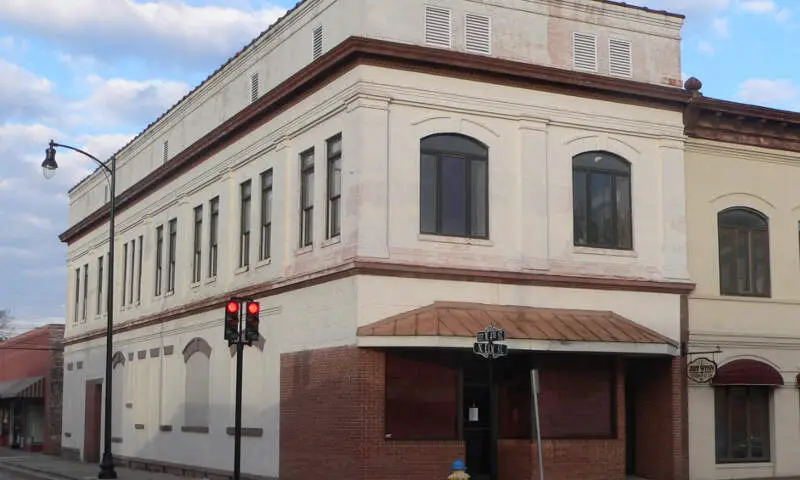
12.4% Native American · 2,342 Native American residents
Lumberton is a city in Robeson County, North Carolina, United States. The population has grown to 21,542 in the 2010 census from 20,795 in the 2000 census. It is the county seat of Robeson County. Lumberton, located in southern North Carolina’s Inner Banks region, is located on the Lumber River. Founded in 1787 by John Willis, an officer in the American Revolution, Lumberton was originally a shipping point for lumber used by the Navy, which was sent downriver to Georgetown, South Carolina. Most of the town’s growth, however, began shortly after World War II.
Data | Crime | Cost of living | Movers
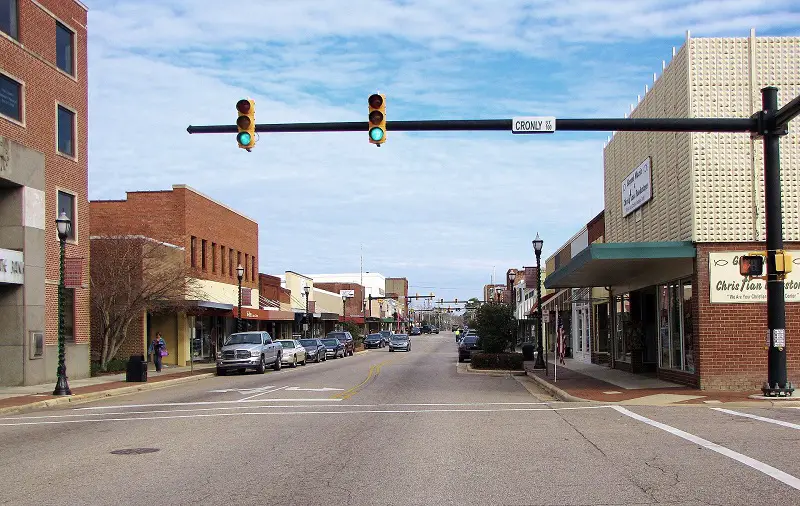
7.1% Native American · 1,074 Native American residents
Laurinburg is a city in and the county seat of Scotland County, North Carolina, United States. Located in southern North Carolina near the South Carolina border, Laurinburg is southwest of Fayetteville and is home to St. Andrews University. The Laurinburg Institute, a historically African-American school, is also located in Laurinburg. The population at the 2010 Census was 15,962 people.
Data | Crime | Cost of living | Movers
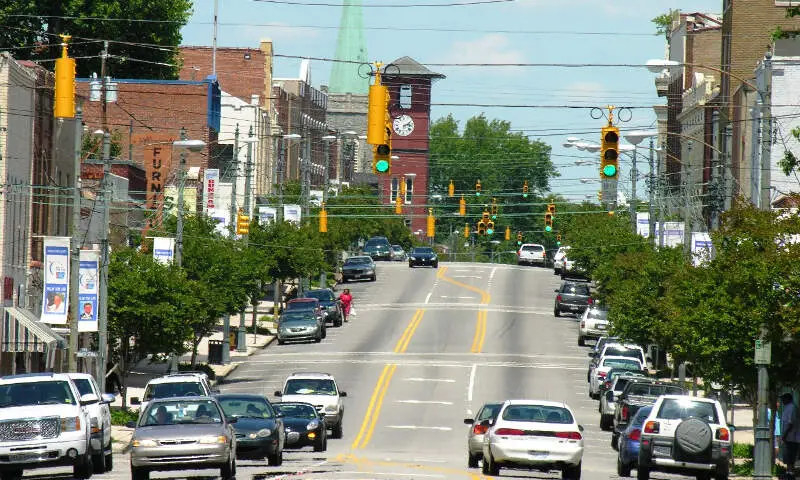
2.7% Native American · 397 Native American residents
Henderson, a city with a population of 15,368 at the 2010 census, is the county seat of Vance County, North Carolina, United States.
Data | Crime | Cost of living | Movers
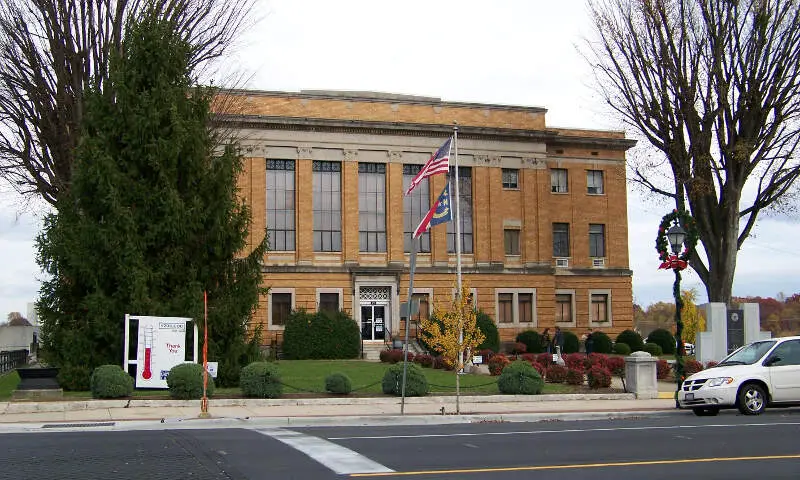
1.9% Native American · 167 Native American residents
Rockingham is a city in Richmond County, North Carolina, United States named after the Marquis of Rockingham. The population was 9,558 at the 2010 census. It is the county seat of Richmond County. Rockingham is the home of Rockingham Speedway, formerly the North Carolina Speedway, which was a staple of the NASCAR schedule for nearly 40 years, before the race was discontinued in 2004.
Data | Crime | Cost of living | Movers
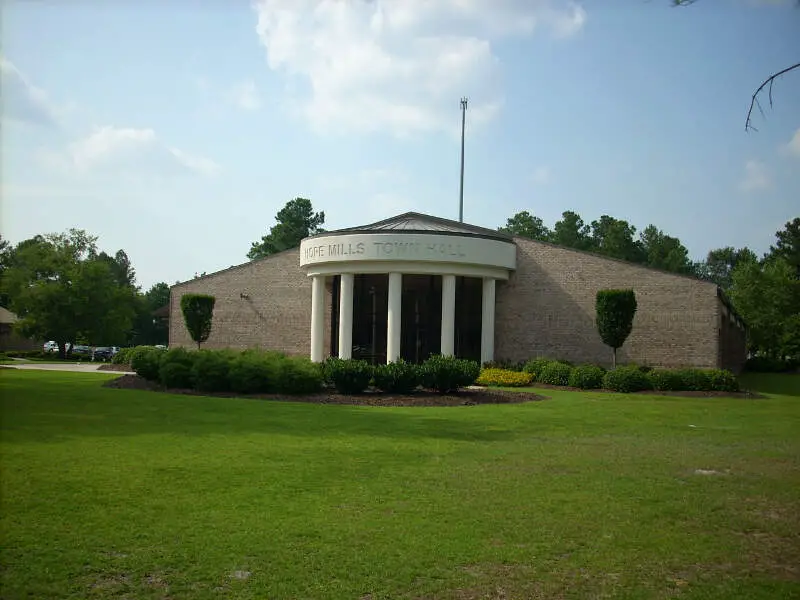
1.5% Native American · 270 Native American residents
Hope Mills is a town in Cumberland County, North Carolina, United States. The population was 15,176 at the 2010 census.
Data | Crime | Cost of living | Movers
1.1% Native American · 83 Native American residents
Marion is a city in McDowell County, North Carolina, United States. It is the county seat of McDowell County. Founded in 1844, the city was named in honor of Brigadier General Francis Marion, the American Revolutionary War Hero whose talent in guerrilla warfare earned him the name -Swamp Fox-. Marion’s Main Street Historic District is listed on the National Register of Historic Places. The population was 7,838 at the 2010 Census.
Data | Crime | Cost of living | Movers
0.9% Native American · 171 Native American residents
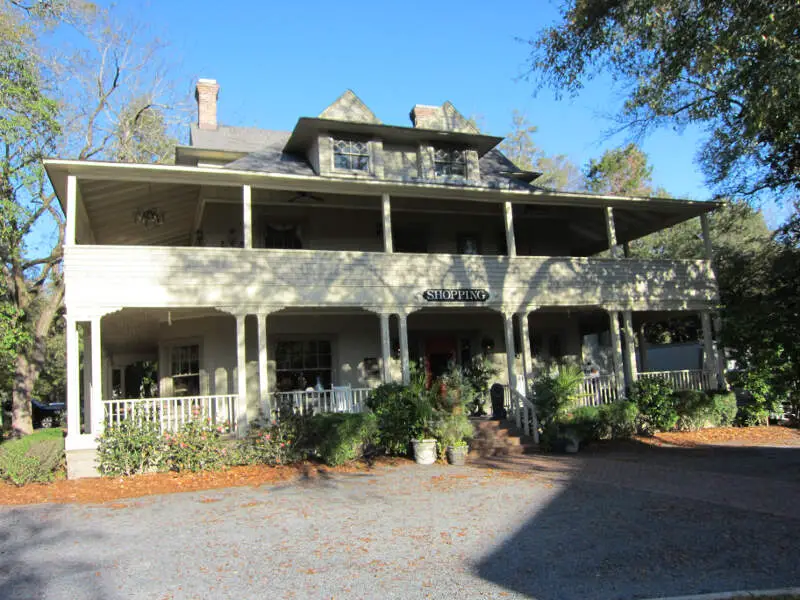
Pinehurst is a village in Moore County, North Carolina, United States. As of the 2010 census, the city population was 13,124. It is home of the historic golf resort, Pinehurst Resort. A large portion of the central village, including the resort complexes, is a National Historic Landmark District, designated in 1996 for its landscape design and its significance in the history of golf in the United States.
Data | Crime | Cost of living | Movers
0.9% Native American · 85 Native American residents
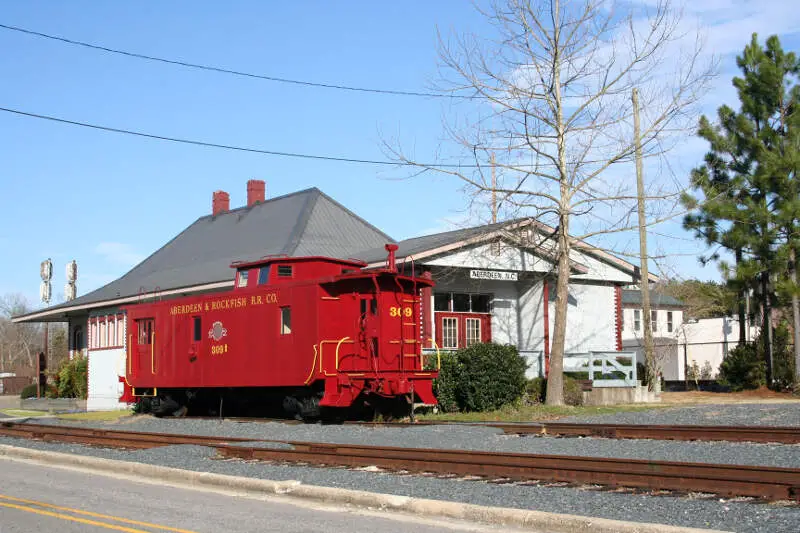
Aberdeen is a town in Moore County, North Carolina, United States. It is part of the Raleigh-Durham-Cary-Chapel Hill Combined Statistical Area. The population was 3,400 at the 2000 census.
Data | Crime | Cost of living | Movers
0.8% Native American · 65 Native American residents
Clinton is a city and the county seat of Sampson County, North Carolina, United States. The population of Clinton is 8,639 according to the 2010 US Census. Clinton is named for Richard Clinton, a Brigadier General of the North Carolina militia in the American Revolution.
Data | Crime | Cost of living | Movers
0.7% Native American · 62 Native American residents
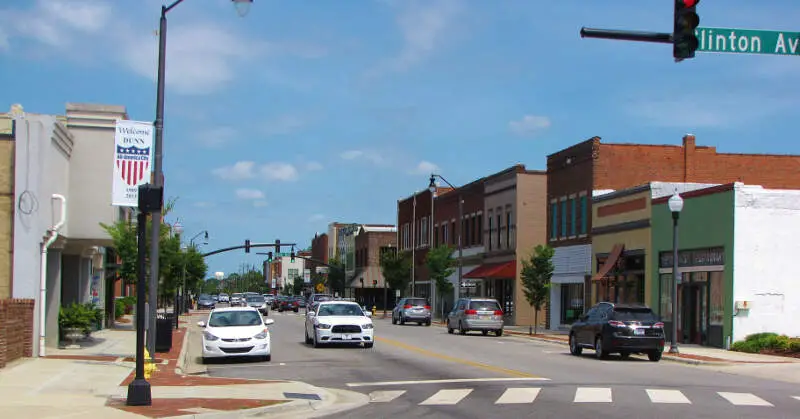
Dunn is a city in Harnett County, North Carolina, United States. The population was 9,263 at the 2010 census, and an estimated 9,873 in 2016. It is the anchor city of the Dunn Micropolitan Area, population 114,678, which is a part of the greater Raleigh-Durham-Cary Combined Statistical Area as defined by the United States Census Bureau.
Data | Crime | Cost of living | Movers
The receipts
Compare the top ten
Pick a metric. The bars rescale. The red line is North Carolina’s statewide median.
On the map
Where North Carolina’s Native American population is concentrated
Saturday Night Science
Methodology: How We Determined The Cities In North Carolina With The Largest Native American Population For 2026
We still believe in the accuracy of data — especially from the Census. So that’s where we went to get the race breakdown across North Carolina.
We used Saturday Night Science to analyze the Census’s most recently available data, the 2020-2024 American Community Survey data.
Specifically, we looked at table B03002: Hispanic OR LATINO ORIGIN BY RACE. Here are the category names as defined by the Census:
- Hispanic or Latino
- White alone
- Black or African American alone
- American Indian and Alaska Native alone
- Asian alone
- Native Hawaiian and Other Pacific Islander alone
- Some other race alone
- Two or more races
Our particular column of interest here was the number of people identifying as American Indian and Alaska Native alone.
We limited our analysis to places with a population greater than 5,000 people. That left us with 124 cities.
We then calculated the percentage of residents that are American Indian and Alaska Native. The percentages ranked from 12.42 to 0.00.
Finally, we ranked each city based on the percentage of the American Indian and Alaska Native population, with a higher score being more American Indian and Alaska Native than a lower score. Lumberton took the distinction of being the most American Indian and Alaska Native, while Gibsonville was the least Native American city.
We updated this article for 2026. This article is our eleventh time ranking the cities in North Carolina with the largest Native American population.
The full plate
Most Native American Places In North Carolina
Click any column to sort. Search by city name.
| Rank | City | Population | Native American Population | % Native American |
|---|---|---|---|---|
| 1 | Lumberton | 18,859 | 2,342 | 12.4% |
| 2 | Laurinburg | 15,087 | 1,074 | 7.1% |
| 3 | Henderson | 14,885 | 397 | 2.7% |
| 4 | Rockingham | 8,967 | 167 | 1.9% |
| 5 | Hope Mills | 17,939 | 270 | 1.5% |
| 6 | Marion | 7,579 | 83 | 1.1% |
| 7 | Pinehurst | 18,256 | 171 | 0.9% |
| 8 | Aberdeen | 9,228 | 85 | 0.9% |
| 9 | Clinton | 8,304 | 65 | 0.8% |
| 10 | Dunn | 8,559 | 62 | 0.7% |
| 11 | Fayetteville | 210,815 | 1,447 | 0.7% |
| 12 | Jacksonville | 71,279 | 428 | 0.6% |
| 13 | Oak Island | 9,030 | 50 | 0.6% |
| 14 | Spring Lake | 11,573 | 63 | 0.5% |
| 15 | Shelby | 22,100 | 112 | 0.5% |
| 16 | Rocky Mount | 54,297 | 269 | 0.5% |
| 17 | Garner | 34,473 | 169 | 0.5% |
| 18 | Thomasville | 27,321 | 127 | 0.5% |
| 19 | Brevard | 7,897 | 35 | 0.4% |
| 20 | Statesville | 29,894 | 129 | 0.4% |
| 21 | Chapel Hill | 61,607 | 255 | 0.4% |
| 22 | Mills River | 7,281 | 28 | 0.4% |
| 23 | Woodfin | 8,048 | 30 | 0.4% |
| 24 | New Bern | 32,734 | 122 | 0.4% |
| 25 | Morganton | 17,646 | 61 | 0.3% |
| 26 | Elon | 11,032 | 35 | 0.3% |
| 27 | Kernersville | 27,830 | 77 | 0.3% |
| 28 | Butner | 8,065 | 19 | 0.2% |
| 29 | Durham | 291,467 | 667 | 0.2% |
| 30 | Wilson | 48,370 | 109 | 0.2% |
| 31 | Boone | 20,032 | 42 | 0.2% |
| 32 | Hendersonville | 15,408 | 32 | 0.2% |
| 33 | Elizabeth City | 18,871 | 34 | 0.2% |
| 34 | Apex | 70,630 | 125 | 0.2% |
| 35 | Kinston | 19,505 | 34 | 0.2% |
| 36 | Graham | 18,048 | 31 | 0.2% |
| 37 | Raleigh | 481,031 | 810 | 0.2% |
| 38 | Monroe | 36,759 | 61 | 0.2% |
| 39 | Smithfield | 12,116 | 20 | 0.2% |
| 40 | Washington | 9,726 | 16 | 0.2% |
| 41 | Eden | 15,356 | 25 | 0.2% |
| 42 | Wilmington | 120,805 | 192 | 0.2% |
| 43 | Greensboro | 301,198 | 468 | 0.2% |
| 44 | Goldsboro | 34,383 | 52 | 0.2% |
| 45 | Salisbury | 35,825 | 51 | 0.1% |
| 46 | Burlington | 59,610 | 84 | 0.1% |
| 47 | Charlotte | 903,844 | 1,272 | 0.1% |
| 48 | Winston-Salem | 252,037 | 340 | 0.1% |
| 49 | Havelock | 17,691 | 23 | 0.1% |
| 50 | Fuquay-Varina | 40,485 | 51 | 0.1% |
| 51 | Bessemer City | 5,580 | 7 | 0.1% |
| 52 | Oxford | 8,914 | 11 | 0.1% |
| 53 | Stallings | 16,886 | 20 | 0.1% |
| 54 | High Point | 116,245 | 126 | 0.1% |
| 55 | Black Mountain | 8,513 | 9 | 0.1% |
| 56 | Gastonia | 82,884 | 84 | 0.1% |
| 57 | Hamlet | 5,961 | 6 | 0.1% |
| 58 | Trinity | 7,111 | 7 | 0.1% |
| 59 | Newton | 13,333 | 13 | 0.1% |
| 60 | Holly Springs | 45,248 | 44 | 0.1% |
| 61 | Carrboro | 21,204 | 20 | 0.1% |
| 62 | Clemmons | 21,871 | 20 | 0.1% |
| 63 | Indian Trail | 42,036 | 38 | 0.1% |
| 64 | Carolina Beach | 6,745 | 6 | 0.1% |
| 65 | Asheboro | 27,580 | 24 | 0.1% |
| 66 | Morrisville | 31,422 | 27 | 0.1% |
| 67 | Matthews | 30,577 | 26 | 0.1% |
| 68 | Cary | 179,306 | 150 | 0.1% |
| 69 | Hickory | 44,258 | 37 | 0.1% |
| 70 | Lenoir | 18,299 | 15 | 0.1% |
| 71 | Pineville | 11,055 | 9 | 0.1% |
| 72 | Lexington | 19,690 | 14 | 0.1% |
| 73 | Clayton | 29,320 | 20 | 0.1% |
| 74 | Forest City | 7,363 | 5 | 0.1% |
| 75 | Greenville | 92,857 | 62 | 0.1% |
| 76 | Mount Airy | 10,633 | 7 | 0.1% |
| 77 | Waxhaw | 22,275 | 14 | 0.1% |
| 78 | Sanford | 31,478 | 19 | 0.1% |
| 79 | Kannapolis | 57,890 | 34 | 0.1% |
| 80 | Mint Hill | 27,556 | 15 | 0.1% |
| 81 | Leland | 29,607 | 15 | 0.1% |
| 82 | Lewisville | 13,828 | 7 | 0.1% |
| 83 | Fletcher | 8,098 | 4 | 0.0% |
| 84 | Tarboro | 10,770 | 5 | 0.0% |
| 85 | Mount Holly | 18,208 | 8 | 0.0% |
| 86 | Mooresville | 52,381 | 21 | 0.0% |
| 87 | Wake Forest | 52,844 | 21 | 0.0% |
| 88 | Winterville | 10,725 | 4 | 0.0% |
| 89 | Huntersville | 63,969 | 23 | 0.0% |
| 90 | Kings Mountain | 12,039 | 4 | 0.0% |
| 91 | Concord | 108,719 | 34 | 0.0% |
| 92 | Asheville | 94,535 | 26 | 0.0% |
| 93 | Roxboro | 8,182 | 2 | 0.0% |
| 94 | Cornelius | 32,783 | 8 | 0.0% |
| 95 | Sawmills | 5,042 | 1 | 0.0% |
| 96 | Weddington | 13,805 | 2 | 0.0% |
| 97 | Morehead City | 9,806 | 1 | 0.0% |
| 111 | Siler City | 7,995 | 0 | 0.0% |
| 111 | Lincolnton | 11,783 | 0 | 0.0% |
| 111 | Southern Pines | 16,420 | 0 | 0.0% |
Source: U.S. Census ACS 2020-2024, table B03002. 124 North Carolina cities with more than 5,000 residents.
Summary
Summary: Native American Populations Across North Carolina
If you’re looking for a breakdown of Native American populations across North Carolina according to the most recent data, this is an accurate list.
The most Native American cities in North Carolina are Lumberton, Laurinburg, Henderson, Rockingham, Hope Mills, Marion, Pinehurst, Aberdeen, Clinton, and Dunn.


