

We analyzed research using Saturday Night Science from Virginia Commonwealth University that mapped Klaverns by city from 1915-1940. This report analyzes the locations of historic KKK organizations to see where they were the most prevalent in Indiana.
The city in Indiana with the most number of Klaverns was Indianapolis with 4 Klaverns. The city with the most number of Klaverns per capita was San Pierre with 0.0111 Klaverns. There were historically 64 Klaverns in Indiana, across 51 places in Indiana with at least 1 Klavern during the period of reference.
Hate groups can be hard to measure because, typically, there’s no record of where they exist. But there is data on where there were distinct Klaverns of the Ku Klux Klan in each state. These cities have historically been the most racist in Indiana based on the number of KKK Klaverns.
This report does not speak to the current people who live there or the current state of the KKK in the same towns or areas.
1 Klaverns · #1 most historically racist in Indiana
1 Klaverns · #2 most historically racist in Indiana
1 Klaverns · #3 most historically racist in Indiana
1 Klaverns · #4 most historically racist in Indiana
2 Klaverns · #5 most historically racist in Indiana
1 Klaverns · #6 most historically racist in Indiana
1 Klaverns · #7 most historically racist in Indiana
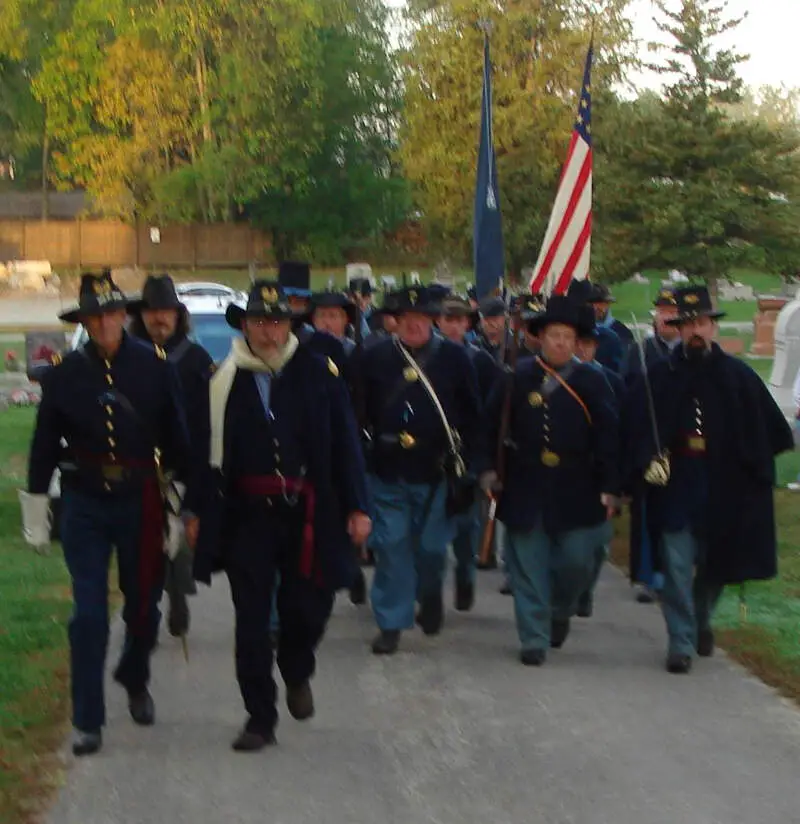
4 Klaverns · #8 most historically racist in Indiana
Hartford City is a city in the U.S. state of Indiana, and the county seat of Blackford County. Located in the northeast central portion of the state, the small farming community experienced a 15-year boom beginning in the late 1880s. The Indiana Gas Boom was caused by the discovery of natural gas in the area, and it caused the community to transition from an agricultural economy to one that also included manufacturing. The boom brought residents, retail establishments, and craftspeople. The increased population meant construction of new roads, schools, and churches. After the boom came a long period of growth and stability. Agriculture remained as the fundamental industry.
Data | Crime | Cost of living | Movers
1 Klaverns · #9 most historically racist in Indiana
1 Klaverns · #10 most historically racist in Indiana
The receipts
Compare the top ten
Pick a metric. The bars rescale. The red line is Indiana’s statewide median.
On the map
Where Indiana’s historic Klaverns were
Saturday Night Science
Methodology: How We Measured The Most Historically Racist Places In The Hoosier State
While there are surveys and public polls on what places might be the most racist, we didn’t want to rely on speculation and opinion. Instead, we looked at the hard numbers from where KKK organizations have existed.
Specifically, we analyzed research out of Virginia Commonwealth University that mapped the Klans in each area and gave a history of their recruitment from 1915-1940.
- Number of historic KKK Klaverns (1915-1940) per current resident
Using Saturday Night Science, we analyzed the locations of historic KKK organizations per capita using current population data.
The full plate
Cities With Historically High KKK Membership In Indiana
Click any column to sort. Search by city name.
| Rank | City | Population | Klaverns | Klaverns /100k |
|---|---|---|---|---|
| 1 | San Pierre | 90 | 1 | 1,111 |
| 2 | Modoc | 261 | 1 | 383 |
| 3 | West Point | 655 | 1 | 153 |
| 4 | Monroe | 717 | 1 | 139 |
| 5 | Roanoke | 1,605 | 2 | 125 |
| 6 | Fountain City | 815 | 1 | 123 |
| 7 | Bainbridge | 885 | 1 | 113 |
| 8 | Hartford City | 6,166 | 4 | 65 |
| 9 | Odon | 1,565 | 1 | 64 |
| 10 | Cambridge City | 1,871 | 1 | 53 |
| 11 | Rockport | 2,279 | 1 | 44 |
| 12 | Rockville | 2,587 | 1 | 39 |
| 13 | Winamac | 2,627 | 1 | 38 |
| 14 | Delphi | 2,787 | 1 | 36 |
| 15 | Fortville | 4,055 | 1 | 25 |
| 16 | Sullivan | 4,203 | 1 | 24 |
| 17 | Clinton | 4,821 | 1 | 21 |
| 18 | Plymouth | 10,048 | 2 | 20 |
| 19 | Tipton | 5,288 | 1 | 19 |
| 20 | Gas City | 6,093 | 1 | 16 |
| 21 | Rochester | 6,151 | 1 | 16 |
| 22 | Portland | 6,408 | 1 | 16 |
| 23 | Elwood | 8,569 | 1 | 12 |
| 24 | Logansport | 17,933 | 2 | 11 |
| 25 | Bluffton | 9,621 | 1 | 10 |
| 26 | Kendallville | 9,847 | 1 | 10 |
| 27 | Wabash | 10,534 | 1 | 9 |
| 28 | Peru | 11,199 | 1 | 9 |
| 29 | Connersville | 13,267 | 1 | 8 |
| 30 | Bedford | 13,384 | 1 | 7 |
| 31 | Chesterton | 13,894 | 1 | 7 |
| 32 | Crown Point | 28,259 | 2 | 7 |
| 33 | Marion | 29,403 | 2 | 7 |
| 34 | Lebanon | 15,688 | 1 | 6 |
| 35 | Frankfort | 16,488 | 1 | 6 |
| 36 | New Castle | 17,859 | 1 | 6 |
| 37 | Kokomo | 56,958 | 2 | 4 |
| 38 | Michigan City | 31,369 | 1 | 3 |
| 39 | Richmond | 36,527 | 1 | 3 |
| 40 | Columbus | 45,522 | 1 | 2 |
| 41 | Jeffersonville | 45,869 | 1 | 2 |
| 42 | Mishawaka | 48,120 | 1 | 2 |
| 43 | South Bend | 100,422 | 2 | 2 |
| 44 | Anderson | 55,789 | 1 | 2 |
| 45 | Noblesville | 56,576 | 1 | 2 |
| 46 | Terre Haute | 61,040 | 1 | 2 |
| 47 | Lafayette | 69,982 | 1 | 1 |
| 48 | Muncie | 70,035 | 1 | 1 |
| 49 | Hammond | 79,585 | 1 | 1 |
| 50 | Evansville | 120,220 | 1 | 1 |
| 51 | Indianapolis | 835,097 | 4 | 0 |
Source: VCU Mapping the Klan, 1915-1940; current population data. 51 cities with at least one Klavern.
Summary
There You Have It – The Most Historically Racist Cities In Indiana
When you’re looking at the places in Indiana with the highest number of historical KKK Klaverns per capita, this is an accurate list.
Below is a chart that lists all cities in Indiana with at least one KKK organization from 1915-1940.
The cities with the largest number of KKK Klaverns per capita were San Pierre, Modoc, West Point, Monroe, Roanoke, Fountain City, Bainbridge, Hartford City, Odon, and Cambridge City. Not sold on Indiana? Take the two-minute Find Your Place quiz and see which state actually fits you.
Questions and answers
Historic KKK Presence In Indiana FAQs
What is the most historically racist city in Indiana?
San Pierre had the most KKK Klaverns per capita of any Indiana city between 1915 and 1940, which puts it at the top of this historical ranking. The measure is historic Klan chapters, not anything about residents today.
Which Indiana city had the most Klaverns overall?
Indianapolis had the most Klaverns in Indiana outright, with 4. Our ranking uses Klaverns per capita instead, so smaller towns with heavy Klan presence rank ahead of big cities on raw counts.
How many Klaverns did Indiana have?
Indiana had 64 documented Klaverns across 51 cities during the 1915-1940 period. Those are the cities that appear in this ranking.
Does this mean San Pierre is racist today?
No. This ranking maps where the KKK organized a century ago, and says nothing about the people who live in San Pierre now. Treat it as history, not a review of the current community.
Where does this data come from?
The numbers come from a historical archive of Klan chapters, called Klaverns, documented between 1915 and 1940. We divided each city’s Klavern count by its population to get the per-capita ranking.



