There’s no denying it: there are plenty of places in Pennsylvania that are downright beautiful and full of excitement.
Unfortunately, not all towns and cities in Keystone State are so lucky.
Just like in all U.S. States, there are definitely some boring places within Pennsylvania’s’ borders. You know the places where everyone has an AARP card and the most exciting thing they do all day is post a picture of their grandchild on Facebook.
Like Plum, for instance. In our latest analysis, we found that this city was the most boring city in all of Pennsylvania according to Saturday Night Science. But don’t feel bad if you’re a resident of Plum. There are plenty of other boring, lackluster places in Pennsylvania as well.
Here they are. Try not to jump out of your seat with excitement.
44.4 median age · 46.0% married households · #27 oldest in Pennsylvania
Plum is a borough in Allegheny County in the U.S. state of Pennsylvania. A suburb of Pittsburgh, Pennsylvania, it is located northeast of the city of Pittsburgh, in what is commonly referred to as the East Hills suburbs. The population was 27,126 at the 2010 census.
Data | Crime | Cost of living | Movers
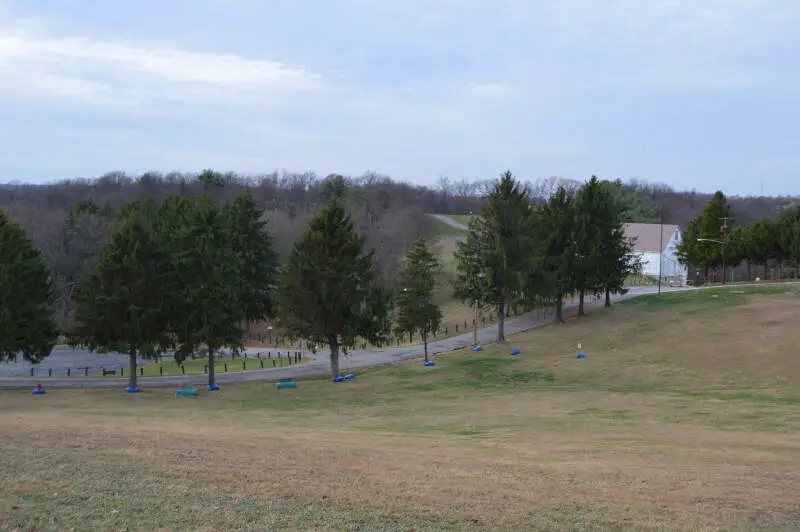
50.7 median age · 50.0% married households · #5 oldest in Pennsylvania
Economy is a borough in Beaver County, Pennsylvania, United States. The population was 8,970 at the 2010 census.
Data | Crime | Cost of living | Movers
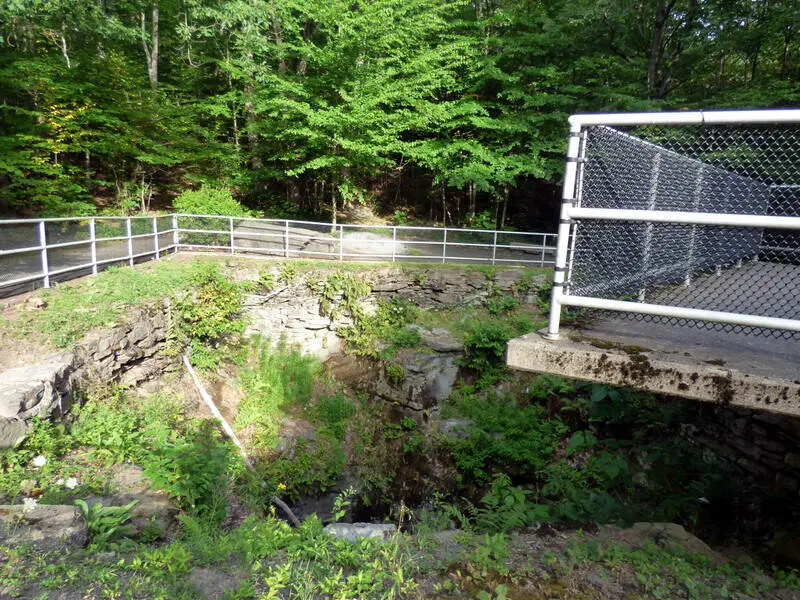
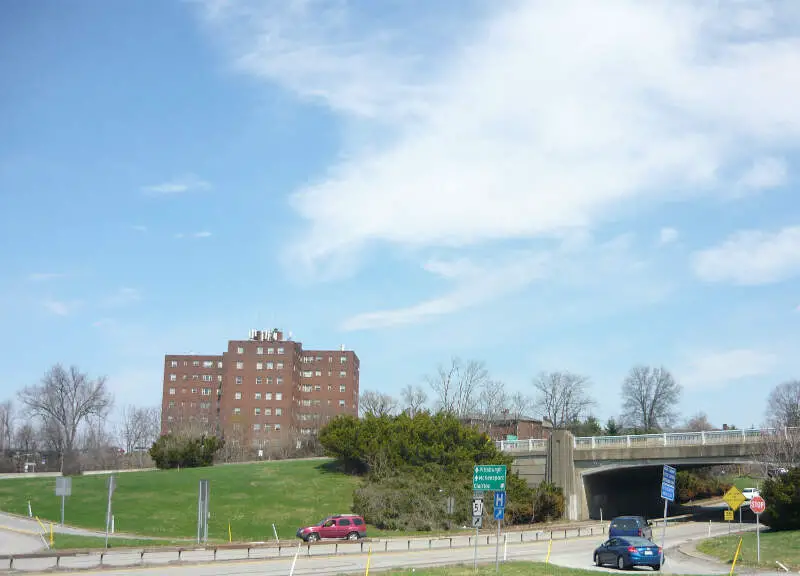
46.3 median age · 47.0% married households · #16 oldest in Pennsylvania
Data | Crime | Cost of living | Movers
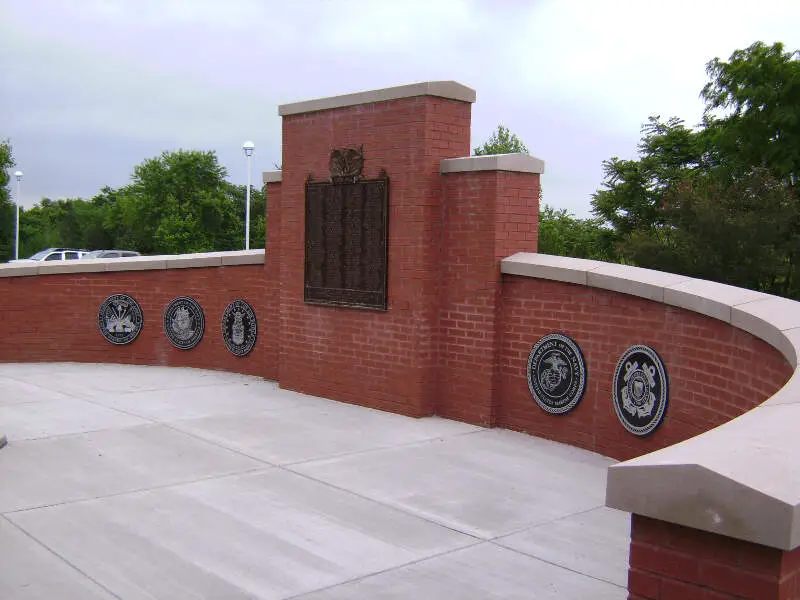
46.8 median age · 45.0% married households · #15 oldest in Pennsylvania
Lower Burrell is a city in Westmoreland County in the U.S. state of Pennsylvania. Located approximately 18 miles northeast of downtown Pittsburgh, it is part of the Pittsburgh metropolitan area. The population was 11,761 at the 2010 census.
Data | Crime | Cost of living | Movers
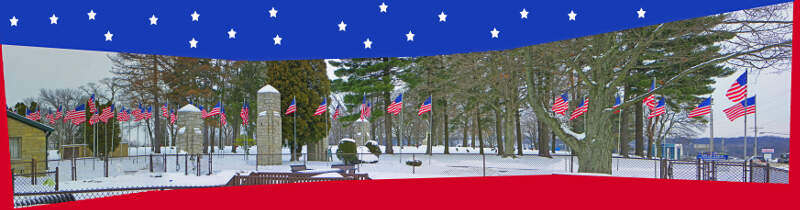
42.9 median age · 50.0% married households · #46 oldest in Pennsylvania
Jefferson Hills is a borough in Allegheny County, Pennsylvania, United States. It includes the community of Large. In the 2010 census the population was 10,619. Jefferson Hills was created as Jefferson Township, incorporating on January 22, 1828, and named after Thomas Jefferson. The borough is a part of West Jefferson Hills School District. Before 1998, the borough was known as Jefferson.
Data | Crime | Cost of living | Movers
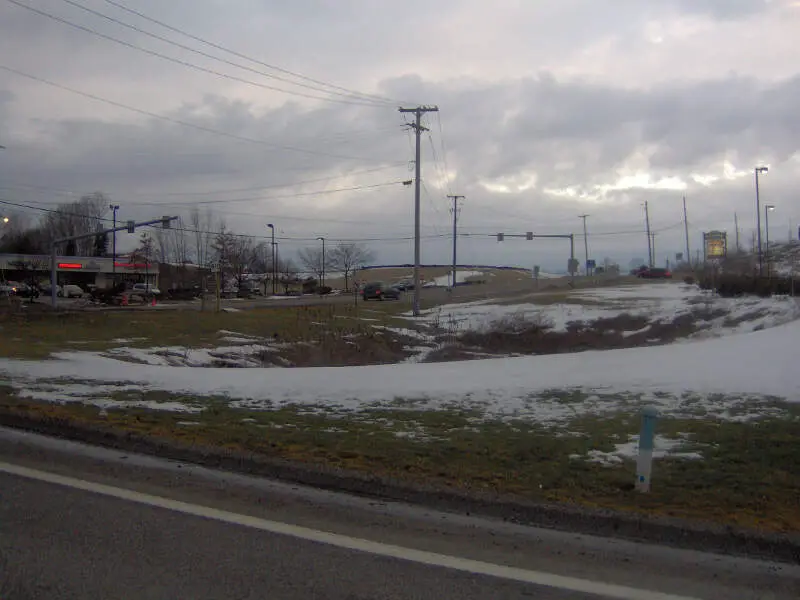
49.9 median age · 42.0% married households · #6 oldest in Pennsylvania
Hermitage is a city in Mercer County, Pennsylvania, United States. The population was 16,220 at the 2010 census. It is part of the Youngstown-Warren-Boardman, OH-PA Metropolitan Statistical Area.
Data | Crime | Cost of living | Movers
43.8 median age · 42.0% married households · #33 oldest in Pennsylvania
Pleasant Hills is a borough in Allegheny County, Pennsylvania, United States. As of the 2010 census, the population was 8,268. Pleasant Hills is a suburb of Pittsburgh.
Data | Crime | Cost of living | Movers
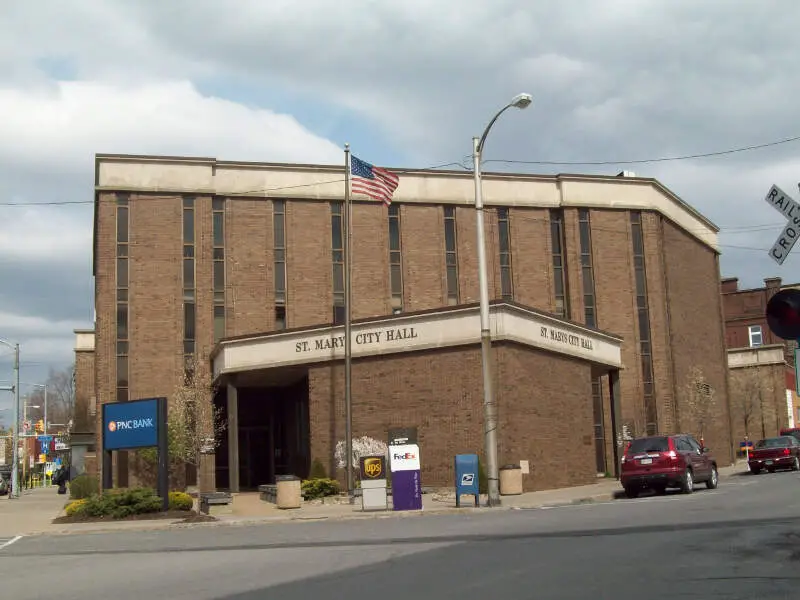
51.6 median age · 46.0% married households · #3 oldest in Pennsylvania
St. Marys is a city in Elk County, Pennsylvania, United States. The population was 13,070 at the 2010 census. Originally a small town inhabited by mostly Bavarian Roman Catholics, it was founded December 8, 1842. It is home to Straub Brewery and the first Benedictine convent in the United States. In 1992, the borough of St. Marys absorbed the surrounding township of Benzinger and incorporated as a city.
Data | Crime | Cost of living | Movers
41.3 median age · 39.0% married households · #56 oldest in Pennsylvania
Franklin Park is a borough in Allegheny County, Pennsylvania, United States. The population was 13,470 at the 2010 census.
Data | Crime | Cost of living | Movers
47.4 median age · 36.0% married households · #12 oldest in Pennsylvania
Data | Crime | Cost of living | Movers
The receipts
Compare the top ten
Pick a metric. The bars rescale. The red line is Pennsylvania’s statewide median.
On the map
Where the quiet settles in Pennsylvania
Saturday Night Science
Methodology: How we determined the boring cities in the Keystone State
You would present the following case to your friends if you were argueing with them at a bar about the most boring place to live in Pennsylvania. And that’s why we call it Saturday Night Science.
Because our data speaks more truth than feelings.
To figure out how boring a place is, we factored in things we generally think make people exciting, and then we figure out which cities have the least number of those exciting people.
We used the U.S. American Community Census data to gather the information presented here. Some of the things people tend to think of as making a city’s population boring include:
- % of Population Over 25 (higher is more boring)
- % of Married Household (higher is more boring)
- Average Age (higher is more boring)
- % of Households With Kids (higher is more boring)
- Population density (lower is more boring)
Then, our algorithm generates a ranking for each place in these categories. After crunching the numbers, all of the cities ranked from most boring to most exciting.
For this ranking, we used every Pennsylvania city with at least 5,000 residents. This keeps us from prejudicing our rankings by including very small pockets of retired people.
Grab your rocker and hold on.
We updated this article for 2026, and it’s our eleventh time ranking the most boring cities in Pennsylvania.
The full plate
Detailed List Of The Most Boring Cities In Pennsylvania For 2026
Click any column to sort. Search by city name.
| Rank | City | Boring Score | Population | Average Age | % Married | % Kids |
|---|---|---|---|---|---|---|
| 1 | Plum | 27.50 | 26,723 | 44.4 | 46.0% | 30.0% |
| 2 | Economy | 28.50 | 9,005 | 50.7 | 50.0% | 21.7% |
| 3 | Archbald | 29.00 | 7,404 | 46.3 | 47.0% | 29.0% |
| 4 | Lower Burrell | 30.60 | 11,633 | 46.8 | 45.0% | 26.0% |
| 5 | Jefferson Hills | 33.40 | 12,317 | 42.9 | 50.0% | 34.4% |
| 6 | Hermitage | 34.50 | 16,041 | 49.9 | 42.0% | 19.7% |
| 7 | Pleasant Hills | 37.50 | 8,399 | 43.8 | 42.0% | 30.1% |
| 8 | St. Marys | 38.30 | 12,529 | 51.6 | 46.0% | 17.7% |
| 9 | Franklin Park | 38.80 | 15,235 | 41.3 | 39.0% | 41.6% |
| 10 | Old Forge | 42.80 | 8,573 | 47.4 | 36.0% | 22.6% |
| 11 | White Oak | 44.40 | 7,468 | 55.0 | 37.0% | 15.8% |
| 12 | Swoyersville | 44.80 | 5,048 | 53.0 | 39.0% | 13.3% |
| 13 | Blakely | 45.90 | 6,662 | 49.6 | 33.0% | 21.0% |
| 14 | Fox Chapel | 48.10 | 5,246 | 43.5 | 31.0% | 42.5% |
| 15 | Hollidaysburg | 48.20 | 5,558 | 42.9 | 36.0% | 24.9% |
| 16 | Palmerton | 49.20 | 5,622 | 48.3 | 33.0% | 18.8% |
| 17 | West Mifflin | 49.20 | 19,190 | 43.4 | 39.0% | 23.7% |
| 18 | Moosic | 49.30 | 5,973 | 42.7 | 31.0% | 24.5% |
| 19 | New Freedom | 49.60 | 5,066 | 45.3 | 26.0% | 34.0% |
| 20 | Camp Hill | 49.70 | 8,169 | 44.2 | 33.0% | 33.9% |
| 21 | Baldwin | 49.70 | 21,057 | 41.8 | 37.0% | 28.4% |
| 22 | Monessen | 51.00 | 6,780 | 44.9 | 36.0% | 24.3% |
| 23 | Oakmont | 51.60 | 6,702 | 44.0 | 40.0% | 25.9% |
| 24 | Mount Joy | 55.40 | 8,344 | 39.5 | 42.0% | 27.3% |
| 25 | Wyomissing | 56.40 | 11,172 | 49.2 | 29.0% | 19.9% |
| 26 | Carbondale | 56.80 | 8,789 | 42.3 | 30.0% | 32.5% |
| 27 | Emmaus | 57.00 | 11,889 | 39.1 | 37.0% | 32.6% |
| 28 | New Kensington | 57.60 | 12,011 | 48.6 | 32.0% | 21.5% |
| 29 | Brookhaven | 58.30 | 8,331 | 43.7 | 38.0% | 26.0% |
| 30 | Forest Hills | 58.40 | 6,286 | 43.8 | 38.0% | 20.8% |
| 31 | New Holland | 58.70 | 5,780 | 42.0 | 33.0% | 31.6% |
| 32 | Warren | 59.20 | 9,240 | 44.4 | 34.0% | 22.1% |
| 33 | Somerset | 59.50 | 5,944 | 44.5 | 29.0% | 21.3% |
| 34 | Jeannette | 60.00 | 8,657 | 47.1 | 34.0% | 20.8% |
| 35 | South Williamsport | 60.30 | 6,211 | 43.0 | 42.0% | 23.8% |
| 36 | Tyrone | 61.70 | 5,377 | 40.3 | 40.0% | 21.5% |
| 37 | Taylor | 62.00 | 6,265 | 39.1 | 29.0% | 30.9% |
| 38 | Punxsutawney | 62.80 | 5,665 | 44.4 | 29.0% | 24.9% |
| 39 | Aliquippa | 64.00 | 9,079 | 47.5 | 27.0% | 17.1% |
| 40 | Duryea | 64.10 | 5,084 | 39.4 | 35.0% | 26.3% |
| 41 | Monaca | 64.50 | 5,519 | 39.0 | 37.0% | 29.4% |
| 42 | Northampton | 64.60 | 10,400 | 43.0 | 32.0% | 25.5% |
| 43 | Whitehall | 64.60 | 14,811 | 43.2 | 38.0% | 21.9% |
| 44 | Sunbury | 65.50 | 9,617 | 45.1 | 35.0% | 23.9% |
| 45 | Berwick | 65.60 | 10,317 | 40.5 | 32.0% | 27.4% |
| 46 | Dunmore | 65.60 | 14,181 | 40.3 | 32.0% | 24.1% |
| 47 | Exeter | 66.10 | 5,541 | 51.5 | 23.0% | 19.0% |
| 48 | Nazareth | 66.20 | 6,043 | 45.6 | 25.0% | 24.2% |
| 49 | Bellefonte | 67.50 | 6,009 | 42.5 | 30.0% | 19.5% |
| 50 | Olyphant | 68.60 | 5,381 | 40.5 | 31.0% | 26.1% |
| 51 | Pottsville | 68.90 | 13,364 | 43.4 | 29.0% | 24.2% |
| 52 | Titusville | 69.60 | 5,189 | 44.8 | 29.0% | 21.5% |
| 53 | Birdsboro | 69.80 | 5,116 | 38.5 | 38.0% | 28.9% |
| 54 | Nanticoke | 70.80 | 10,653 | 39.3 | 27.0% | 28.4% |
| 55 | Crafton | 72.90 | 5,961 | 43.3 | 34.0% | 22.8% |
| 56 | Munhall | 73.60 | 10,548 | 42.3 | 33.0% | 24.6% |
| 57 | Souderton | 73.80 | 7,181 | 39.6 | 36.0% | 31.5% |
| 58 | Lititz | 74.10 | 9,619 | 40.0 | 36.0% | 23.8% |
| 59 | Clarks Summit | 74.30 | 5,073 | 43.8 | 31.0% | 19.2% |
| 60 | Clairton | 74.70 | 6,044 | 41.5 | 28.0% | 23.4% |
| 61 | Altoona | 74.80 | 43,196 | 40.4 | 35.0% | 26.2% |
| 62 | Ridley Park | 75.00 | 7,261 | 38.9 | 37.0% | 27.9% |
| 63 | Tamaqua | 75.40 | 6,924 | 36.2 | 29.0% | 32.5% |
| 64 | Corry | 75.50 | 6,116 | 35.8 | 29.0% | 27.9% |
| 65 | Manheim | 76.00 | 5,027 | 32.3 | 44.0% | 37.1% |
| 66 | Mechanicsburg | 76.00 | 9,720 | 40.1 | 29.0% | 23.7% |
| 67 | Columbia | 76.20 | 10,278 | 41.8 | 30.0% | 23.9% |
| 68 | Hatboro | 76.80 | 8,283 | 36.8 | 35.0% | 29.7% |
| 69 | Milton | 78.30 | 6,534 | 34.0 | 33.0% | 29.7% |
| 70 | Bradford | 78.50 | 7,683 | 40.1 | 22.0% | 28.6% |
| 71 | West View | 79.20 | 6,533 | 39.1 | 34.0% | 26.9% |
| 72 | New Cumberland | 79.30 | 7,580 | 40.2 | 33.0% | 20.6% |
| 73 | Coraopolis | 79.90 | 5,417 | 43.3 | 27.0% | 18.6% |
| 74 | Stroudsburg | 80.20 | 5,894 | 44.5 | 11.0% | 19.9% |
| 75 | Clearfield | 80.80 | 5,873 | 40.1 | 31.0% | 26.7% |
| 76 | Ephrata | 80.90 | 13,772 | 37.1 | 33.0% | 27.8% |
| 77 | Shillington | 81.60 | 5,492 | 36.9 | 34.0% | 33.1% |
| 78 | Vandergrift | 81.80 | 5,011 | 36.1 | 32.0% | 42.0% |
| 79 | Bristol | 81.80 | 9,902 | 38.9 | 31.0% | 31.2% |
| 80 | Schuylkill Haven | 81.90 | 5,253 | 38.0 | 33.0% | 27.4% |
| 81 | New Castle | 82.10 | 21,579 | 39.5 | 26.0% | 26.5% |
| 82 | New Brighton | 82.30 | 5,567 | 40.3 | 31.0% | 29.0% |
| 83 | Lehighton | 82.50 | 5,268 | 36.8 | 27.0% | 39.8% |
| 84 | Mount Carmel | 82.70 | 5,677 | 41.9 | 36.0% | 28.1% |
| 85 | Sharon | 83.20 | 12,936 | 43.0 | 26.0% | 24.4% |
| 86 | Johnstown | 83.30 | 18,087 | 44.0 | 25.0% | 20.7% |
| 87 | Norwood | 83.50 | 5,934 | 40.7 | 33.0% | 27.9% |
| 88 | Sayre | 84.30 | 5,431 | 40.4 | 22.0% | 21.1% |
| 89 | Ambler | 85.00 | 6,847 | 39.5 | 30.0% | 35.2% |
| 90 | McKeesport | 85.00 | 17,380 | 41.0 | 21.0% | 26.1% |
| 91 | Lansdowne | 85.10 | 11,122 | 41.2 | 22.0% | 31.2% |
| 92 | Chambersburg | 85.10 | 22,319 | 39.6 | 20.0% | 26.1% |
| 93 | DuBois | 85.60 | 7,402 | 37.2 | 31.0% | 19.7% |
| 94 | Perkasie | 85.60 | 9,216 | 37.6 | 38.0% | 23.1% |
| 95 | Hanover | 86.90 | 16,584 | 41.2 | 20.0% | 27.9% |
| 96 | Bangor | 87.20 | 5,163 | 37.7 | 27.0% | 32.4% |
| 97 | Waynesboro | 87.40 | 11,047 | 37.4 | 22.0% | 32.1% |
| 98 | Brentwood | 87.80 | 9,866 | 39.1 | 29.0% | 28.4% |
| 99 | Duquesne | 89.40 | 5,149 | 38.6 | 16.0% | 28.5% |
| 100 | Canonsburg | 89.50 | 9,675 | 37.9 | 29.0% | 26.3% |
Source: U.S. Census ACS 2020-2024. 175 cities with more than 5,000 residents.
Summary
There You Have It – Now That You’re Asleep
On a ranking like this, there are usually no winners, but since Pennsylvania isn’t necessarily the most boring state in the United States, the cities on this ranking can at least take solace that there are, in fact, more boring cities in the country.
The most boring cities in Pennsylvania are Plum, Economy, Archbald, Lower Burrell, Jefferson Hills, Hermitage, Pleasant Hills, St. Marys, Franklin Park, and Old Forge.
If you’re also curious enough, here are the most exciting places in Pennsylvania, according to science.