SeaTac, WA
Demographics And Statistics
Living In SeaTac, Washington Summary
Life in SeaTac research summary. HomeSnacks has been using Saturday Night Science to research the quality of life in SeaTac over the past nine years using Census, FBI, Zillow, and other primary data sources. Based on the most recently available data, we found the following about life in SeaTac:
The population in SeaTac is 31,143.
The median home value in SeaTac is $553,790.
The median income in SeaTac is $76,517.
The cost of living in SeaTac is 132 which is 1.3x higher than the national average.
The median rent in SeaTac is $1,637.
The unemployment rate in SeaTac is 8.3%.
The poverty rate in SeaTac is 10.4%.
The average high in SeaTac is 59.7° and the average low is 43.9°.
Seatac SnackAbility
Overall SnackAbility
Seatac, WA Crime Report
Crime in SeaTac summary. We use data from the FBI to determine the crime rates in SeaTac. Key points include:
There were 1,391 total crimes in SeaTac in the last reporting year.
The overall crime rate per 100,000 people in SeaTac is 4,353.7 / 100k people.
The violent crime rate per 100,000 people in SeaTac is 410.0 / 100k people.
The property crime rate per 100,000 people in SeaTac is 3,943.7 / 100k people.
Overall, crime in SeaTac is 105.44% above the national average.
Total Crimes
Above National Average
Crime In SeaTac Comparison Table
| Statistic | Count Raw |
SeaTac / 100k People |
Washington / 100k People |
National / 100k People |
|---|---|---|---|---|
| Total Crimes Per 100K | 1,391 | 4,353.7 | 2,792.6 | 2,119.2 |
| Violent Crime | 131 | 410.0 | 326.1 | 359.0 |
| Murder | 2 | 6.3 | 3.8 | 5.0 |
| Robbery | 41 | 128.3 | 67.5 | 61.0 |
| Aggravated Assault | 62 | 194.1 | 217.0 | 256.0 |
| Property Crime | 1,260 | 3,943.7 | 2,466.5 | 1,760.0 |
| Burglary | 169 | 529.0 | 398.8 | 229.0 |
| Larceny | 660 | 2,065.7 | 1,634.2 | 1,272.0 |
| Car Theft | 431 | 1,349.0 | 433.5 | 259.0 |
Seatac, WA Cost Of Living
Cost of living in SeaTac summary. We use data on the cost of living to determine how expensive it is to live in SeaTac. Real estate prices drive most of the variance in cost of living around Washington. Key points include:
The cost of living in SeaTac is 132 with 100 being average.
The cost of living in SeaTac is 1.3x higher than the national average.
The median home value in SeaTac is $553,790.
The median income in SeaTac is $76,517.
Seatac's Overall Cost Of Living
Higher Than The National Average
Cost Of Living In SeaTac Comparison Table
| Living Expense | SeaTac | Washington | National Average | |
|---|---|---|---|---|
| Overall | 132 | 118 | 100 | |
| Services | 114 | 111 | 100 | |
| Groceries | 118 | 112 | 100 | |
| Health | 113 | 122 | 100 | |
| Housing | 172 | 135 | 100 | |
| Transportation | 126 | 124 | 100 | |
| Utilities | 95 | 91 | 100 | |
Seatac, WA Weather
The average high in SeaTac is 59.7° and the average low is 43.9°.
There are 92.0 days of precipitation each year.
Expect an average of 37.7 inches of precipitation each year with 6.4 inches of snow.
| Stat | SeaTac |
|---|---|
| Average Annual High | 59.7 |
| Average Annual Low | 43.9 |
| Annual Precipitation Days | 92.0 |
| Average Annual Precipitation | 37.7 |
| Average Annual Snowfall | 6.4 |
Average High
Days of Rain
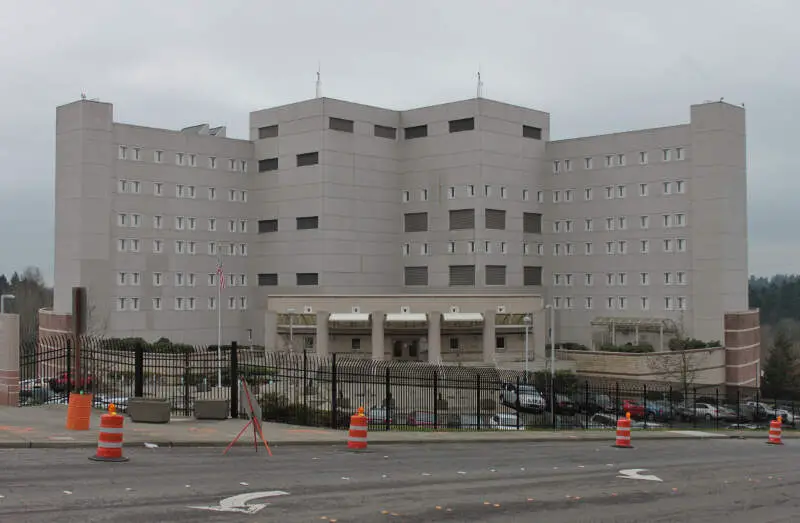
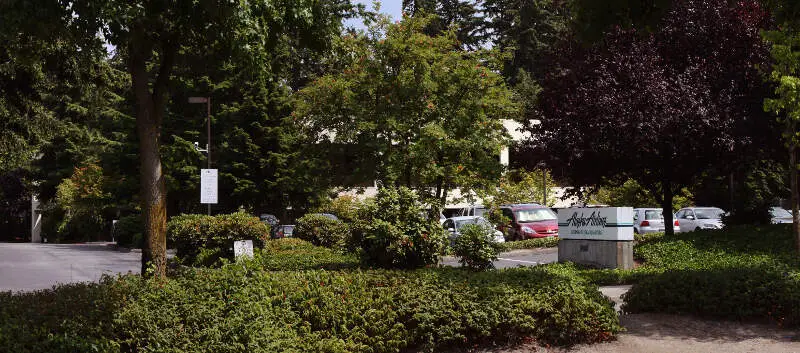
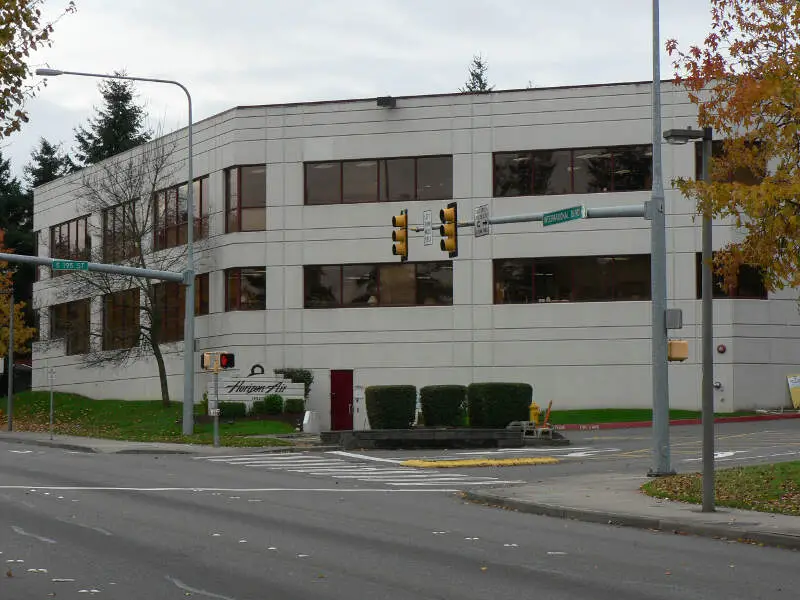
Seatac, WA Photos


Rankings for SeaTac in Washington


Locations Around SeaTac
Map Of SeaTac, WA
Best Places Around SeaTac
Gig Harbor, WA
Population 12,202
Port Orchard, WA
Population 16,398
Fife, WA
Population 10,902
Midland, WA
Population 8,676
Sumner, WA
Population 10,674
Wollochet, WA
Population 6,905
Tacoma, WA
Population 220,482
Bainbridge Island, WA
Population 24,607
Puyallup, WA
Population 42,642
Lake Tapps, WA
Population 12,360
SeaTac Demographics And Statistics
Population over time in SeaTac
The current population in SeaTac is 31,143. The population has increased 17.8% from 2010.
| Year | Population | % Change |
|---|---|---|
| 2023 | 31,143 | 0.7% |
| 2022 | 30,927 | 0.2% |
| 2021 | 30,867 | 6.1% |
| 2020 | 29,102 | 0.3% |
| 2019 | 29,019 | 0.3% |
| 2018 | 28,925 | 1.1% |
| 2017 | 28,597 | 1.1% |
| 2016 | 28,298 | 1.6% |
| 2015 | 27,859 | 0.9% |
| 2014 | 27,606 | 1.1% |
| 2013 | 27,303 | 1.1% |
| 2012 | 27,003 | 1.0% |
| 2011 | 26,735 | 1.1% |
| 2010 | 26,433 | - |
Race / Ethnicity in SeaTac
SeaTac is:
29.3% White with 9,123 White residents.
23.9% African American with 7,437 African American residents.
0.3% American Indian with 87 American Indian residents.
15.8% Asian with 4,927 Asian residents.
1.5% Hawaiian with 455 Hawaiian residents.
0.3% Other with 79 Other residents.
6.2% Two Or More with 1,935 Two Or More residents.
22.8% Hispanic with 7,100 Hispanic residents.
| Race | SeaTac | WA | USA |
|---|---|---|---|
| White | 29.3% | 64.3% | 58.2% |
| African American | 23.9% | 3.8% | 12.0% |
| American Indian | 0.3% | 0.8% | 0.5% |
| Asian | 15.8% | 9.3% | 5.7% |
| Hawaiian | 1.5% | 0.7% | 0.2% |
| Other | 0.3% | 0.5% | 0.5% |
| Two Or More | 6.2% | 6.5% | 3.9% |
| Hispanic | 22.8% | 14.1% | 19.0% |
Gender in SeaTac
SeaTac is 45.3% female with 14,103 female residents.
SeaTac is 54.7% male with 17,040 male residents.
| Gender | SeaTac | WA | USA |
|---|---|---|---|
| Female | 45.3% | 49.6% | 50.5% |
| Male | 54.7% | 50.4% | 49.5% |
Highest level of educational attainment in SeaTac for adults over 25
8.0% of adults in SeaTac completed < 9th grade.
8.0% of adults in SeaTac completed 9-12th grade.
28.0% of adults in SeaTac completed high school / ged.
21.0% of adults in SeaTac completed some college.
8.0% of adults in SeaTac completed associate's degree.
20.0% of adults in SeaTac completed bachelor's degree.
6.0% of adults in SeaTac completed master's degree.
1.0% of adults in SeaTac completed professional degree.
0.0% of adults in SeaTac completed doctorate degree.
| Education | SeaTac | WA | USA |
|---|---|---|---|
| < 9th Grade | 8.0% | 3.0% | 5.0% |
| 9-12th Grade | 8.0% | 4.0% | 6.0% |
| High School / GED | 28.0% | 22.0% | 26.0% |
| Some College | 21.0% | 22.0% | 19.0% |
| Associate's Degree | 8.0% | 10.0% | 9.0% |
| Bachelor's Degree | 20.0% | 24.0% | 21.0% |
| Master's Degree | 6.0% | 11.0% | 10.0% |
| Professional Degree | 1.0% | 2.0% | 2.0% |
| Doctorate Degree | 0.0% | 2.0% | 2.0% |
Household Income For SeaTac, Washington
3.7% of households in SeaTac earn Less than $10,000.
2.6% of households in SeaTac earn $10,000 to $14,999.
4.7% of households in SeaTac earn $15,000 to $24,999.
5.1% of households in SeaTac earn $25,000 to $34,999.
18.2% of households in SeaTac earn $35,000 to $49,999.
14.8% of households in SeaTac earn $50,000 to $74,999.
14.2% of households in SeaTac earn $75,000 to $99,999.
21.0% of households in SeaTac earn $100,000 to $149,999.
7.8% of households in SeaTac earn $150,000 to $199,999.
7.9% of households in SeaTac earn $200,000 or more.
| Income | SeaTac | WA | USA |
|---|---|---|---|
| Less than $10,000 | 3.7% | 3.8% | 4.9% |
| $10,000 to $14,999 | 2.6% | 2.7% | 3.6% |
| $15,000 to $24,999 | 4.7% | 4.9% | 6.6% |
| $25,000 to $34,999 | 5.1% | 5.3% | 6.8% |
| $35,000 to $49,999 | 18.2% | 8.6% | 10.4% |
| $50,000 to $74,999 | 14.8% | 14.6% | 15.7% |
| $75,000 to $99,999 | 14.2% | 12.6% | 12.7% |
| $100,000 to $149,999 | 21.0% | 19.2% | 17.4% |
| $150,000 to $199,999 | 7.8% | 11.3% | 9.3% |
| $200,000 or more | 7.9% | 17.2% | 12.6% |


