Whitest cities in Pennsylvania research summary. We analyzed Pennsylvania’s most recent Census data to determine the whitest cities in Pennsylvania based on the percentage of White residents.
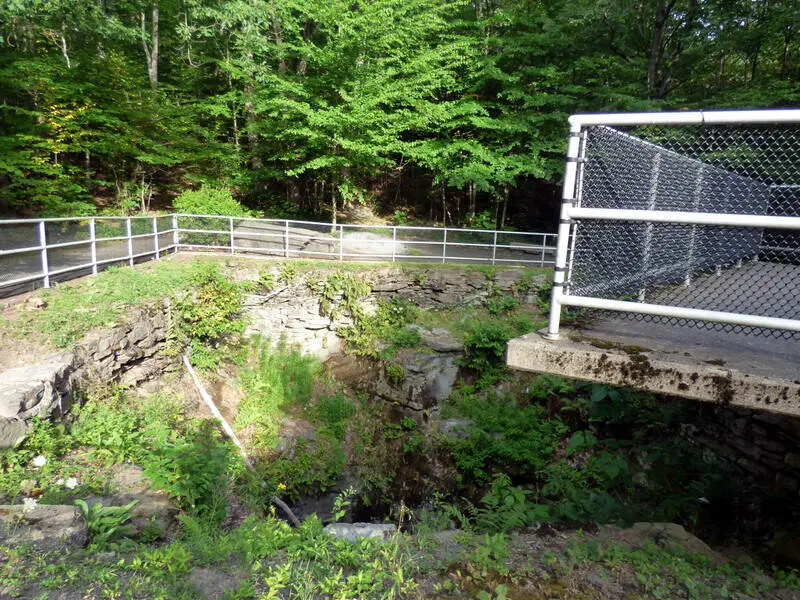
97.3% White · #1 whitest in Pennsylvania
Data | Crime | Cost of living | Movers
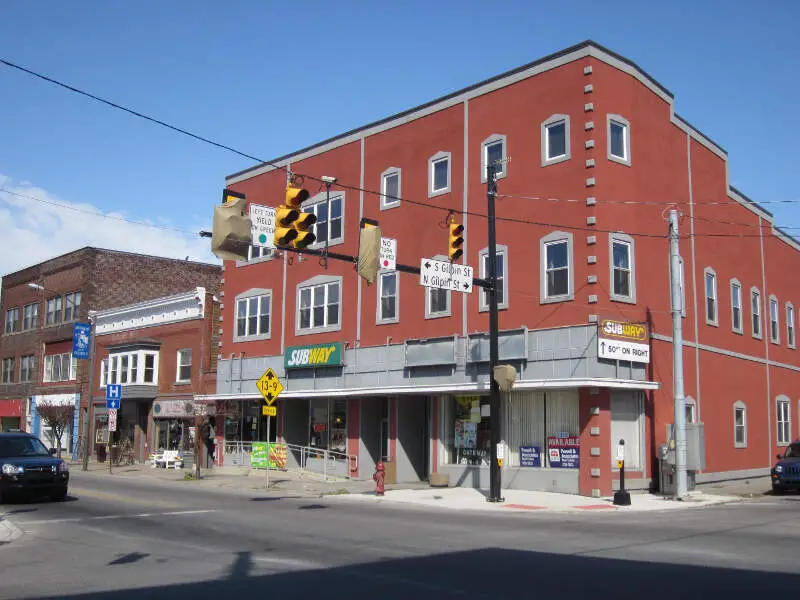
96.2% White · #2 whitest in Pennsylvania
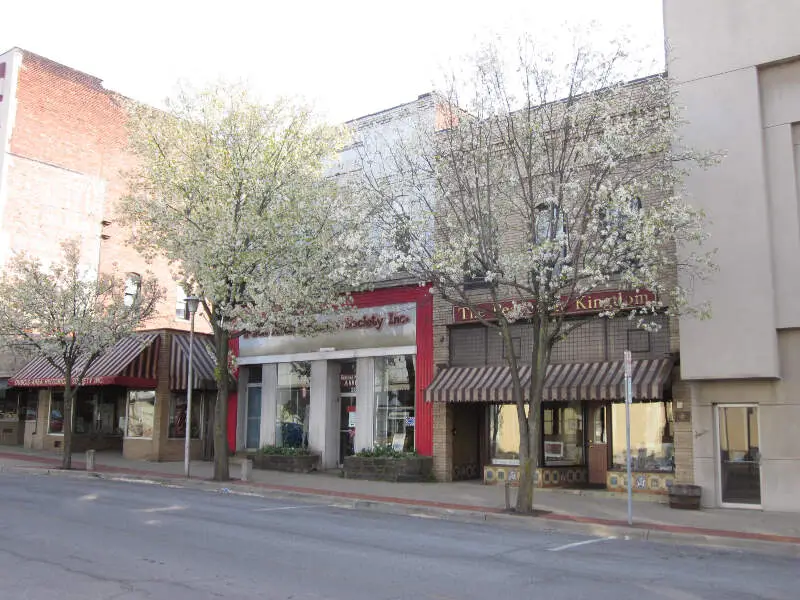
Punxsutawney ; Lenape: Punkwsutnay) is a borough in Jefferson County, Pennsylvania, United States, 84 miles northeast of Pittsburgh.
Data | Crime | Cost of living | Movers
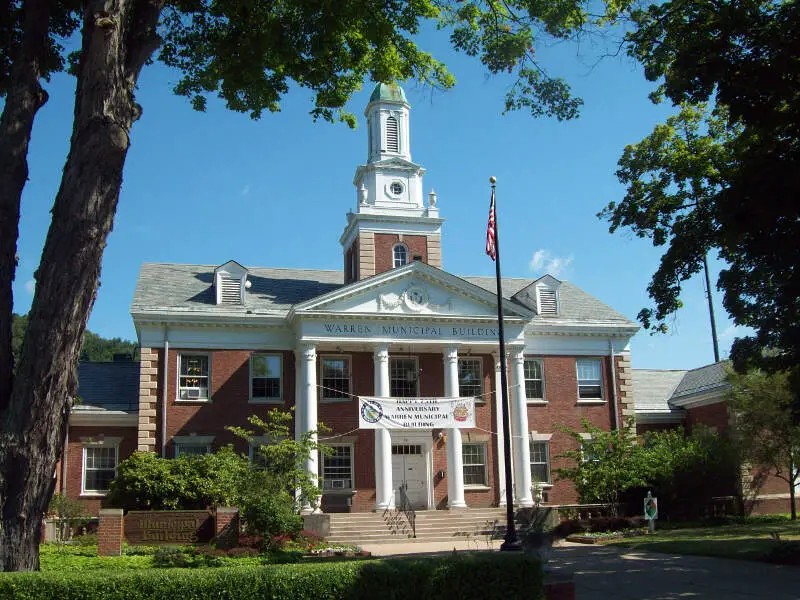
95.0% White · #3 whitest in Pennsylvania
Warren is a city in Warren County, Pennsylvania, United States, located along the Allegheny River. The population was 9,710 at the 2010 census. It is the county seat of Warren County. It is home to the headquarters of the Allegheny National Forest and the Cornplanter State Forest. It is also the headquarters for the Chief Cornplanter Council, the oldest continuously chartered Boy Scouts of America Council, and the catalog company Blair. Warren is the principal city of the Warren, PA Micropolitan Statistical Area.
Data | Crime | Cost of living | Movers
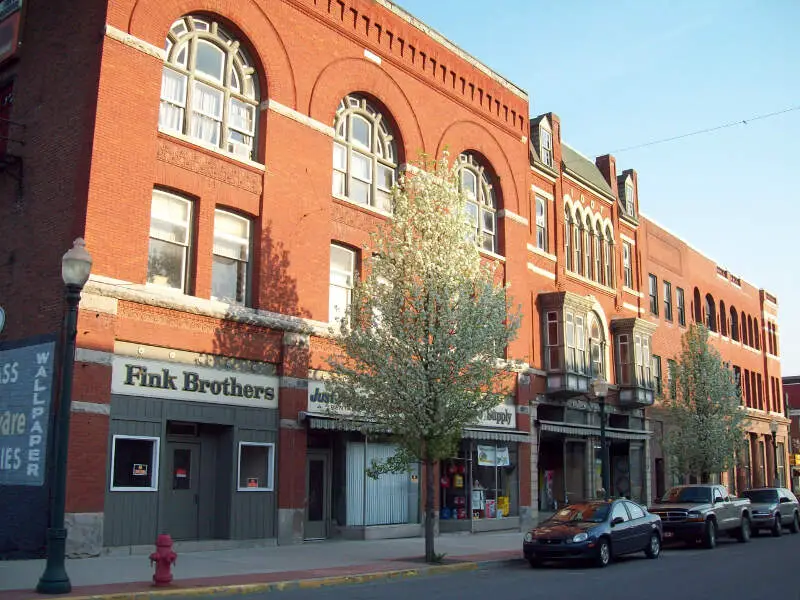
94.7% White · #4 whitest in Pennsylvania
Lower Burrell is a city in Westmoreland County in the U.S. state of Pennsylvania. Located approximately 18 miles northeast of downtown Pittsburgh, it is part of the Pittsburgh metropolitan area. The population was 11,761 at the 2010 census.
Data | Crime | Cost of living | Movers
94.6% White · #5 whitest in Pennsylvania
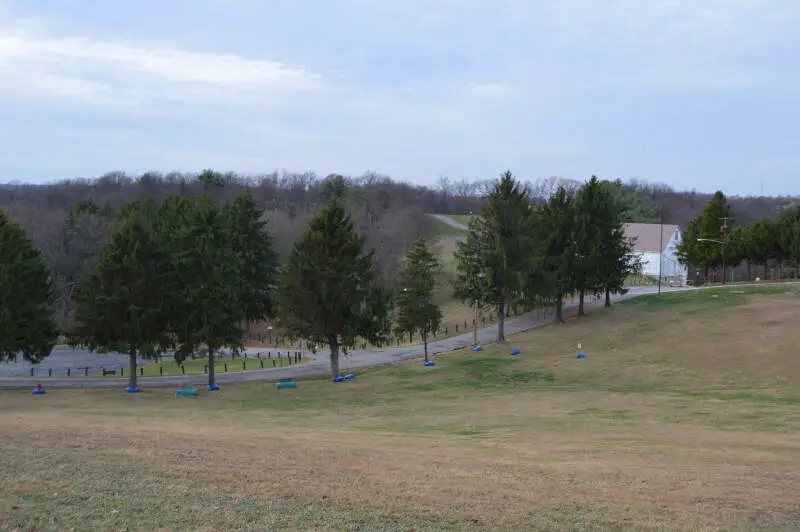
Tyrone is a borough in Blair County, Pennsylvania, 15 miles northeast of Altoona, on the Little Juniata River. Tyrone was of considerable commercial importance in the twentieth century. It was an outlet for the Clearfield coal fields, and it was noted for the manufacture of paper products. There were planing mills, and chemical and candy factories. In 1900, 5,847 people lived here; in 1910, 7,176; and in 1940, 8,845 people resided here. The population was 5,477 at the 2010 census. It is part of the Altoona, PA Metropolitan Statistical Area. It was named for County Tyrone in Ireland.
Data | Crime | Cost of living | Movers
94.6% White · #6 whitest in Pennsylvania
DuBois DOO-boys is a city in Clearfield County, Pennsylvania, United States, 100 miles northeast of Pittsburgh. The population was 7,794 at the 2010 census. It is the principal city in the DuBois, PA Micropolitan Statistical Area. DuBois is also one of two principal cities, the other being State College, that make up the larger State College-DuBois, PA Combined Statistical Area.
Data | Crime | Cost of living | Movers
94.3% White · #7 whitest in Pennsylvania
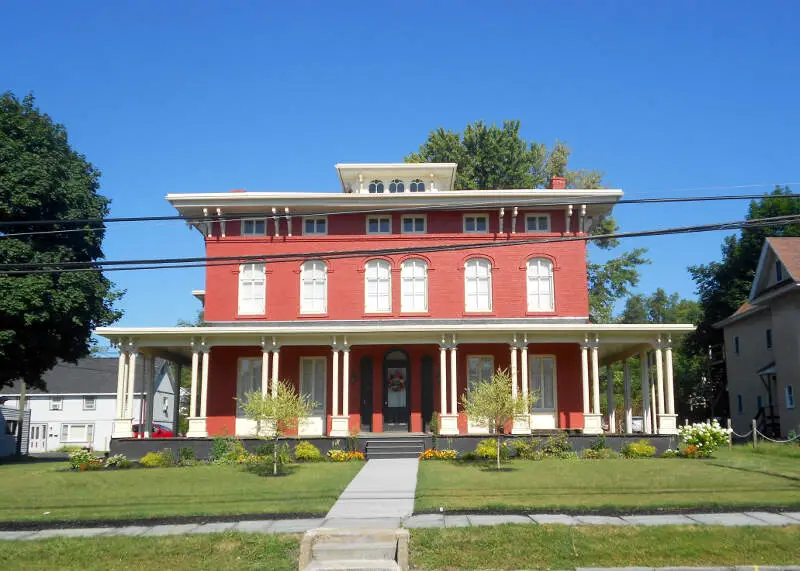
Economy is a borough in Beaver County, Pennsylvania, United States. The population was 8,970 at the 2010 census.
Data | Crime | Cost of living | Movers
94.3% White · #8 whitest in Pennsylvania
Blakely is a borough in Lackawanna County, Pennsylvania, United States. The population was 6,564 at the 2010 census.
Data | Crime | Cost of living | Movers
93.8% White · #9 whitest in Pennsylvania
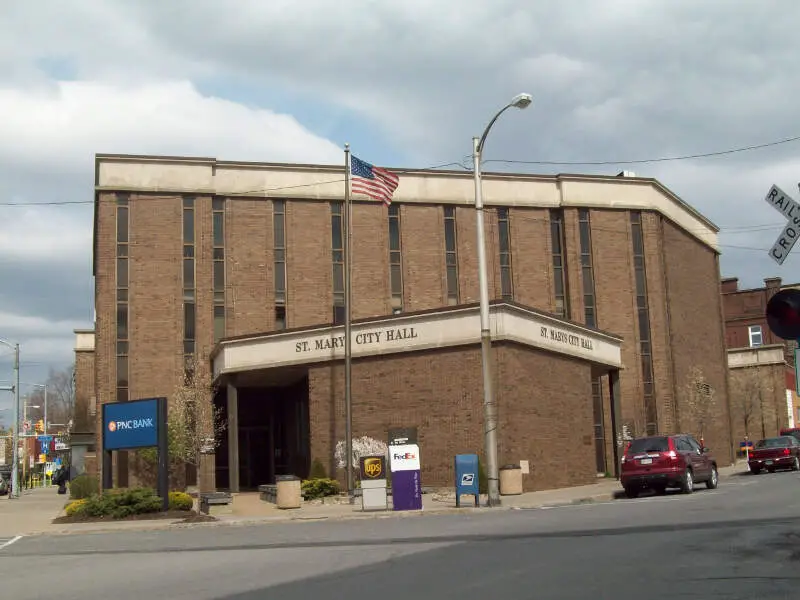
St. Marys is a city in Elk County, Pennsylvania, United States. The population was 13,070 at the 2010 census. Originally a small town inhabited by mostly Bavarian Roman Catholics, it was founded December 8, 1842. It is home to Straub Brewery and the first Benedictine convent in the United States. In 1992, the borough of St. Marys absorbed the surrounding township of Benzinger and incorporated as a city.
Data | Crime | Cost of living | Movers
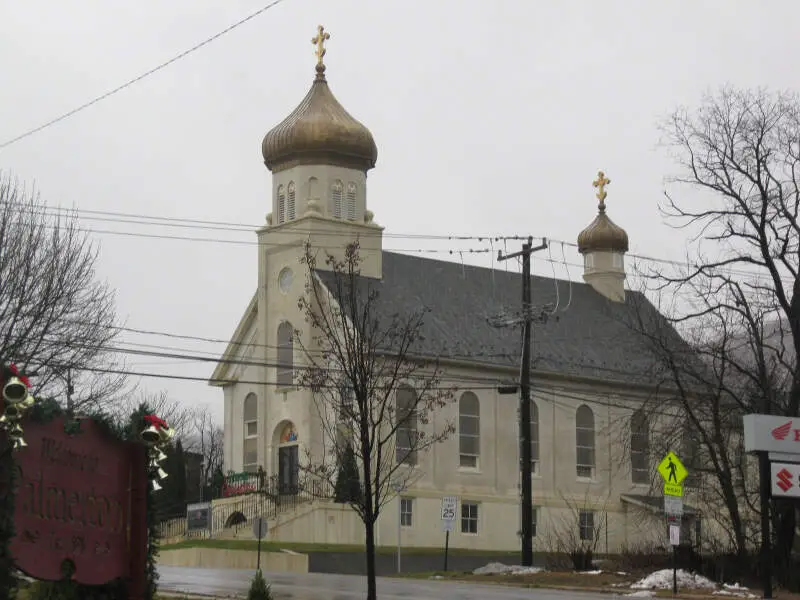
93.8% White · #10 whitest in Pennsylvania
Palmerton is a borough in Carbon County, Pennsylvania, United States. It is located in the Coal Region of the state. It is a part of lower Carbon County, which is considered part of the Lehigh Valley. The borough’s population was 5,414 at the 2010 census.
Data | Crime | Cost of living | Movers
The receipts
Compare the top ten
Pick a metric. The bars rescale. The red line is Pennsylvania’s statewide median.
On the map
Where Pennsylvania’s White population is concentrated
Saturday Night Science
Methodology: How we determined the whitest places in Pennsylvania for 2026
To rank the whitest places in Pennsylvania, we used Saturday Night Science to look at Census demographic data.
We had to look at the number of white people living in each city in Pennsylvania on a per capita basis. In other words, the percentage of white people living in each city in Pennsylvania.
We looked at table B03002: Hispanic OR LATINO ORIGIN BY RACE. Here are the category names as defined by the Census:
- Hispanic or Latino
- White alone*
- Black or African American alone*
- American Indian and Alaska Native alone*
- Asian alone*
- Native Hawaiian and Other Pacific Islander alone*
- Some other race alone*
- Two or more races*
Our particular column of interest here was the number of people who identified as White alone.
We limited our analysis to places with a population greater than 5,000 people. That left us with 184 cities.
We then calculated the percentage of residents that are White. The percentages ranked from 97.3% to 9.3%.
Finally, we ranked each city based on the percentage of the White population, with a higher percentage being more White. Archbald took the distinction of being the most White, while Yeadon was the least White city.
We updated this article for 2026. This report represents our eleventh time ranking the whitest cities in Pennsylvania.
The full plate
Cities In Pennsylvania By White Population
Click any column to sort. Search by city name.
| Rank | City | Population | White Population | % White |
|---|---|---|---|---|
| 1 | Archbald | 7,404 | 7,203 | 97.3% |
| 2 | Punxsutawney | 5,665 | 5,447 | 96.2% |
| 3 | Warren | 9,240 | 8,776 | 95.0% |
| 4 | Lower Burrell | 11,633 | 11,011 | 94.7% |
| 5 | Tyrone | 5,377 | 5,087 | 94.6% |
| 6 | DuBois | 7,402 | 7,002 | 94.6% |
| 7 | Economy | 9,005 | 8,495 | 94.3% |
| 8 | Blakely | 6,662 | 6,282 | 94.3% |
| 9 | St. Marys | 12,529 | 11,756 | 93.8% |
| 10 | Palmerton | 5,622 | 5,275 | 93.8% |
| 11 | Oil City | 9,468 | 8,856 | 93.5% |
| 12 | Clearfield | 5,873 | 5,488 | 93.4% |
| 13 | Oakmont | 6,702 | 6,251 | 93.3% |
| 14 | Titusville | 5,189 | 4,800 | 92.5% |
| 15 | Greenville | 5,523 | 5,098 | 92.3% |
| 16 | Shippensburg | 5,620 | 5,174 | 92.1% |
| 17 | Lehighton | 5,268 | 4,840 | 91.9% |
| 18 | Bradford | 7,683 | 7,048 | 91.7% |
| 19 | South Williamsport | 6,211 | 5,674 | 91.4% |
| 20 | Bellefonte | 6,009 | 5,479 | 91.2% |
| 21 | Greensburg | 14,741 | 13,432 | 91.1% |
| 22 | Ellwood City | 7,532 | 6,859 | 91.1% |
| 23 | Edinboro | 5,440 | 4,949 | 91.0% |
| 24 | Plum | 26,723 | 24,290 | 90.9% |
| 25 | Clarks Summit | 5,073 | 4,606 | 90.8% |
| 26 | Hollidaysburg | 5,558 | 5,029 | 90.5% |
| 27 | Berwick | 10,317 | 9,326 | 90.4% |
| 28 | Hermitage | 16,041 | 14,422 | 89.9% |
| 29 | Grove City | 7,830 | 7,037 | 89.9% |
| 30 | Mount Carmel | 5,677 | 5,096 | 89.8% |
| 31 | Lititz | 9,619 | 8,631 | 89.7% |
| 32 | Butler | 13,212 | 11,850 | 89.7% |
| 33 | Somerset | 5,944 | 5,318 | 89.5% |
| 34 | Perkasie | 9,216 | 8,244 | 89.5% |
| 35 | Doyle | 8,341 | 7,453 | 89.4% |
| 36 | Swoyersville | 5,048 | 4,510 | 89.3% |
| 37 | Corry | 6,116 | 5,454 | 89.2% |
| 38 | Jefferson Hills | 12,317 | 10,975 | 89.1% |
| 39 | Meadville | 12,577 | 11,162 | 88.7% |
| 40 | Lock Haven | 8,447 | 7,480 | 88.6% |
| 41 | Brookhaven | 8,331 | 7,375 | 88.5% |
| 42 | Dunmore | 14,181 | 12,521 | 88.3% |
| 43 | Birdsboro | 5,116 | 4,515 | 88.3% |
| 44 | Sayre | 5,431 | 4,790 | 88.2% |
| 45 | Dickson City | 6,023 | 5,303 | 88.0% |
| 46 | Altoona | 43,196 | 38,028 | 88.0% |
| 47 | Pleasant Hills | 8,399 | 7,388 | 88.0% |
| 48 | Mechanicsburg | 9,720 | 8,545 | 87.9% |
| 49 | Indiana | 14,212 | 12,459 | 87.7% |
| 50 | Franklin | 5,984 | 5,224 | 87.3% |
| 51 | Monaca | 5,519 | 4,809 | 87.1% |
| 52 | Fox Chapel | 5,246 | 4,569 | 87.1% |
| 53 | Lewisburg | 5,257 | 4,572 | 87.0% |
| 54 | Elizabet | 11,925 | 10,364 | 86.9% |
| 55 | White Oak | 7,468 | 6,463 | 86.5% |
| 56 | Dormont | 8,063 | 6,972 | 86.5% |
| 57 | Castle Shannon | 8,209 | 7,094 | 86.4% |
| 58 | Selinsgrove | 5,593 | 4,832 | 86.4% |
| 59 | Schuylkill Haven | 5,253 | 4,538 | 86.4% |
| 60 | Ephrata | 13,772 | 11,832 | 85.9% |
| 61 | Pottsville | 13,364 | 11,434 | 85.6% |
| 62 | Olyphant | 5,381 | 4,590 | 85.3% |
| 63 | Huntingdon | 6,897 | 5,879 | 85.2% |
| 64 | Vandergrift | 5,011 | 4,270 | 85.2% |
| 65 | Norwood | 5,934 | 5,038 | 84.9% |
| 66 | Camp Hill | 8,169 | 6,927 | 84.8% |
| 67 | Waynesboro | 11,047 | 9,359 | 84.7% |
| 68 | Canonsburg | 9,675 | 8,192 | 84.7% |
| 69 | Lewi | 8,479 | 7,162 | 84.5% |
| 70 | Bangor | 5,163 | 4,359 | 84.4% |
| 71 | Tamaqua | 6,924 | 5,834 | 84.3% |
| 72 | Red Lion | 6,516 | 5,487 | 84.2% |
| 73 | Bloomsburg | 13,024 | 10,963 | 84.2% |
| 74 | Exeter | 5,541 | 4,664 | 84.2% |
| 75 | West View | 6,533 | 5,493 | 84.1% |
| 76 | West Mifflin | 19,190 | 16,084 | 83.8% |
| 77 | Wyomissing | 11,172 | 9,347 | 83.7% |
| 78 | Emmaus | 11,889 | 9,890 | 83.2% |
| 79 | Ridley Park | 7,261 | 6,034 | 83.1% |
| 80 | Conshohocken | 9,282 | 7,709 | 83.1% |
| 81 | Bellevue | 8,128 | 6,736 | 82.9% |
| 82 | Munhall | 10,548 | 8,712 | 82.6% |
| 83 | New Kensington | 12,011 | 9,908 | 82.5% |
| 84 | Nazareth | 6,043 | 4,972 | 82.3% |
| 85 | Shamokin | 6,853 | 5,630 | 82.2% |
| 86 | Old Forge | 8,573 | 7,027 | 82.0% |
| 87 | Mount Joy | 8,344 | 6,835 | 81.9% |
| 88 | Sunbury | 9,617 | 7,869 | 81.8% |
| 89 | Northampton | 10,400 | 8,496 | 81.7% |
| 90 | Media | 5,870 | 4,791 | 81.6% |
| 91 | Milton | 6,534 | 5,311 | 81.3% |
| 92 | Hatboro | 8,283 | 6,711 | 81.0% |
| 93 | Baldwin | 21,057 | 16,948 | 80.5% |
| 94 | Carbondale | 8,789 | 7,053 | 80.2% |
| 95 | Connellsville | 6,849 | 5,469 | 79.9% |
| 96 | Carnegie | 7,978 | 6,355 | 79.7% |
| 97 | Moosic | 5,973 | 4,750 | 79.5% |
| 98 | Pittston | 7,626 | 6,056 | 79.4% |
| 99 | Crafton | 5,961 | 4,713 | 79.1% |
| 100 | Franklin Park | 15,235 | 12,043 | 79.0% |
Source: U.S. Census ACS 2020-2024. 184 cities with more than 5,000 residents.
Summary
Summary: White Populations Across Pennsylvania
We measured the locations with the highest percentage of white people in Pennsylvania. According to the most recent data, this list provides accurate information on the whitest places in Pennsylvania.
The most White cities in Pennsylvania are Archbald, Punxsutawney, Warren, Lower Burrell, Tyrone, DuBois, Economy, Blakely, St. Marys, and Palmerton. Not sold on Pennsylvania? Take the two-minute Find Your Place quiz and see which state actually fits you.


