Everyone wants a bit of a blissful breeze or a scoop of sunny sanctuary when looking for a place to live in Illinois.
The more sun, the more you can go outside. The more you go outside, the more you’ll feel at peace. The more you’ll feel at peace, the more you’ll enjoy where you live.
So it makes sense to try and find the places with the best weather in Illinois. We used Saturday Night Science to compare the number of sunny days, total precipitation, and the deviation from the ideal 70-degree weather for 222 places in Illinois over 10,000 people.
Grab your shades and put away your raincoat as we look at the cities with the best weather in Illinois.
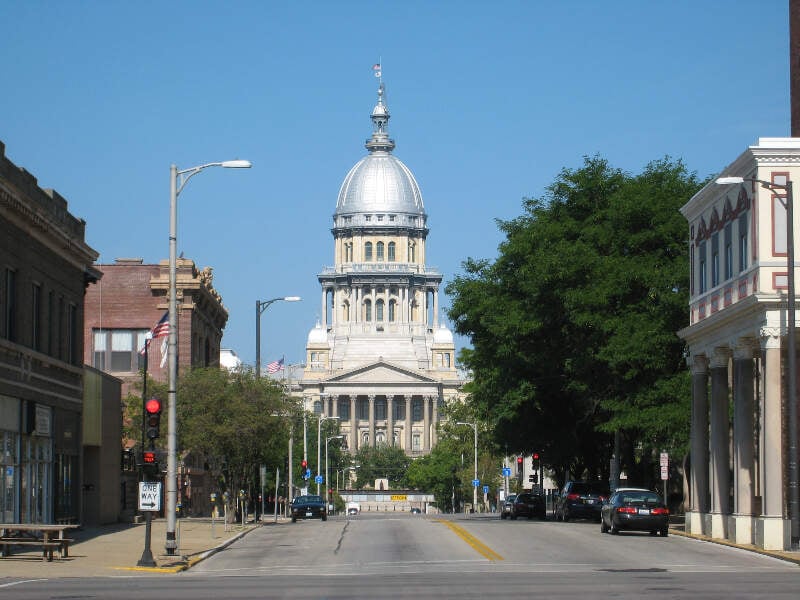
296.7 sunny days · 63.0 degree average high
Springfield is the capital of the U.S. state of Illinois and the county seat of Sangamon County. The city’s population of 116,250 as of the 2010 U.S. Census makes it the state’s sixth most populous city. It is the largest city in central Illinois. As of 2013, the city’s population was estimated to have increased to 117,006, with just over 211,700 residents living in the Springfield Metropolitan Statistical Area, which includes Sangamon County and the adjacent Menard County.
Data | Crime | Cost of living | Movers
294.6 sunny days · 63.2 degree average high
Data | Crime | Cost of living | Movers
299.8 sunny days · 65.7 degree average high
Waterloo is a city in Monroe County, Illinois, United States. The population was 9,811 at the 2010 census. It is the county seat of Monroe County.
Data | Crime | Cost of living | Movers
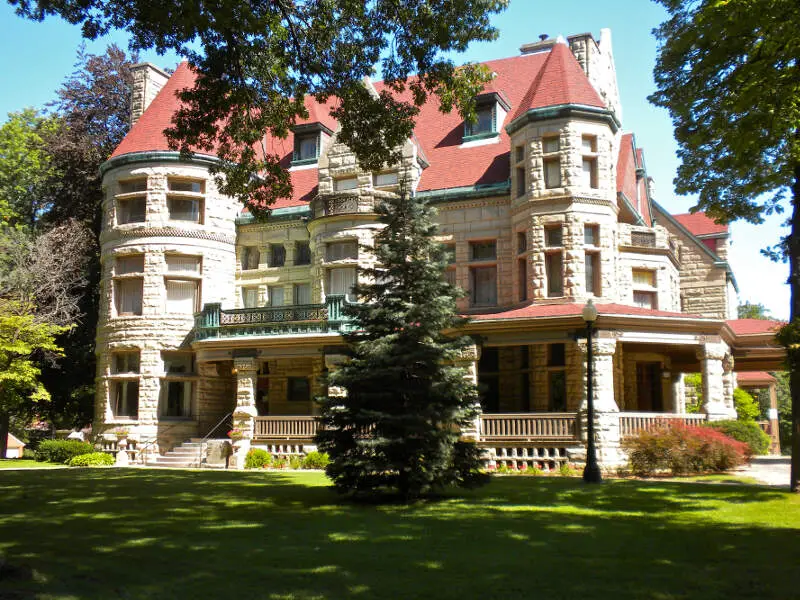
298.6 sunny days · 63.2 degree average high
Quincy, known as Illinois’s “Gem City,” is a city in and the county seat of Adams County, Illinois, United States, located on the Mississippi River. The 2010 census counted a population of 40,633 in the city itself, up from 40,366 in 2000. As of July 1, 2015, the Quincy Micro Area had an estimated population of 77,220.
Data | Crime | Cost of living | Movers
297.0 sunny days · 61.7 degree average high
Macomb is a city in and the county seat of McDonough County, Illinois, United States. It is situated in western Illinois, southwest of Galesburg. The city is about 75 miles southwest of Peoria and 77 miles south of the Quad Cities. A special census held in 2014 placed the city’s population at 21,516. Macomb is the home of Western Illinois University.
Data | Crime | Cost of living | Movers
295.8 sunny days · 66.2 degree average high
Belleville is a city in St. Clair County, Illinois, coterminous with the now defunct Belleville Township. The population was 42,034 according to the Census Bureau’s 2015 estimates.
Data | Crime | Cost of living | Movers
295.8 sunny days · 65.8 degree average high
O’Fallon is a city in St. Clair County, Illinois, United States, and one of the fastest-growing communities in the Metropolitan St. Louis area. A 2017 special census listed the city’s population at 30,440. The city is the second largest city in the Metro-East region and Southern Illinois. Due to its close proximity to Scott Air Force Base, the population receives a boost from military and federal civilian personnel, defense contractors, and military retirees.
Data | Crime | Cost of living | Movers
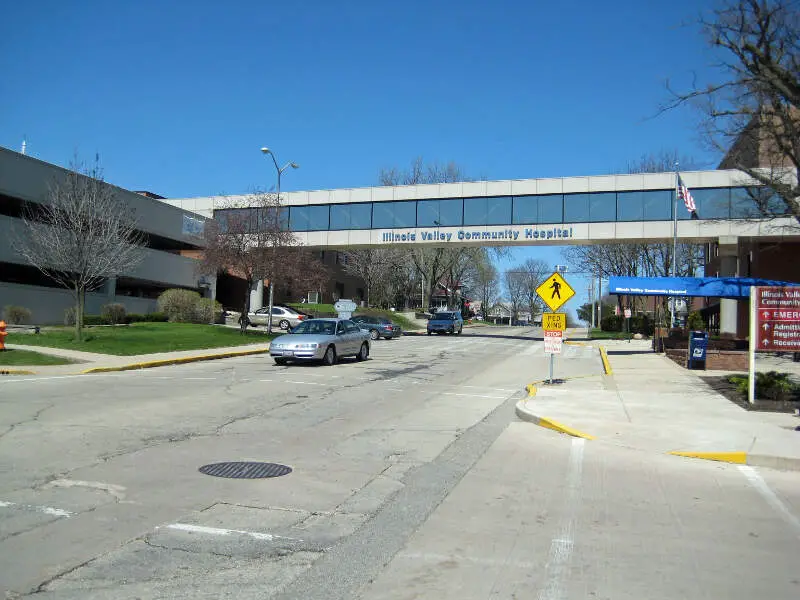
296.5 sunny days · 60.2 degree average high
Peru is a city in LaSalle County, Illinois, United States. The population was 10,295 at the 2010 census. It is part of the Ottawa-Peru, IL Micropolitan Statistical Area. Peru and its twin city, LaSalle, make up the core of Illinois Valley.
Data | Crime | Cost of living | Movers
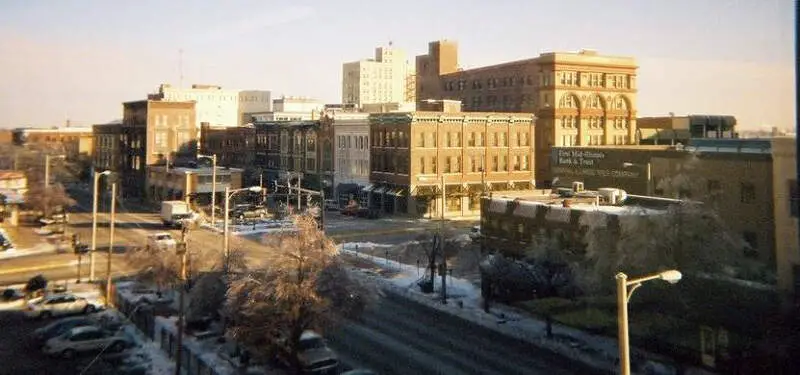
297.0 sunny days · 63.2 degree average high
Decatur is the largest city and the county seat of Macon County in the U.S. state of Illinois. The city was founded in 1829 and is along the Sangamon River and Lake Decatur in Central Illinois. In 2016, the city’s estimated population was 72,706.
Data | Crime | Cost of living | Movers
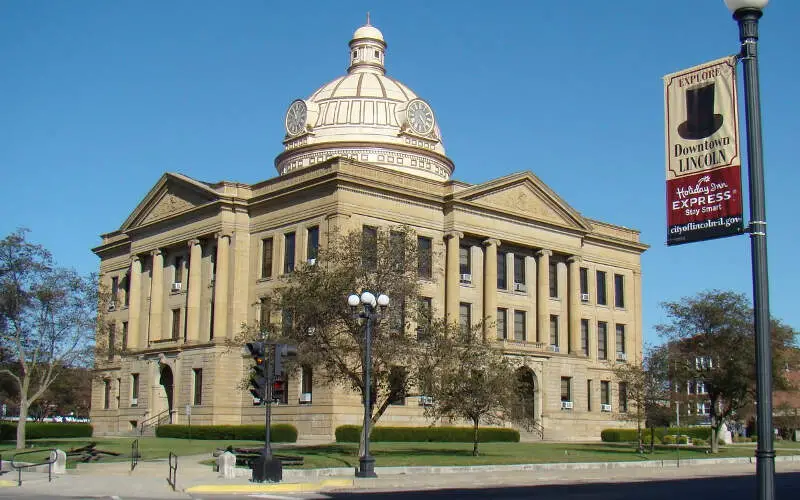
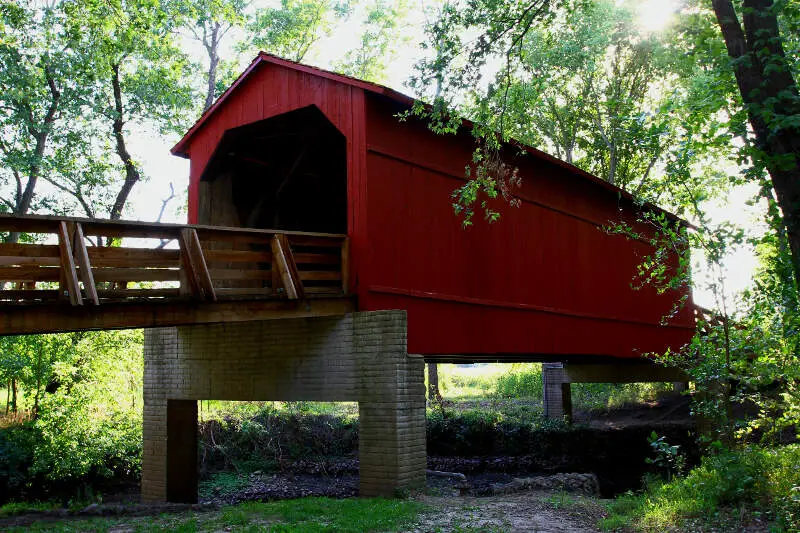
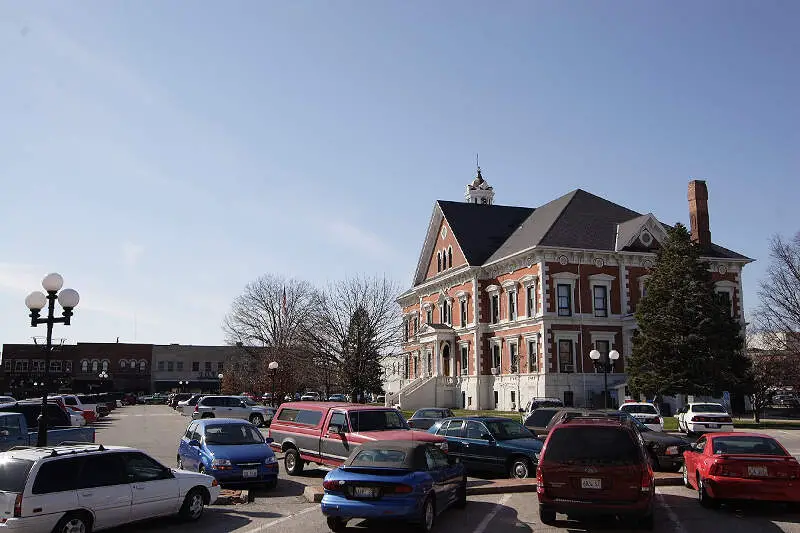
297.0 sunny days · 62.6 degree average high
Lincoln is a city in Logan County, Illinois, United States. It is the only town in the United States that was named for and by Abraham Lincoln before he became president; he practiced law there from 1847 to 1859. First settled in the 1830s, Lincoln is home to three colleges and two prisons. The three colleges are Lincoln College, Lincoln Christian University, and Heartland Community College. It is also the home of the world’s largest covered wagon.
Data | Crime | Cost of living | Movers
The receipts
Compare the top ten
Pick a metric. The bars rescale. The red line is Illinois’s statewide median.
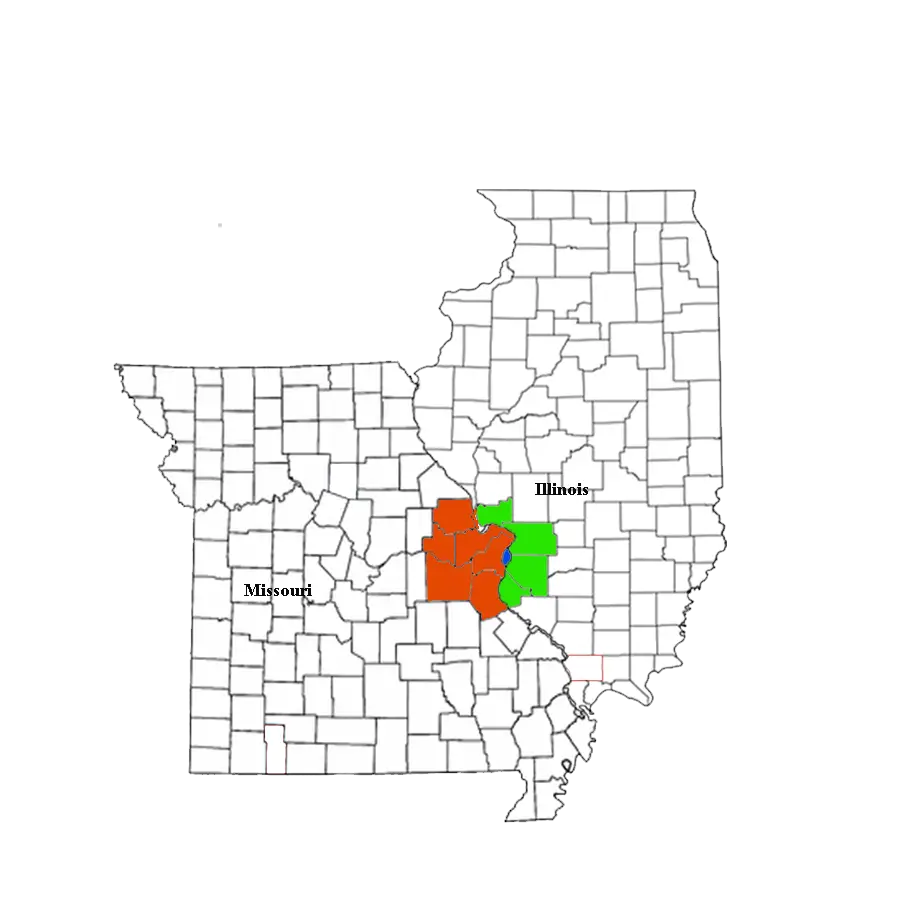
On the map
Where Illinois’s best weather is
Saturday Night Science
How We Determined The Cities In Illinois With The Best Weather
To rank the most fair weather cities in Illinois, we used Saturday Night Science and the National Oceanic and Atmospheric Administration (NOAA) database, to see which cities in the Prairie State get the best weather.
We used the following criteria to find the best weather:
- Number of sunny days
- Highest average low
- Average high deviation from 70 degrees
- Least amount of rain
- Least amount of snow
We ranked each city of over 10,000 people in Illinois from best to worst on each criterion. We then averaged each ranking into a weather quality index. The city with the best index, Springfield, was anointed the city with the best weather in Illinois.
Before we get too far, here are the annual precipitation rates for major cities: Chicago (38.1 inches), Aurora (36.9 inches), and Rockford (35.2 inches).
The cities with the best weather in Illinois are Springfield, Chatham, Waterloo, Quincy, Macomb, Belleville, O’Fallon, Peru, Decatur, and Lincoln.
There’s a complete chart at the bottom.
The full plate
Detailed List Of Places With The Best Weather In Illinois
Click any column to sort. Search by city name.
| Rank | City | Population | Sunny Days | Avg. High | Precipitation (Inches) | Snow (Inches) |
|---|---|---|---|---|---|---|
| 1 | Springfield | 117,061 | 296.7 | 63.0 | 36.9 | 19.1 |
| 2 | Chatham | 12,341 | 294.6 | 63.2 | 37.0 | 18.9 |
| 3 | Waterloo | 10,151 | 299.8 | 65.7 | 42.9 | 11.7 |
| 4 | Quincy | 40,763 | 298.6 | 63.2 | 38.6 | 17.9 |
| 5 | Macomb | 18,944 | 297.0 | 61.7 | 37.2 | 19.1 |
| 6 | Belleville | 42,898 | 295.8 | 66.2 | 41.5 | 12.6 |
| 7 | O’Fallon | 29,144 | 295.8 | 65.8 | 41.2 | 12.5 |
| 8 | Peru | 10,019 | 296.5 | 60.2 | 36.1 | 23.4 |
| 9 | Decatur | 74,654 | 297.0 | 63.2 | 39.7 | 15.3 |
| 10 | Lincoln | 14,285 | 297.0 | 62.6 | 38.7 | 19.3 |
| 11 | Peoria | 115,847 | 294.9 | 61.4 | 36.4 | 23.2 |
| 12 | Ottawa | 18,565 | 296.3 | 60.3 | 36.6 | 21.1 |
| 13 | Morris | 14,402 | 296.6 | 60.1 | 36.3 | 23.6 |
| 14 | East Moline | 21,422 | 296.1 | 59.8 | 36.1 | 29.3 |
| 15 | Marion | 17,588 | 295.4 | 66.3 | 46.6 | 13.0 |
| 16 | Taylorville | 11,068 | 295.4 | 63.6 | 39.1 | 15.7 |
| 17 | Streator | 12,990 | 297.4 | 60.4 | 37.5 | 25.3 |
| 18 | Glen Carbon | 12,882 | 293.6 | 65.4 | 42.0 | 12.5 |
| 19 | Rock Island | 38,946 | 296.1 | 59.8 | 36.2 | 30.4 |
| 20 | Jacksonville | 19,241 | 295.8 | 63.3 | 39.6 | 17.7 |
| 21 | Canton | 14,539 | 297.8 | 61.8 | 38.3 | 20.7 |
| 22 | Alton | 27,335 | 293.7 | 65.0 | 41.2 | 15.2 |
| 23 | Fairview Heights | 17,014 | 293.4 | 66.2 | 41.9 | 12.9 |
| 24 | Cahokia | 14,740 | 293.4 | 66.2 | 41.9 | 12.9 |
| 25 | Swansea | 13,869 | 293.4 | 66.2 | 41.9 | 12.9 |
| 26 | Shiloh | 12,902 | 293.4 | 66.2 | 41.9 | 12.9 |
| 27 | Mount Vernon | 15,136 | 293.9 | 65.3 | 43.4 | 12.2 |
| 28 | Moline | 43,062 | 296.2 | 59.7 | 36.4 | 30.6 |
| 29 | Pontiac | 12,085 | 294.2 | 60.8 | 37.0 | 20.8 |
| 30 | Collinsville | 25,025 | 293.1 | 65.3 | 41.6 | 13.1 |
| 31 | Edwardsville | 24,896 | 293.1 | 65.3 | 41.6 | 13.1 |
| 32 | Wood River | 10,417 | 293.1 | 65.3 | 41.6 | 13.1 |
| 33 | Granite City | 29,421 | 292.7 | 65.7 | 41.7 | 14.4 |
| 34 | Pekin | 33,905 | 292.8 | 61.9 | 37.1 | 24.4 |
| 35 | Joliet | 147,918 | 296.6 | 59.8 | 37.4 | 28.5 |
| 36 | Centralia | 12,798 | 292.5 | 65.1 | 42.7 | 10.6 |
| 37 | Morton | 16,534 | 292.6 | 61.7 | 37.4 | 23.2 |
| 38 | Washington | 15,824 | 292.6 | 61.7 | 37.4 | 23.2 |
| 39 | Bloomington | 78,206 | 294.8 | 61.4 | 38.5 | 20.7 |
| 40 | Kewanee | 12,736 | 298.7 | 59.4 | 36.9 | 25.6 |
| 41 | Effingham | 12,513 | 292.7 | 64.3 | 42.0 | 14.8 |
| 42 | Sterling | 15,170 | 297.7 | 59.5 | 36.5 | 29.7 |
| 43 | Normal | 54,488 | 294.2 | 61.5 | 38.4 | 20.1 |
| 44 | East Peoria | 23,137 | 290.1 | 61.4 | 36.0 | 23.1 |
| 45 | Rantoul | 13,256 | 295.7 | 61.8 | 39.2 | 18.9 |
| 46 | Galesburg | 31,696 | 293.8 | 60.1 | 38.1 | 23.1 |
| 47 | Carbondale | 26,192 | 290.6 | 66.8 | 45.3 | 9.8 |
| 48 | Godfrey | 17,868 | 291.9 | 65.0 | 41.2 | 14.2 |
| 49 | Columbia | 10,029 | 289.6 | 66.2 | 42.9 | 12.6 |
| 50 | Lockport | 25,088 | 296.6 | 59.7 | 38.2 | 31.3 |
| 51 | Herrin | 12,797 | 289.7 | 66.3 | 45.7 | 11.7 |
| 52 | Elmhurst | 45,469 | 298.1 | 59.3 | 37.9 | 32.1 |
| 53 | East St. Louis | 26,689 | 289.6 | 66.2 | 42.2 | 13.6 |
| 54 | Dolton | 23,283 | 294.3 | 59.6 | 38.3 | 31.1 |
| 55 | Charleston | 21,552 | 291.5 | 63.3 | 40.9 | 16.0 |
| 56 | Riverdale | 13,106 | 294.2 | 59.6 | 38.4 | 31.5 |
| 57 | Woodridge | 33,321 | 296.3 | 59.6 | 38.3 | 29.4 |
| 58 | Channahon | 12,845 | 292.2 | 60.1 | 36.7 | 22.3 |
| 59 | Montgomery | 19,196 | 294.4 | 59.3 | 36.6 | 28.6 |
| 60 | Mattoon | 17,646 | 289.5 | 63.2 | 40.4 | 14.7 |
| 61 | New Lenox | 25,024 | 293.3 | 59.7 | 38.0 | 28.2 |
| 62 | Homer Glen | 24,358 | 293.3 | 59.7 | 38.0 | 28.2 |
| 63 | Mokena | 19,369 | 293.3 | 59.7 | 38.0 | 28.2 |
| 64 | Frankfort | 18,295 | 293.3 | 59.7 | 38.0 | 28.2 |
| 65 | Shorewood | 16,354 | 293.3 | 59.7 | 38.0 | 28.2 |
| 66 | Yorkville | 18,222 | 293.2 | 59.4 | 36.3 | 27.0 |
| 67 | North Aurora | 17,154 | 294.4 | 59.0 | 35.9 | 27.7 |
| 68 | Batavia | 26,105 | 294.4 | 59.0 | 34.8 | 28.8 |
| 69 | Aurora | 200,614 | 294.4 | 59.3 | 36.9 | 28.1 |
| 70 | Kankakee | 26,821 | 292.4 | 60.4 | 37.8 | 24.3 |
| 71 | Bourbonnais | 18,656 | 292.4 | 60.4 | 37.8 | 24.3 |
| 72 | Bradley | 15,763 | 292.4 | 60.4 | 37.8 | 24.3 |
| 73 | Romeoville | 39,774 | 296.3 | 59.6 | 38.4 | 30.9 |
| 74 | Oswego | 32,468 | 292.7 | 59.3 | 36.4 | 26.4 |
| 75 | Plano | 11,920 | 292.7 | 59.3 | 36.4 | 26.4 |
| 76 | Forest Park | 14,194 | 295.9 | 59.6 | 38.9 | 34.8 |
| 77 | Minooka | 11,505 | 290.1 | 59.8 | 36.7 | 22.2 |
| 78 | Danville | 32,337 | 287.2 | 62.2 | 40.4 | 18.0 |
| 79 | Addison | 37,270 | 295.9 | 59.0 | 37.4 | 33.2 |
| 80 | Carpentersville | 38,264 | 294.3 | 58.6 | 35.9 | 30.0 |
| 81 | St. Charles | 33,685 | 294.3 | 58.6 | 35.9 | 30.0 |
| 82 | Geneva | 21,704 | 294.3 | 58.6 | 35.9 | 30.0 |
| 83 | Campton Hills | 11,012 | 294.3 | 58.6 | 35.9 | 30.0 |
| 84 | North Chicago | 29,925 | 298.7 | 56.7 | 34.8 | 38.8 |
| 85 | Dixon | 15,196 | 295.7 | 58.4 | 36.3 | 28.2 |
| 86 | Brookfield | 18,964 | 292.5 | 59.8 | 38.9 | 34.1 |
| 87 | Wheaton | 53,585 | 293.6 | 59.3 | 37.5 | 30.8 |
| 88 | Lombard | 43,957 | 293.6 | 59.3 | 37.5 | 30.8 |
| 89 | Glen Ellyn | 27,890 | 293.6 | 59.3 | 37.5 | 30.8 |
| 90 | Lisle | 22,747 | 293.6 | 59.3 | 37.5 | 30.8 |
| 91 | Darien | 22,263 | 293.6 | 59.3 | 37.5 | 30.8 |
| 92 | Bloomingdale | 22,261 | 293.6 | 59.3 | 37.5 | 30.8 |
| 93 | Villa Park | 21,800 | 293.6 | 59.3 | 37.5 | 30.8 |
| 94 | Bensenville | 18,485 | 293.6 | 59.3 | 37.5 | 30.8 |
| 95 | Wood Dale | 13,923 | 293.6 | 59.3 | 37.5 | 30.8 |
| 96 | Warrenville | 13,373 | 293.6 | 59.3 | 37.5 | 30.8 |
| 97 | Burr Ridge | 10,753 | 293.6 | 59.3 | 37.5 | 30.8 |
| 98 | Downers Grove | 49,504 | 293.2 | 59.6 | 38.3 | 29.8 |
| 99 | Belvidere | 25,741 | 297.8 | 57.8 | 35.5 | 33.7 |
| 100 | Sycamore | 17,572 | 298.0 | 58.1 | 36.7 | 31.4 |
Source: NOAA climate data. 222 Illinois cities with more than 10,000 residents.
Summary
Summary: The Cities With The Best Weather In Illinois For 2026
If you’re looking for the Illinois cities with the most sunny days, the least rain and snow, and highs closest to a perfect 70 degrees, this is an accurate list.
The cities with the best weather in Illinois are Springfield, Chatham, Waterloo, Quincy, Macomb, Belleville, O’Fallon, Peru, Decatur, and Lincoln.


