
Everyone wants a bit of a blissful breeze or a scoop of sunny sanctuary when looking for a place to live in Texas.
The more sun, the more you can go outside. The more you go outside, the more you’ll feel at peace. The more you’ll feel at peace, the more you’ll enjoy where you live.
So it makes sense to try and find the places with the best weather in Texas. We used Saturday Night Science to compare the number of sunny days, total precipitation, and the deviation from the ideal 70-degree weather for 245 places in Texas over 10,000 people.
Grab your shades and put away your raincoat as we look at the cities with the best weather in Texas.
Table Of Contents: Top Ten | Methodology | Table

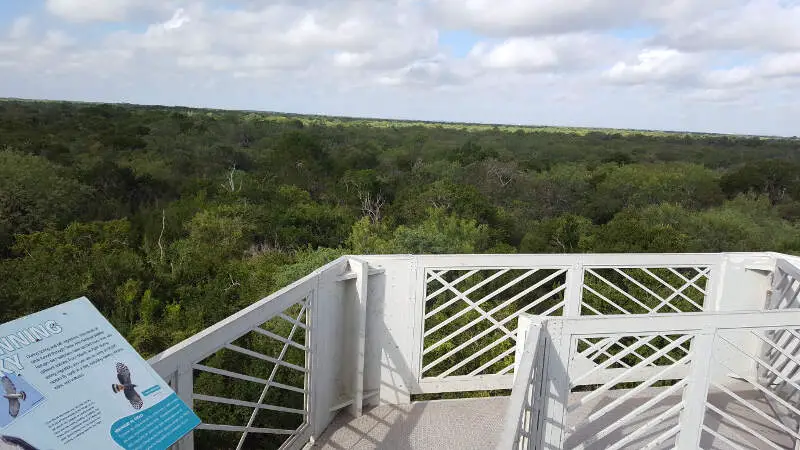
What city has the best weather in Texas, with more than 10,000 people? The city with the best weather in Texas is Pharr with 0.0 sunny days and an average high of 85.2 degrees.
Read on below to see where your city ranked.
And if you already knew these places were beautiful, check out the best places to live in Texas or the cheapest places in Texas.
The 10 Snowiest Cities In Texas For 2025

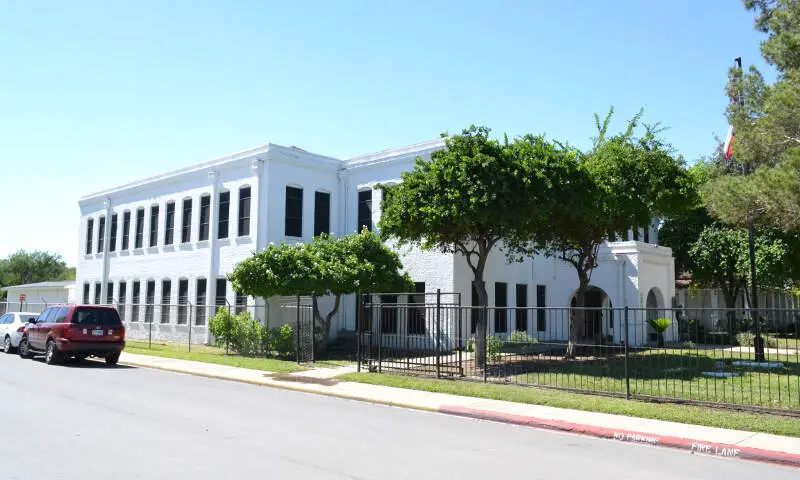
Population: 74,273
Average Annual High: 85.2 degrees
Average Annual Low: 63.9 degrees
Average Annual Snowfall: 0.0 inches
Average Annual Precipitation: 21.3 inches
Sunny Days: 333.9 days
More on Pharr: Data

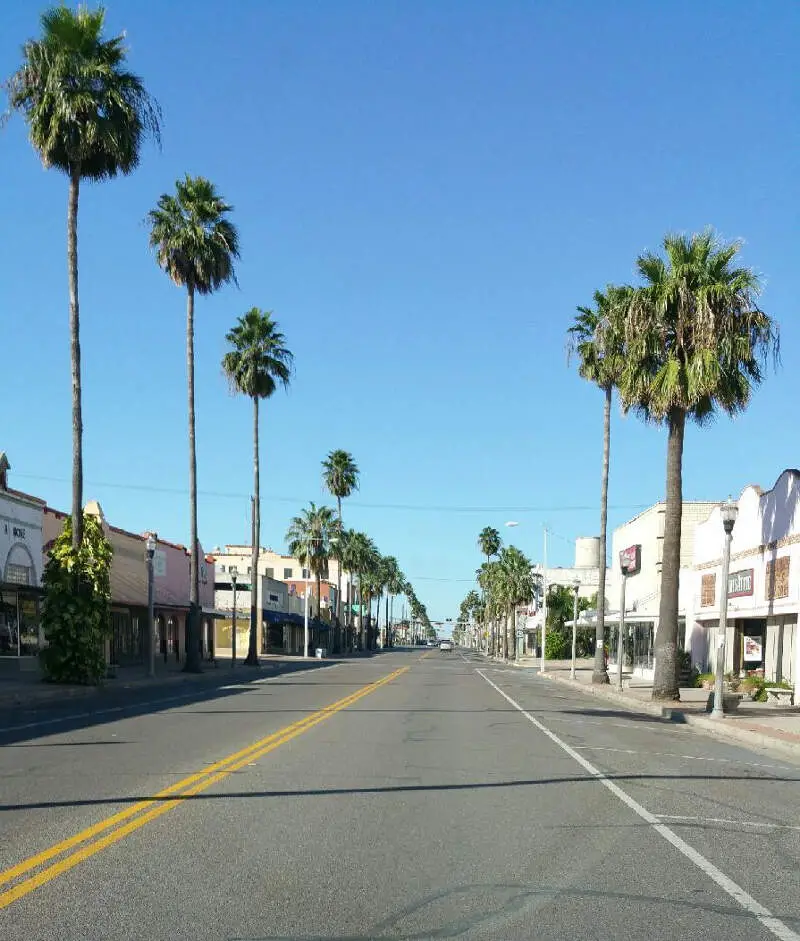
Population: 248,855
Average Annual High: 85.3 degrees
Average Annual Low: 62.7 degrees
Average Annual Snowfall: 0.0 inches
Average Annual Precipitation: 19.5 inches
Sunny Days: 333.8 days
More on Laredo: Data

Population: 18,943
Average Annual High: 85.1 degrees
Average Annual Low: 63.9 degrees
Average Annual Snowfall: 0.0 inches
Average Annual Precipitation: 22.2 inches
Sunny Days: 333.9 days
More on Alamo: Data

Population: 35,692
Average Annual High: 85.2 degrees
Average Annual Low: 63.8 degrees
Average Annual Snowfall: 0.0 inches
Average Annual Precipitation: 21.7 inches
Sunny Days: 333.9 days
More on San Juan: Data

Population: 13,287
Average Annual High: 85.2 degrees
Average Annual Low: 64.0 degrees
Average Annual Snowfall: 0.0 inches
Average Annual Precipitation: 21.4 inches
Sunny Days: 331.2 days
More on Hidalgo: Data


Population: 10,041
Average Annual High: 86.5 degrees
Average Annual Low: 63.0 degrees
Average Annual Snowfall: 0.0 inches
Average Annual Precipitation: 19.9 inches
Sunny Days: 331.2 days
More on Roma: Data

Population: 38,666
Average Annual High: 84.8 degrees
Average Annual Low: 64.2 degrees
Average Annual Snowfall: 0.0 inches
Average Annual Precipitation: 23.4 inches
Sunny Days: 326.6 days
More on Weslaco: Data

Population: 181,487
Average Annual High: 83.6 degrees
Average Annual Low: 64.8 degrees
Average Annual Snowfall: 0.0 inches
Average Annual Precipitation: 27.0 inches
Sunny Days: 326.1 days
More on Brownsville: Data

Population: 16,425
Average Annual High: 84.8 degrees
Average Annual Low: 64.1 degrees
Average Annual Snowfall: 0.0 inches
Average Annual Precipitation: 23.5 inches
Sunny Days: 326.6 days
More on Mercedes: Data


Population: 16,292
Average Annual High: 84.9 degrees
Average Annual Low: 64.0 degrees
Average Annual Snowfall: 0.0 inches
Average Annual Precipitation: 23.0 inches
Sunny Days: 326.6 days
More on Donna: Data
How We Determined The Cities In Texas With The Best Weather
To rank the most fair weather cities in Texas, we used Saturday Night Science and the National Oceanic and Atmospheric Administration (NOAA) database, to see which cities in the Lone Star State get the best weather.
We used the following criteria to find the best weather:
- Number of sunny days
- Highest average low
- Average high deviation from 70 degrees
- Least amount of rain
- Least amount of snow
We ranked each city of over 10,000 people in Texas from best to worst on each criterion. We then averaged each ranking into a weather quality index. The city with the best index, Pharr, was anointed the city with the best weather in Texas.
Before we get too far, here are the annual precipitation rates for major cities:
- Houston — 51.1 inches
- San Antonio — 31.8 inches
- Dallas — 38.5 inches
The cities with the best weather in Texas are Pharr, Laredo, Alamo, San Juan, Hidalgo, Roma, Weslaco, Brownsville, Mercedes, and Donna.
There’s a complete chart at the bottom.
If you’re curious, here are the places with the worst weather in Texas:
- Texarkana
- Henderson
- Longview
For more Texas reading, check out:
Detailed List Of Places With The Best Weather In Texas
| Rank | City | Population | Sunny Days | Avg. High | Precipitation (Inches) | Snow (Inches) |
|---|---|---|---|---|---|---|
| 1 | Pharr | 74,273 | 333.9 | 85.2 | 21.3 | 0.0 |
| 2 | Laredo | 248,855 | 333.8 | 85.3 | 19.5 | 0.0 |
| 3 | Alamo | 18,943 | 333.9 | 85.1 | 22.2 | 0.0 |
| 4 | San Juan | 35,692 | 333.9 | 85.2 | 21.7 | 0.0 |
| 5 | Hidalgo | 13,287 | 331.2 | 85.2 | 21.4 | 0.0 |
| 6 | Roma | 10,041 | 331.2 | 86.5 | 19.9 | 0.0 |
| 7 | Weslaco | 38,666 | 326.6 | 84.8 | 23.4 | 0.0 |
| 8 | Brownsville | 181,487 | 326.1 | 83.6 | 27.0 | 0.0 |
| 9 | Mercedes | 16,425 | 326.6 | 84.8 | 23.5 | 0.0 |
| 10 | Donna | 16,292 | 326.6 | 84.9 | 23.0 | 0.0 |
| 11 | Edinburg | 80,924 | 333.9 | 85.2 | 21.9 | 0.1 |
| 12 | Mcallen | 136,993 | 333.0 | 85.3 | 21.1 | 0.1 |
| 13 | Kingsville | 26,285 | 323.6 | 83.3 | 28.8 | 0.0 |
| 14 | Rio Grande City | 14,154 | 331.2 | 86.3 | 19.5 | 0.1 |
| 15 | Alton | 15,092 | 333.1 | 85.7 | 20.7 | 0.1 |
| 16 | La Homa | 13,406 | 331.2 | 85.3 | 21.8 | 0.1 |
| 17 | Mission | 81,573 | 330.1 | 85.7 | 20.6 | 0.1 |
| 18 | San Benito | 24,486 | 324.2 | 84.1 | 25.7 | 0.1 |
| 19 | Harlingen | 65,801 | 324.2 | 84.3 | 25.5 | 0.1 |
| 20 | Corpus Christi | 316,513 | 323.0 | 80.3 | 31.4 | 0.1 |
| 21 | Raymondville | 11,191 | 325.6 | 84.9 | 25.4 | 0.1 |
| 22 | Beeville | 13,192 | 318.7 | 82.0 | 30.7 | 0.0 |
| 23 | Portland | 15,638 | 324.5 | 79.8 | 32.7 | 0.2 |
| 24 | Uvalde | 16,220 | 324.4 | 81.9 | 24.6 | 0.0 |
| 25 | Galveston | 48,971 | 308.4 | 76.3 | 45.7 | 0.0 |
| 26 | Alice | 19,425 | 319.0 | 83.6 | 25.6 | 0.1 |
| 27 | Robstown | 11,616 | 321.2 | 82.1 | 30.3 | 0.2 |
| 28 | Copperas Cove | 33,005 | 317.5 | 77.3 | 32.9 | 0.2 |
| 29 | Seguin | 27,095 | 319.2 | 80.3 | 33.5 | 0.0 |
| 30 | Eagle Pass | 27,956 | 332.3 | 83.2 | 19.9 | 0.6 |
| 31 | San Marcos | 54,712 | 314.8 | 79.8 | 33.9 | 0.0 |
| 32 | Del Rio | 36,119 | 335.5 | 81.4 | 19.9 | 0.8 |
| 33 | Fort Hood | 30,739 | 314.2 | 77.7 | 33.6 | 0.3 |
| 34 | Killeen | 136,378 | 314.2 | 77.9 | 33.9 | 0.2 |
| 35 | Dumas | 14,997 | 330.9 | 70.4 | 16.8 | 12.9 |
| 36 | Harker Heights | 28,199 | 314.2 | 78.0 | 34.2 | 0.2 |
| 37 | Lubbock | 240,719 | 329.7 | 74.0 | 19.7 | 7.4 |
| 38 | Plainview | 21,666 | 327.2 | 72.2 | 19.7 | 10.8 |
| 39 | Canyon | 14,248 | 329.7 | 72.1 | 19.9 | 10.8 |
| 40 | Levelland | 13,823 | 328.3 | 74.0 | 19.8 | 7.6 |
| 41 | Hutto | 20,052 | 314.7 | 79.0 | 35.1 | 0.1 |
| 42 | Snyder | 11,484 | 327.6 | 75.8 | 21.9 | 1.5 |
| 43 | Round Rock | 109,690 | 314.7 | 79.1 | 35.1 | 0.1 |
| 44 | Taylor | 16,276 | 313.5 | 78.9 | 35.0 | 0.1 |
| 45 | Live Oak | 14,649 | 318.9 | 80.1 | 31.7 | 0.4 |
| 46 | Leon Valley | 10,846 | 318.9 | 80.1 | 31.7 | 0.4 |
| 47 | Lockhart | 13,091 | 311.9 | 79.9 | 34.4 | 0.0 |
| 48 | Amarillo | 196,571 | 326.9 | 70.9 | 20.3 | 15.4 |
| 49 | Vernon | 10,887 | 323.6 | 75.4 | 27.6 | 1.3 |
| 50 | San Antonio | 1,413,881 | 318.6 | 80.1 | 31.8 | 0.4 |
| 51 | Hereford | 15,257 | 327.0 | 71.4 | 20.0 | 15.9 |
| 52 | Wells Branch | 12,014 | 314.7 | 78.8 | 34.3 | 0.2 |
| 53 | Brushy Creek | 21,254 | 313.2 | 78.6 | 34.8 | 0.2 |
| 54 | Pflugerville | 53,847 | 314.7 | 79.0 | 34.3 | 0.2 |
| 55 | Midlothian | 20,679 | 311.4 | 76.0 | 37.8 | 0.1 |
| 56 | Temple | 69,938 | 313.9 | 77.7 | 36.2 | 0.3 |
| 57 | Cedar Park | 60,841 | 314.3 | 78.7 | 33.4 | 0.3 |
| 58 | Timberwood Park | 26,219 | 319.0 | 78.9 | 34.1 | 0.4 |
| 59 | Universal City | 19,466 | 317.1 | 79.4 | 32.3 | 0.5 |
| 60 | Gatesville | 15,826 | 313.6 | 77.6 | 33.7 | 0.3 |
| 61 | Borger | 13,041 | 324.1 | 71.7 | 21.4 | 19.3 |
| 62 | Converse | 20,450 | 317.1 | 79.9 | 32.0 | 0.5 |
| 63 | Schertz | 36,535 | 317.1 | 79.5 | 32.3 | 0.5 |
| 64 | Denton | 125,734 | 313.9 | 75.9 | 38.4 | 0.2 |
| 65 | Cibolo | 23,977 | 317.0 | 79.4 | 32.7 | 0.5 |
| 66 | Flower Mound | 68,654 | 312.0 | 76.2 | 37.9 | 0.2 |
| 67 | Odessa | 111,330 | 339.6 | 77.6 | 13.8 | 1.5 |
| 68 | Fredericksburg | 10,826 | 318.0 | 77.1 | 30.9 | 0.5 |
| 69 | Kyle | 32,078 | 314.8 | 79.6 | 34.6 | 0.2 |
| 70 | West Odessa | 23,742 | 339.6 | 77.5 | 13.8 | 1.7 |
| 71 | Boerne | 12,272 | 312.4 | 77.9 | 36.8 | 0.0 |
| 72 | Big Spring | 28,054 | 333.6 | 76.7 | 19.6 | 1.8 |
| 73 | Benbrook | 22,144 | 312.5 | 76.7 | 35.3 | 0.3 |
| 74 | Pampa | 18,216 | 322.2 | 70.0 | 22.4 | 17.3 |
| 75 | Lewisville | 101,151 | 312.6 | 76.4 | 37.9 | 0.4 |
| 76 | Buda | 10,655 | 317.1 | 79.4 | 35.1 | 0.3 |
| 77 | Canyon Lake | 22,759 | 314.8 | 78.9 | 34.7 | 0.4 |
| 78 | New Braunfels | 64,076 | 317.0 | 79.8 | 34.7 | 0.3 |
| 79 | Sweetwater | 10,794 | 330.1 | 76.3 | 22.6 | 3.3 |
| 80 | Mineral Wells | 16,159 | 316.8 | 77.2 | 32.8 | 0.4 |
| 81 | Austin | 887,061 | 314.9 | 79.3 | 33.8 | 0.5 |
| 82 | Burleson | 40,652 | 313.0 | 76.6 | 36.7 | 0.5 |
| 83 | Burkburnett | 10,960 | 320.5 | 75.5 | 30.3 | 2.6 |
| 84 | Lakeway | 13,212 | 313.2 | 79.3 | 30.9 | 0.5 |
| 85 | Port Lavaca | 12,315 | 309.6 | 79.7 | 43.4 | 0.0 |
| 86 | Victoria | 65,303 | 311.2 | 80.8 | 39.7 | 0.0 |
| 87 | Leander | 32,051 | 310.9 | 78.2 | 33.6 | 0.2 |
| 88 | Wichita Falls | 104,926 | 320.5 | 75.8 | 29.8 | 3.2 |
| 89 | Bedford | 48,559 | 312.6 | 76.4 | 37.5 | 0.9 |
| 90 | Crowley | 14,174 | 313.0 | 76.5 | 36.3 | 0.5 |
| 91 | Midland | 123,820 | 340.0 | 77.7 | 14.4 | 2.7 |
| 92 | Andrews | 12,696 | 336.7 | 77.6 | 14.4 | 2.7 |
| 93 | Grapevine | 49,609 | 311.4 | 76.3 | 37.5 | 0.6 |
| 94 | Euless | 53,220 | 312.4 | 76.5 | 37.4 | 1.0 |
| 95 | Belton | 19,766 | 310.5 | 77.8 | 35.7 | 0.1 |
| 96 | Weatherford | 27,234 | 313.8 | 75.9 | 35.1 | 0.7 |
| 97 | Stephenville | 19,074 | 316.5 | 76.1 | 32.3 | 1.4 |
| 98 | Robinson | 11,214 | 311.9 | 77.6 | 35.9 | 0.5 |
| 99 | Colleyville | 24,453 | 311.4 | 76.3 | 37.5 | 0.6 |
| 100 | Georgetown | 56,102 | 310.9 | 78.6 | 35.6 | 0.2 |