Los Angelesvs.Denver Which City Is Right for You in 2026?
A head-to-head guide to cost of living, jobs, transportation, weather, crime, and quality of life — so you can decide where to live, work, or visit.
Updated 2026-05-26 · By HomeSnacks Editorial
Los Angeles vs. Denver at a glance
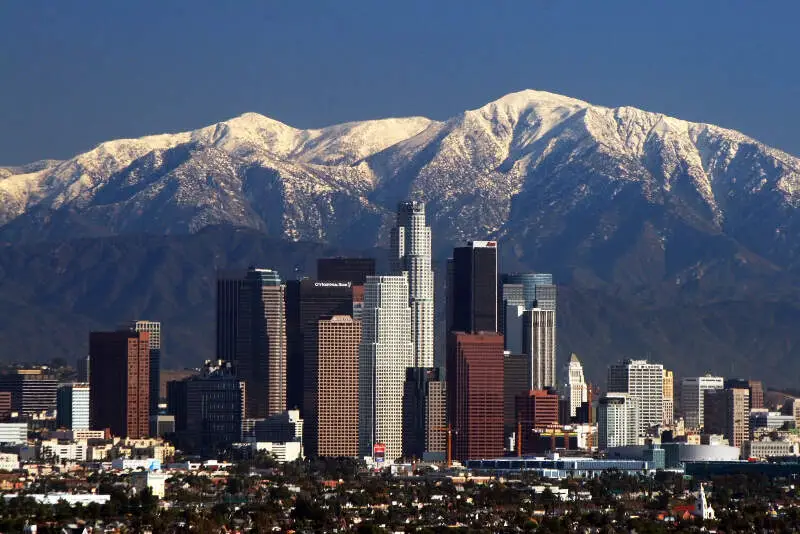
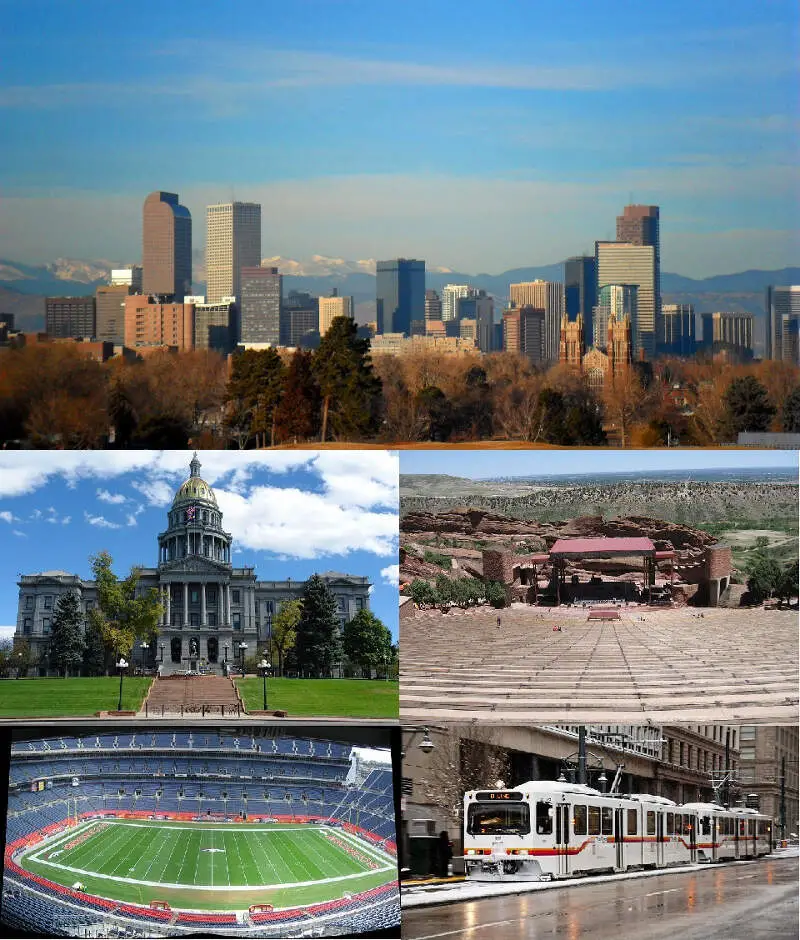
Choosing between Los Angeles, CA and Denver, CO comes down to which trade-offs you're willing to make. Los Angeles (LA) is the most populous city in the U.S. state of California, and the commercial, financial, and cultural center of Southern California. Denver is the capital and most populous city of the U.S. state of Colorado.
On cost of living, Denver is the cheaper city: its overall index sits at 142 versus 179 in Los Angeles (100 = national average). Median home values run $952,183 in Los Angeles and $539,666 in Denver, with median rents at $1,933 and $1,831 respectively. That puts the home-value-to-income ratio at 11.6x in Los Angeles versus 5.7x in Denver.
Crime data tells a different story. Los Angeles reports 2,212 total crimes per 100,000 residents annually versus 5,755 in Denver. Los Angeles is the more racially diverse of the two on a Herfindahl index basis — Los Angeles skews 47% Hispanic while Denver skews 54% White. On HomeSnacks' overall SnackAbility score, Denver edges ahead at 8/10 versus 6/10 for Los Angeles.
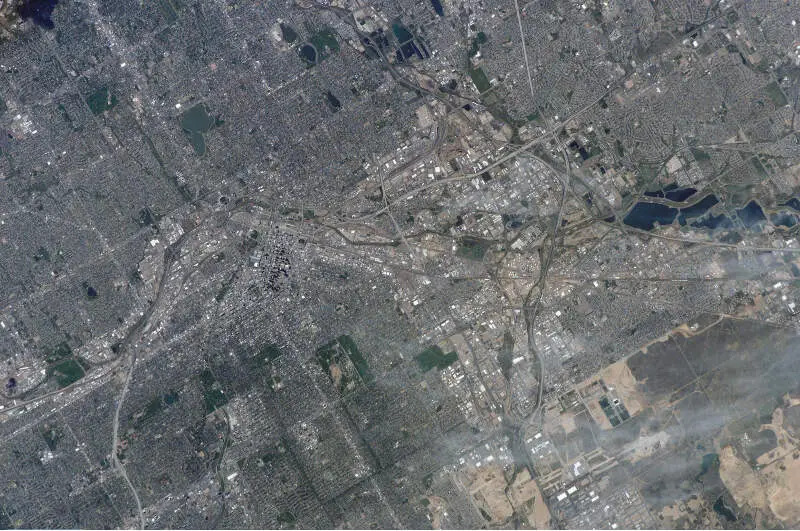
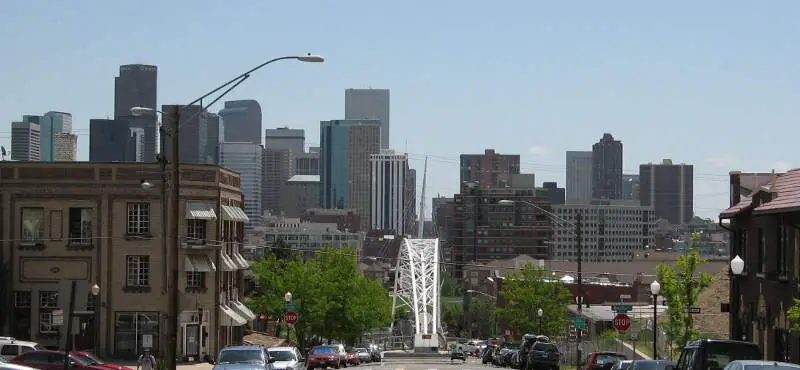
Los Angeles vs. Denver in photos
A side-by-side look at each city.


Cost of living
Denver is the cheaper city overall — 26% higher in Los Angeles than its rival. Index baseline: 100 = national average.
| Living expense | Los Angeles | Denver | US average |
|---|---|---|---|
| Overall | 179 | 142 | 100 |
| Services | 117 | 108 | 100 |
| Groceries | 123 | 107 | 100 |
| Health | 309 | 214 | 100 |
| Housing | 128 | 113 | 100 |
| Transportation | 128 | 110 | 100 |
| Utilities | 134 | 111 | 100 |
Lower index = cheaper. 100 = U.S. national average. Bar inside each cell scales relative to the highest value in the table.
Sources: HomeSnacks Cost of Living indices, normalized so 100 = U.S. national average. Drill in: Los Angeles cost of living, Denver cost of living, or the cheapest cities in America.
Housing breakdown
Home prices are higher in Los Angeles. Compare absolute price and price-to-income — a $500k home in a $100k-income city is very different from one in a $50k-income city.
| Metric | Los Angeles | Denver | United States |
|---|---|---|---|
| Median Home Value | $952,183 | $539,666 | $332,700 |
| Median Rent | $1,933 | $1,831 | $1,413 |
| Median Income | $81,939 | $94,718 | $80,734 |
| Home Value To Income | 11.6x | 5.7x | 4.1x |
| Rent To Monthly Income | 0.28x | 0.23x | 0.21x |
Source: U.S. Census Bureau ACS 2020-2024. See also states with the highest rent in America.
Crime
Los Angeles is the safer city — total crime rate of 2,212 per 100k people vs 5,755 for Denver. US average: 2,119.
| Crime (per 100k) | Los Angeles | Denver | US average |
|---|---|---|---|
| Total crime | 2,212 | 5,755 | 2,119 |
| Murder | 7 | 10 | 5 |
| Robbery | 210 | 176 | 61 |
| Aggravated Assault | 471 | 713 | 256 |
| Violent Crime | 728 | 993 | 359 |
| Burglary | 373 | 708 | 229 |
| Larceny | 852 | 2,822 | 1,272 |
| Car Theft | 260 | 1,232 | 259 |
| Property Crime | 1,484 | 4,762 | 1,760 |
Lower = safer. Bar inside each cell scales relative to the highest crime rate in the table.
Source: FBI Uniform Crime Reporting (2024). All rates are per 100,000 people. City pages: Los Angeles crime, Denver crime. See also: safest cities in America.
Diversity
Los Angeles is more racially diverse — lower HHI (closer to 0) means a more even mix across groups.
| Group | Los Angeles | Denver | United States |
|---|---|---|---|
| White | 28.1% | 54.0% | 57.4% |
| African American | 8.1% | 8.6% | 11.9% |
| American Indian | 0.1% | 0.3% | 0.5% |
| Asian | 11.9% | 3.6% | 5.9% |
| Hawaiian | 0.1% | 0.1% | 0.2% |
| Other | 0.7% | 0.5% | 0.6% |
| Two Or More | 3.8% | 4.8% | 4.3% |
| Hispanic | 47.2% | 28.0% | 19.3% |
Source: U.S. Census ACS 2020-2024. Lower HHI = more even racial mix. See also: most diverse cities in America.
SnackAbility — overall quality of life
Denver scores higher overall — 8/10 vs 6/10. SnackAbility is our 1–10 quality-of-life score; the median U.S. city scores a 7.
SnackAbility is a HomeSnacks proprietary 1–10 score blending jobs, housing, education, commute, amenities, affordability, crime, and diversity. Median U.S. city ≈ 7. Data: Census, BLS, FBI. See also: best places to live in America.
Getting around: Los Angeles vs. Denver
How each city handles commuting, transit, walkability, and car culture — the day-to-day reality that shapes where you'd actually want to live.
Getting around Los Angeles almost always means a car. The Metro Rail network (Red, Purple, Blue, and Expo lines) has expanded, and the K Line now reaches Inglewood, but service gaps mean most commuters still sit on the 405 or the 101. Peak-hour congestion adds 20–40 minutes to any surface-street trip, and parking in neighborhoods like Silver Lake or downtown runs $200–$400 a month.
Denver's Regional Transportation District (RTD) runs light-rail and commuter-rail lines that reach the airport, suburban Park-n-Rides, and Union Station downtown. The 16th Street Mall Free MallRide connects LoDo to Civic Center at no cost.
Car commuters deal with congestion on I-25 and I-70, but it rarely approaches LA-level gridlock. Denver is also increasingly bikeable, with protected lanes along Cherry Creek Trail and Broadway.
Jobs and careers in Los Angeles vs. Denver
The local job market, dominant industries, and which city to choose based on your career.
Los Angeles runs on entertainment (Disney, Warner Bros., Netflix in Burbank and Culver City), aerospace (SpaceX, Northrop Grumman in the South Bay), and a Silicon Beach tech corridor stretching from Playa Vista to Santa Monica. Healthcare systems like Cedars-Sinai and UCLA Health are major employers too. Median household income sits at $81,939, but a cost-of-living index of 179 means that number stretches less far than it looks.
Denver's economy mixes energy companies (Chevron, Xcel Energy), federal agencies, and a growing tech scene around the RiNo district and Denver Tech Center. Median household income reaches $94,718, and with a cost-of-living index of 142, that dollar goes further than in LA. Aerospace (Lockheed Martin, Raytheon in nearby Aurora) and outdoor brands like REI and VF Corporation round out the job market.
Weather and climate
What to expect day-to-day — sun, fog, heat, rain, and the seasonal extremes that shape the lifestyle.
Los Angeles delivers the Mediterranean climate its reputation promises: highs in the 70s most of the year, virtually no humidity, and roughly 280 sunny days annually. Winters are mild, and a light jacket handles most December days. Summers along the coast stay tempered by the marine layer, though the Inland Empire and San Fernando Valley bake, and fall brings wildfire smoke and Santa Ana winds.
Denver earns the "300 days of sunshine" claim honestly, but those sunny days can include genuine snowstorms, particularly from November through March. Summers are warm and dry, with afternoon thunderstorms rolling in over the Rockies most days in July and August. At 5,280 feet, the thinner air and intense UV mean sunscreen matters year-round.
Culture, nightlife, and entertainment
Food, music, neighborhoods, and the city vibe that gives each place its personality.
Los Angeles is one of the world's cultural capitals. World-class museums (LACMA, the Getty, the Broad) sit alongside Michelin-starred dining in Beverly Hills, authentic regional Mexican food in Boyle Heights, and Korean BBQ in Koreatown. Nightlife stretches from Hollywood clubs on Sunset Boulevard to jazz bars in Leimert Park, and the venue lineup (Forum, Kia Forum, the Greek Theatre, the Hollywood Bowl) is hard to match anywhere.
Denver offers more than you'd expect from a city of 718,000. The RiNo Arts District has galleries, brewpubs, and nationally recognized restaurants, and LoDo around Coors Field and Ball Arena draws crowds on game nights. Denver also has a strong craft-beer identity, with Great Divide, Odell, and Breckenridge all running taprooms here.
Red Rocks Amphitheatre, 15 miles west, may be the country's finest outdoor concert venue.
Outdoor activities and day trips
Parks, beaches, hikes, and the weekend escapes that define life outside the city limits.
Los Angeles puts coastline, mountains, and desert within a two-hour radius. You can surf in Malibu in the morning, hike Griffith Park or the Santa Monica Mountains in the afternoon, and reach Joshua Tree or Big Bear by early evening. Runyon Canyon and the Backbone Trail give hikers access from the urban core, and Venice, Manhattan Beach, and Zuma each draw cyclists, swimmers, and volleyball players.
Rocky Mountain National Park is 90 minutes from Denver, and ski resorts (Breckenridge, Vail, Keystone, Arapahoe Basin) sit within two hours on I-70. City Park, Washington Park, and 185 miles of urban trails along Cherry Creek and the Platte River keep outdoor options close on weekday evenings. If skiing, hiking, and climbing are priorities, Denver's location is hard to match.
Bottom line: which city is right for you?
Based on the head-to-head data above, here's the short version — pick the city that lines up with what you actually care about.
Choose Los Angeles if you prioritize…
- lower crime — a safer place to live, work, and raise a family.
- more affordable housing relative to Denver.
- a more racially diverse community (lower HHI on Census data).
Choose Denver if you prioritize…
- a lower cost of living (cheaper groceries, services, and day-to-day expenses).
- a higher overall SnackAbility quality-of-life score.
Methodology: winners are picked from public data — U.S. Census Bureau ACS (income, home value, rent, race/HHI), FBI Uniform Crime Reporting (crime rates per 100k), and HomeSnacks' proprietary SnackAbility quality-of-life score, which blends Bureau of Labor Statistics data with the above.
More about California & Colorado

Best Places To Live In California
Photo: Public domain
Cheapest Places To Live In California
Photo: Public domain
Most Dangerous Cities In California
Photo: Public domain
Best Places To Raise A Family In California
Photo: Public domain
Best Places To Retire In California
Photo: Public domain
Richest Cities In California
Photo: Public domain
Safest Places In California
Photo: Public domain
Worst Places To Live In California
Photo: Public domain