San Antoniovs.Austin Which City Is Right for You in 2026?
A head-to-head guide to cost of living, jobs, transportation, weather, crime, and quality of life — so you can decide where to live, work, or visit.
Updated 2026-05-26 · By HomeSnacks Editorial
San Antonio vs. Austin at a glance
San Antonio, TX and Austin, TX sit at very different points on the U.S. map — and the numbers reflect it. San Antonio is a city in the U.S. state of Texas. Austin is the capital city of the U.S. state of Texas. With a population of 961,855 at the 2020 census, it is the 12th-most populous city in the U.S., fifth-most populous city in Texas, and second-most populous U.S.
On cost of living, San Antonio is the cheaper city: its overall index sits at 98 versus 124 in Austin (100 = national average). Median home values run $249,809 in San Antonio and $508,530 in Austin, with median rents at $1,324 and $1,729 respectively. That puts the home-value-to-income ratio at 3.8x in San Antonio versus 5.4x in Austin.
FBI crime data adds another wrinkle. Austin reports 3,709 total crimes per 100,000 residents annually versus 5,218 in San Antonio. Austin is the more racially diverse of the two on a Herfindahl index basis — San Antonio skews 65% Hispanic while Austin skews 47% White. On HomeSnacks' overall SnackAbility score, Austin edges ahead at 7/10 versus 4/10 for San Antonio.
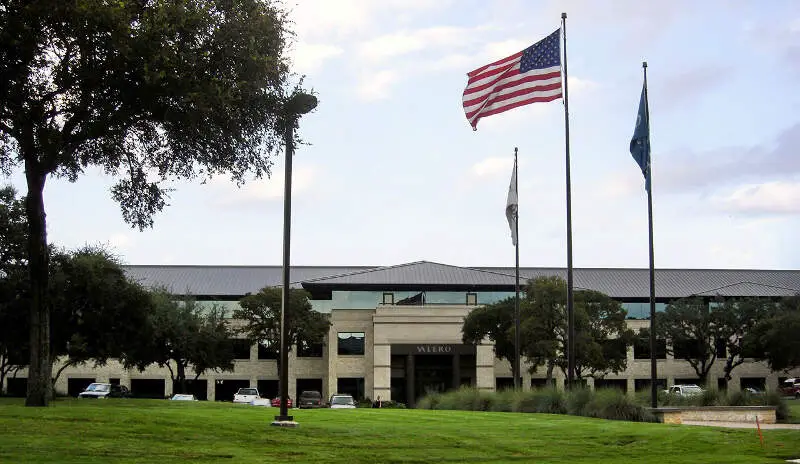
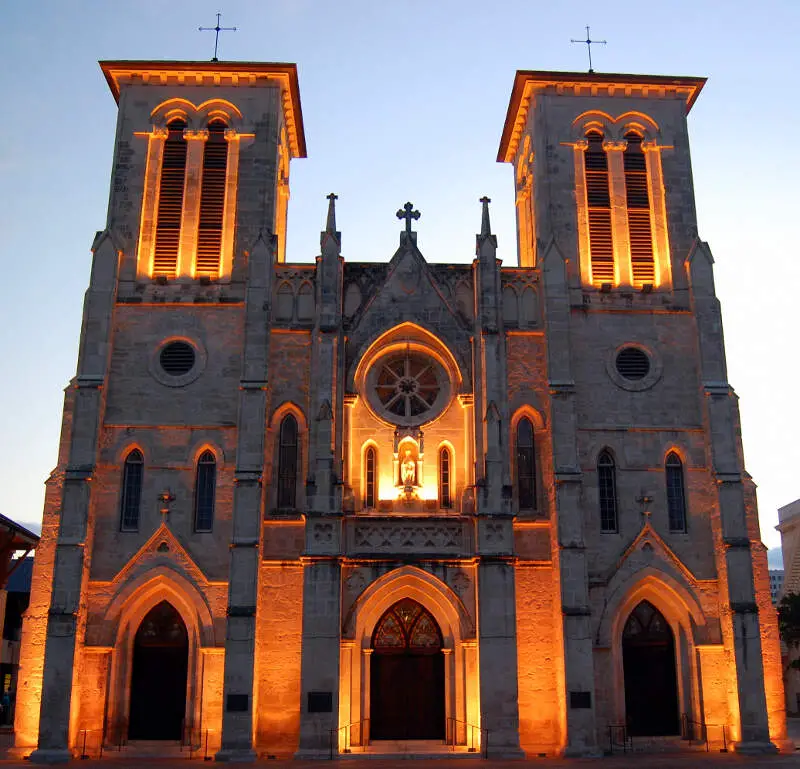
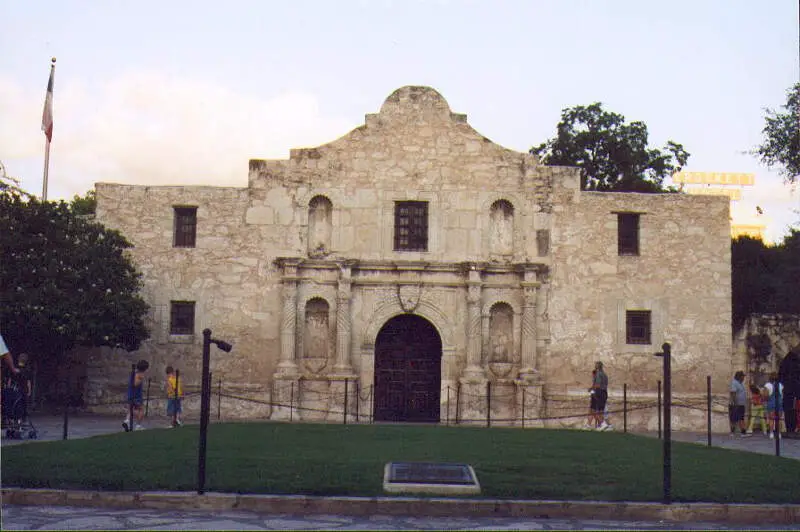
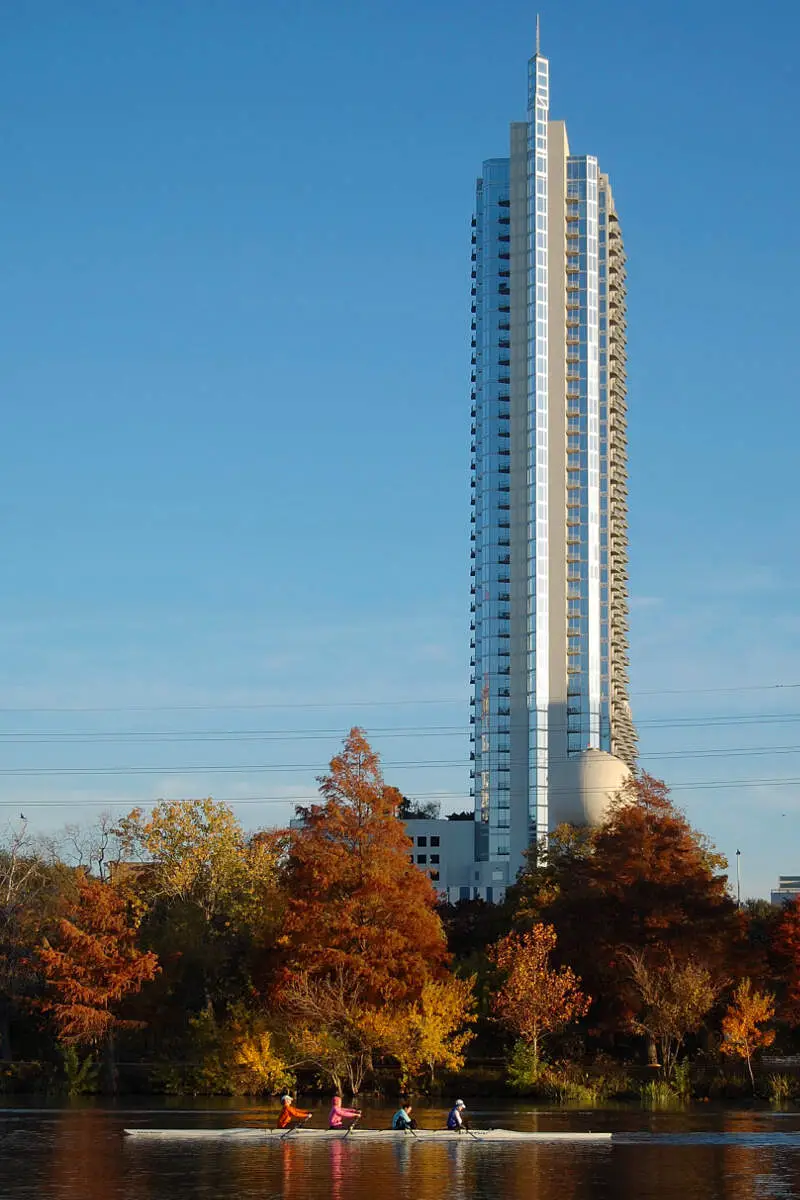
San Antonio vs. Austin in photos
A side-by-side look at each city.


Cost of living
San Antonio is the cheaper city overall — 21% higher in Austin than its rival. Index baseline: 100 = national average.
| Living expense | San Antonio | Austin | US average |
|---|---|---|---|
| Overall | 98 | 124 | 100 |
| Services | 103 | 99 | 100 |
| Groceries | 101 | 101 | 100 |
| Health | 91 | 185 | 100 |
| Housing | 106 | 98 | 100 |
| Transportation | 103 | 109 | 100 |
| Utilities | 101 | 104 | 100 |
Lower index = cheaper. 100 = U.S. national average. Bar inside each cell scales relative to the highest value in the table.
Sources: HomeSnacks Cost of Living indices, normalized so 100 = U.S. national average. Drill in: San Antonio cost of living, Austin cost of living, or the cheapest cities in America.
Housing breakdown
Home prices are higher in Austin. Compare absolute price and price-to-income — a $500k home in a $100k-income city is very different from one in a $50k-income city.
| Metric | San Antonio | Austin | United States |
|---|---|---|---|
| Median Home Value | $249,809 | $508,530 | $332,700 |
| Median Rent | $1,324 | $1,729 | $1,413 |
| Median Income | $65,056 | $93,658 | $80,734 |
| Home Value To Income | 3.8x | 5.4x | 4.1x |
| Rent To Monthly Income | 0.24x | 0.22x | 0.21x |
Source: U.S. Census Bureau ACS 2020-2024. See also states with the highest rent in America.
Crime
Austin is the safer city — total crime rate of 3,709 per 100k people vs 5,218 for San Antonio. US average: 2,119.
| Crime (per 100k) | San Antonio | Austin | US average |
|---|---|---|---|
| Total crime | 5,218 | 3,709 | 2,119 |
| Murder | 8 | 7 | 5 |
| Robbery | 108 | 85 | 61 |
| Aggravated Assault | 394 | 307 | 256 |
| Violent Crime | 594 | 467 | 359 |
| Burglary | 496 | 445 | 229 |
| Larceny | 3,292 | 2,198 | 1,272 |
| Car Theft | 836 | 599 | 259 |
| Property Crime | 4,624 | 3,242 | 1,760 |
Lower = safer. Bar inside each cell scales relative to the highest crime rate in the table.
Source: FBI Uniform Crime Reporting (2024). All rates are per 100,000 people. City pages: San Antonio crime, Austin crime. See also: safest cities in America.
Diversity
Austin is more racially diverse — lower HHI (closer to 0) means a more even mix across groups.
| Group | San Antonio | Austin | United States |
|---|---|---|---|
| White | 23.0% | 47.0% | 57.4% |
| African American | 6.4% | 7.3% | 11.9% |
| American Indian | 0.1% | 0.1% | 0.5% |
| Asian | 2.9% | 9.0% | 5.9% |
| Hawaiian | 0.1% | 0.0% | 0.2% |
| Other | 0.5% | 0.5% | 0.6% |
| Two Or More | 2.4% | 4.3% | 4.3% |
| Hispanic | 64.6% | 31.9% | 19.3% |
Source: U.S. Census ACS 2020-2024. Lower HHI = more even racial mix. See also: most diverse cities in America.
SnackAbility — overall quality of life
Austin scores higher overall — 7/10 vs 4/10. SnackAbility is our 1–10 quality-of-life score; the median U.S. city scores a 7.
SnackAbility is a HomeSnacks proprietary 1–10 score blending jobs, housing, education, commute, amenities, affordability, crime, and diversity. Median U.S. city ≈ 7. Data: Census, BLS, FBI. See also: best places to live in America.
Getting around: San Antonio vs. Austin
How each city handles commuting, transit, walkability, and car culture — the day-to-day reality that shapes where you'd actually want to live.
Both San Antonio and Austin are car-first cities, so if you're coming from a walkable metro, recalibrate your expectations. San Antonio's VIA Metropolitan Transit runs an extensive bus network, but coverage gets thin past Loop 1604. Austin's Capital Metro has the MetroRail Red Line connecting northern suburbs to downtown, plus a growing bus rapid transit network along Guadalupe and Lamar, but neither system replaces a car for most residents.
Where they diverge is congestion. Austin's I-35 corridor ranks among the most congested highways in Texas, and if you're commuting from Cedar Park or Pflugerville, expect genuinely brutal drives. San Antonio's I-10 and Loop 410 hit rush-hour gridlock too, but the city's larger footprint spreads traffic out, so drives tend to be shorter and more predictable.
Jobs and careers in San Antonio vs. Austin
The local job market, dominant industries, and which city to choose based on your career.
Austin has become one of the country's biggest tech hiring markets, and the income numbers reflect it: median household income sits at $93,658, well above San Antonio's $65,056. Apple, Tesla, Dell, Oracle, and Samsung all have major campuses here, and the startup scene around the Domain and East Austin keeps generating new employers. White-collar workers relocating from coastal cities have pushed salaries up and housing costs right along with them.
San Antonio's job market runs on different sectors: the military (Joint Base San Antonio is one of the largest in the country), healthcare anchored by UT Health and Methodist Healthcare System, and corporate employers like USAA, Valero Energy, and H-E-B. The lower income median reflects that less tech-heavy mix, but the cost of living index of 98 versus Austin's 124 means your paycheck goes noticeably further once you account for what you're spending.
Weather and climate
What to expect day-to-day — sun, fog, heat, rain, and the seasonal extremes that shape the lifestyle.
If you're moving from the Northeast or Pacific Northwest, both cities will hit you hard in summer. Highs routinely push into the high 90s from June through September, and the humidity makes it feel worse. San Antonio sits a little farther south and runs slightly drier, so triple-digit days are common by July.
Austin gets slightly more annual rainfall and tends to see more severe thunderstorms in spring. Winters are mild most of the time, with average January highs in the low-to-mid 60s, and if you're coming from Chicago or Denver you'll still be pleased. Just know that the February 2021 winter storm exposed both cities badly: infrastructure not built for freezing conditions can fail when rare Arctic fronts arrive.
Culture, nightlife, and entertainment
Food, music, neighborhoods, and the city vibe that gives each place its personality.
Austin bills itself as the Live Music Capital of the World, and the claim holds up. The Red River Cultural District, Sixth Street, and Rainey Street pack in bars, venues, and restaurants at a density few mid-sized cities can match, and SXSW plus Austin City Limits Music Festival bring international crowds each year. The food scene, anchored by Franklin Barbecue and spread across South Congress and East Austin, has crossed into genuinely serious territory.
San Antonio's cultural identity runs deeper historically, and the River Walk is only part of it. The Pearl District, just north of downtown, has become a strong food and arts neighborhood, and the city's Mexican-American heritage shapes everything from the cuisine on Presa Street to the citywide Fiesta celebration each April. Nightlife is lower-key than Austin, but if you want culture rooted in place rather than transplant energy, San Antonio delivers something Austin increasingly struggles to offer.
Outdoor activities and day trips
Parks, beaches, hikes, and the weekend escapes that define life outside the city limits.
Austin's outdoor options are one of its real selling points. Barton Springs Pool, a natural spring-fed swimming hole inside Zilker Park, is iconic for good reason, and the Barton Creek Greenbelt gives trail runners and hikers a surprising amount of wild terrain within city limits. Lady Bird Lake draws kayakers and paddleboarders year-round, and Hamilton Pool Preserve about 45 minutes west makes for one of the better day trips in Central Texas.
San Antonio's outdoor options are less celebrated but solid. Friedrich Wilderness Park on the northwest side is an underrated urban trail system, and Canyon Lake, about an hour north, is a popular weekend destination for swimming, boating, and camping. Natural Bridge Caverns, just outside the city, makes for a genuinely cool outing.
Both cities connect you to the broader Texas Hill Country, with Garner State Park and the Frio River accessible from San Antonio's side. Austin gets the nod for in-city outdoor access; San Antonio wins on affordability if you're factoring in where you can afford to live near the trails.
Bottom line: which city is right for you?
Based on the head-to-head data above, here's the short version — pick the city that lines up with what you actually care about.
Choose San Antonio if you prioritize…
- a lower cost of living (cheaper groceries, services, and day-to-day expenses).
Choose Austin if you prioritize…
- lower crime — a safer place to live, work, and raise a family.
- more affordable housing relative to San Antonio.
- a more racially diverse community (lower HHI on Census data).
- a higher overall SnackAbility quality-of-life score.
Methodology: winners are picked from public data — U.S. Census Bureau ACS (income, home value, rent, race/HHI), FBI Uniform Crime Reporting (crime rates per 100k), and HomeSnacks' proprietary SnackAbility quality-of-life score, which blends Bureau of Labor Statistics data with the above.
More about Texas

Best Places To Live In Texas
Photo: Public domain
Cheapest Places To Live In Texas
Photo: Public domain
Most Dangerous Places In Texas
Photo: Public domain
Best Places To Raise A Family In Texas
Photo: Public domain
Best Places To Retire In Texas
Photo: Public domain
Richest Cities In Texas
Photo: Public domain
Safest Places In Texas
Photo: Public domain
Worst Places To Live In Texas
Photo: Public domain