San Josevs.San Francisco Which City Is Right for You in 2026?
A head-to-head guide to cost of living, jobs, transportation, weather, crime, and quality of life — so you can decide where to live, work, or visit.
Updated 2026-05-26 · By HomeSnacks Editorial
San Jose vs. San Francisco at a glance
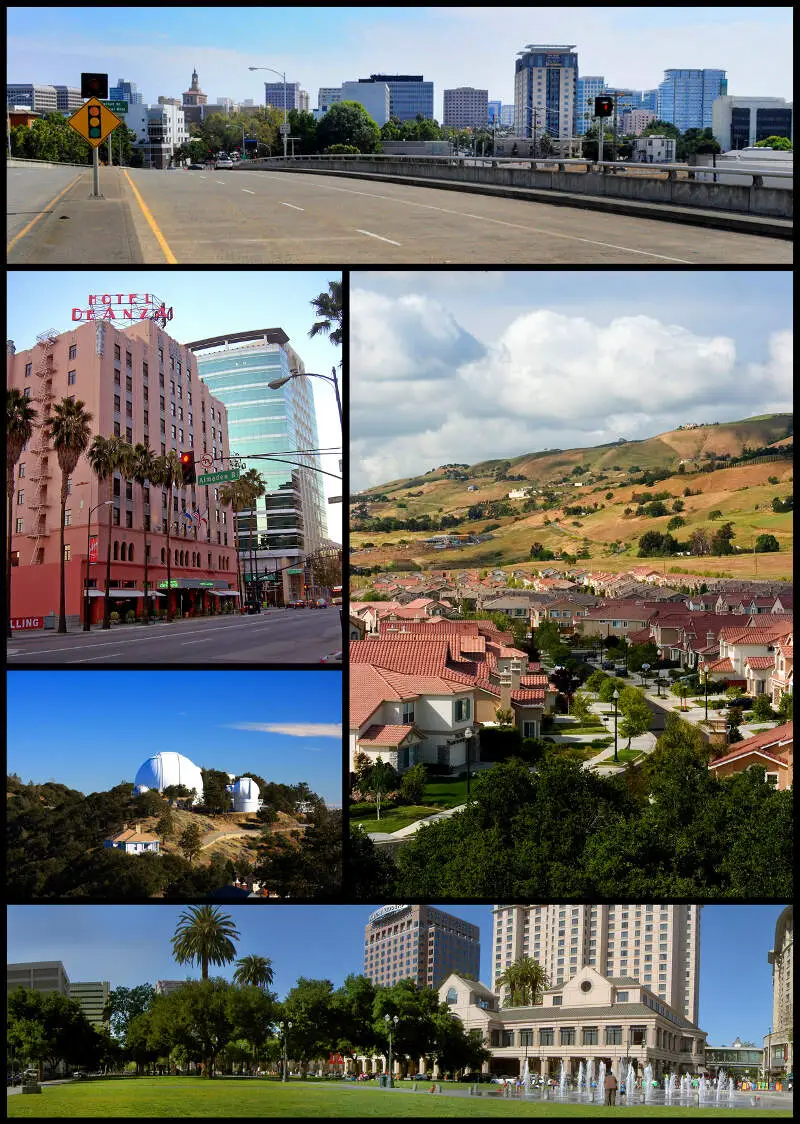
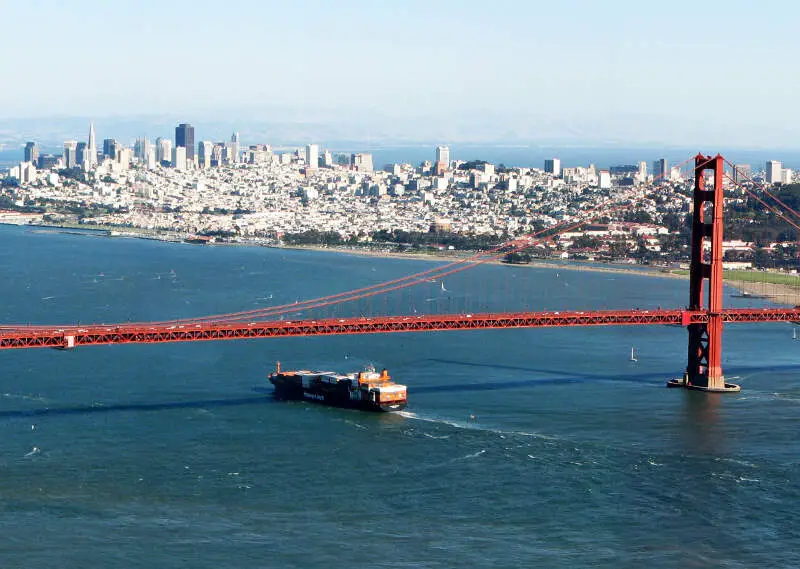
San Jose, CA and San Francisco, CA are both major U.S. cities, but they pull on very different threads. San Jose, officially the City of San José, is the most populous city in the San Francisco Bay Area and Northern California, and the 13th-most populous in the United States, with 997,368 residents. San Francisco, officially the City and County of San Francisco, is the fourth-most populous city in California and the 17th-most populous in the United States, with a population of 826,079 in 2025. Among U.S.
On cost of living, San Jose is the cheaper city: its overall index sits at 216 versus 247 in San Francisco (100 = national average). Median home values run $1,463,614 in San Jose and $1,356,661 in San Francisco, with median rents at $2,669 and $2,476 respectively. That puts the home-value-to-income ratio at 10.0x in San Jose versus 9.6x in San Francisco.
Public safety is another point of divergence. San Jose reports 3,195 total crimes per 100,000 residents annually versus 4,526 in San Francisco. San Francisco is the more racially diverse of the two on a Herfindahl index basis — San Jose skews 39% Asian while San Francisco skews 37% White. Our SnackAbility scores have the two essentially tied at 8.5/10.
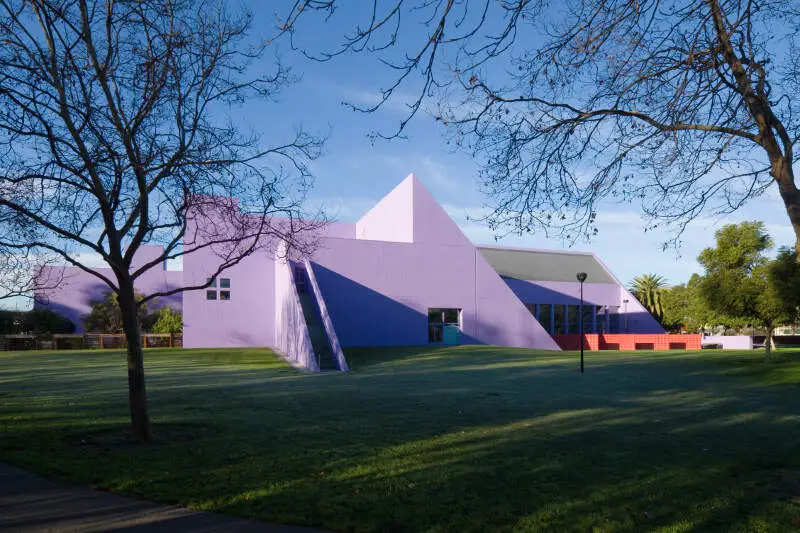
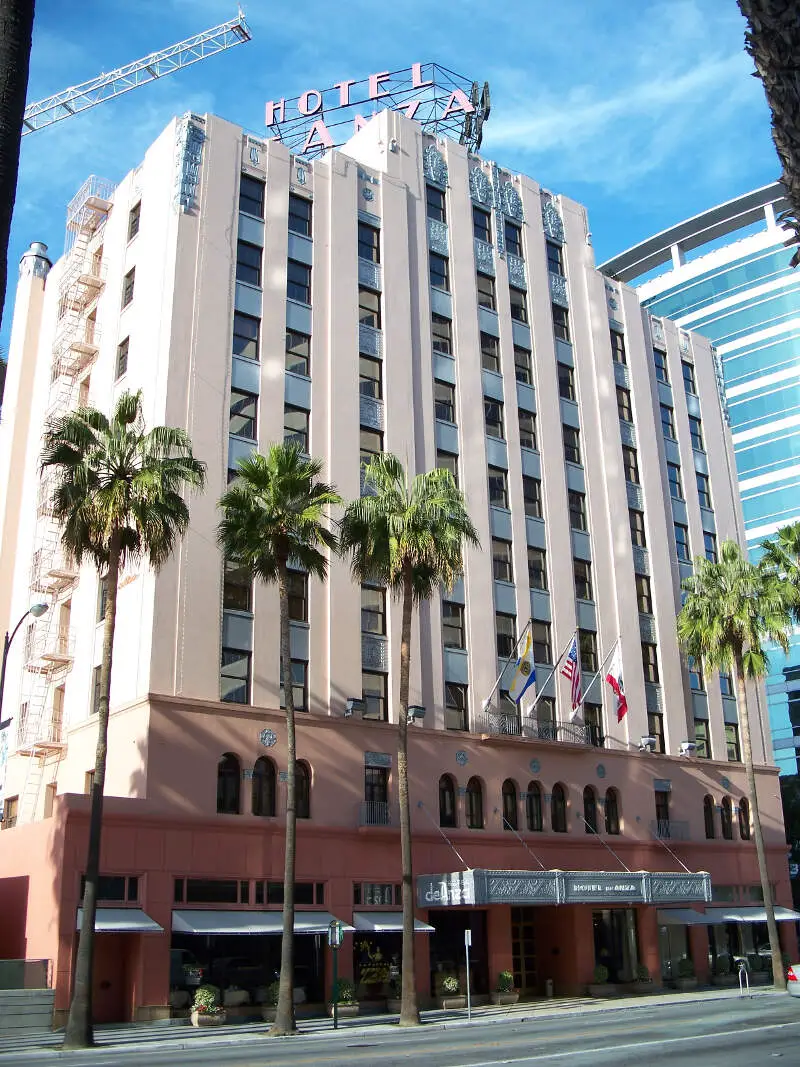
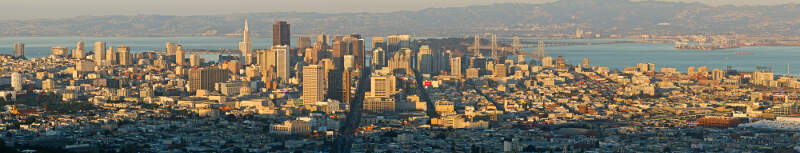
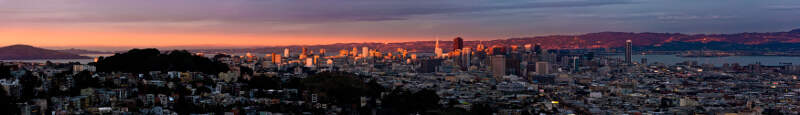
San Jose vs. San Francisco in photos
A side-by-side look at each city.
Cost of living
San Jose is the cheaper city overall — 13% higher in San Francisco than its rival. Index baseline: 100 = national average.
| Living expense | San Jose | San Francisco | US average |
|---|---|---|---|
| Overall | 216 | 247 | 100 |
| Services | 119 | 122 | 100 |
| Groceries | 125 | 125 | 100 |
| Health | 425 | 518 | 100 |
| Housing | 135 | 132 | 100 |
| Transportation | 132 | 128 | 100 |
| Utilities | 136 | 139 | 100 |
Lower index = cheaper. 100 = U.S. national average. Bar inside each cell scales relative to the highest value in the table.
Sources: HomeSnacks Cost of Living indices, normalized so 100 = U.S. national average. Drill in: San Jose cost of living, San Francisco cost of living, or the cheapest cities in America.
Housing breakdown
Home prices are higher in San Jose. Compare absolute price and price-to-income — a $500k home in a $100k-income city is very different from one in a $50k-income city.
| Metric | San Jose | San Francisco | United States |
|---|---|---|---|
| Median Home Value | $1,463,614 | $1,356,661 | $332,700 |
| Median Rent | $2,669 | $2,476 | $1,413 |
| Median Income | $146,427 | $140,970 | $80,734 |
| Home Value To Income | 10.0x | 9.6x | 4.1x |
| Rent To Monthly Income | 0.22x | 0.21x | 0.21x |
Source: U.S. Census Bureau ACS 2020-2024. See also states with the highest rent in America.
Crime
San Jose is the safer city — total crime rate of 3,195 per 100k people vs 4,526 for San Francisco. US average: 2,119.
| Crime (per 100k) | San Jose | San Francisco | US average |
|---|---|---|---|
| Total crime | 3,195 | 4,526 | 2,119 |
| Murder | 3 | 4 | 5 |
| Robbery | 141 | 267 | 61 |
| Aggravated Assault | 386 | 290 | 256 |
| Violent Crime | 607 | 596 | 359 |
| Burglary | 427 | 637 | 229 |
| Larceny | 1,523 | 2,619 | 1,272 |
| Car Theft | 638 | 673 | 259 |
| Property Crime | 2,588 | 3,929 | 1,760 |
Lower = safer. Bar inside each cell scales relative to the highest crime rate in the table.
Source: FBI Uniform Crime Reporting (2024). All rates are per 100,000 people. City pages: San Jose crime, San Francisco crime. See also: safest cities in America.
Diversity
San Francisco is more racially diverse — lower HHI (closer to 0) means a more even mix across groups.
| Group | San Jose | San Francisco | United States |
|---|---|---|---|
| White | 22.3% | 36.8% | 57.4% |
| African American | 2.7% | 4.7% | 11.9% |
| American Indian | 0.2% | 0.2% | 0.5% |
| Asian | 39.2% | 34.9% | 5.9% |
| Hawaiian | 0.5% | 0.3% | 0.2% |
| Other | 0.5% | 0.8% | 0.6% |
| Two Or More | 3.8% | 6.1% | 4.3% |
| Hispanic | 30.8% | 16.2% | 19.3% |
Source: U.S. Census ACS 2020-2024. Lower HHI = more even racial mix. See also: most diverse cities in America.
SnackAbility — overall quality of life
San Jose and San Francisco tied at 8.5/10.
SnackAbility is a HomeSnacks proprietary 1–10 score blending jobs, housing, education, commute, amenities, affordability, crime, and diversity. Median U.S. city ≈ 7. Data: Census, BLS, FBI. See also: best places to live in America.
Getting around: San Jose vs. San Francisco
How each city handles commuting, transit, walkability, and car culture — the day-to-day reality that shapes where you'd actually want to live.
San Jose is a car city. The VTA runs light rail and buses, and Caltrain reaches San Francisco in under an hour, but most residents default to driving on I-280, US-101, or SR-87. Parking is cheaper and less of an ordeal than across the bay.
BART now reaches East San Jose via the Berryessa station, though it still doesn't connect the downtown core.
San Francisco rewards car-free living. Muni's buses, light rail, and cable cars cover most neighborhoods, BART links the East Bay and SFO, and the compact grid makes walking practical in ways San Jose's sprawl never will.
If you commute into Silicon Valley from SF, expect to join the reverse-commuter line on Caltrain or sit on 101.
Jobs and careers in San Jose vs. San Francisco
The local job market, dominant industries, and which city to choose based on your career.
San Jose sits at the geographic center of Silicon Valley. Cisco, Adobe, eBay, and PayPal all have headquarters here, and the North First Street corridor is dense with enterprise tech. The median household income of $146,427 reflects a workforce built around engineering, product, and operations roles.
If you work in hardware, semiconductors, or enterprise software, San Jose's commute math is simply better.
San Francisco's $140,970 median household income is only a notch lower, but the job mix is broader. Salesforce anchors downtown, the Financial District handles significant banking and venture capital, and the biotech corridor in Mission Bay has grown substantially.
Creative industries, hospitality, and nonprofits employ far more people here than in San Jose. If you want options outside pure tech, San Francisco has more of them.
Weather and climate
What to expect day-to-day — sun, fog, heat, rain, and the seasonal extremes that shape the lifestyle.
San Jose sits inland enough to dodge most of the marine layer that defines Bay Area weather. Expect roughly 300 sunny days a year, summer afternoons often reaching the mid-80s, and cool but rarely cold winters where frost is more a rumor than a regular event. The Santa Clara Valley traps heat in summer, so July and August afternoons can feel genuinely hot compared to the coast.
San Francisco's weather is famously counterintuitive. Summers are cool and foggy: Karl the Fog rolling through the Golden Gate in June and July can hold highs in the low 60s, while September and October bring the warmest, clearest days. Winters are mild and rainy rather than cold.
If you moved from the Midwest expecting California sun, San Francisco will surprise you. San Jose will not. Both cities avoid the extremes; they just disagree on what "pleasant" means.
Culture, nightlife, and entertainment
Food, music, neighborhoods, and the city vibe that gives each place its personality.
San Jose has invested seriously in its downtown over the past decade. The SAP Center hosts the Sharks and major touring acts, and the San Jose Museum of Art and the Tech Interactive anchor the Civic Center area. The SoFA District has a walkable stretch of bars, live music venues, and restaurants.
Japantown and the Santana Row shopping corridor add their own distinct character. The scene is real, but it thins out past midnight and spreads thin across a large city.
San Francisco is a different category. The Mission, Hayes Valley, North Beach, and the Castro each have their own bars, restaurants, and event calendars. The city also supports a full opera, a symphony, and the SFJAZZ Center, alongside a club scene centered on SoMa.
The cost of living index here hits 247 versus San Jose's 216, and some of that premium goes directly toward having more to do on a Tuesday night.
Outdoor activities and day trips
Parks, beaches, hikes, and the weekend escapes that define life outside the city limits.
San Jose's position between two mountain ranges gives residents quick access to trails most visitors never find. Alum Rock Park in the Diablo foothills has 13 miles of trails within the city limits, Almaden Quicksilver County Park offers sweeping ridge walks to the south, and the Santa Cruz Mountains (Sanborn County Park and the Castle Rock area) are 45 minutes away. Los Gatos Creek Trail is a practical greenway for cyclists and runners cutting through the suburbs.
San Francisco squeezes a lot of outdoor variety into 47 square miles. Golden Gate Park alone holds museums, lakes, and meadows; Land's End and Baker Beach put you on wild coastal bluffs a short bus ride from downtown. The Marin Headlands just across the Golden Gate Bridge offer serious hiking with views that won't get old.
For longer adventures, Muir Woods and Point Reyes National Seashore are within an hour. San Jose has the acreage; San Francisco has the scenery.
Bottom line: which city is right for you?
Based on the head-to-head data above, here's the short version — pick the city that lines up with what you actually care about.
Choose San Jose if you prioritize…
- a lower cost of living (cheaper groceries, services, and day-to-day expenses).
- lower crime — a safer place to live, work, and raise a family.
- more affordable housing relative to San Francisco.
Choose San Francisco if you prioritize…
- a more racially diverse community (lower HHI on Census data).
Methodology: winners are picked from public data — U.S. Census Bureau ACS (income, home value, rent, race/HHI), FBI Uniform Crime Reporting (crime rates per 100k), and HomeSnacks' proprietary SnackAbility quality-of-life score, which blends Bureau of Labor Statistics data with the above.
More about California

Best Places To Live In California
Photo: Public domain
Cheapest Places To Live In California
Photo: Public domain
Most Dangerous Cities In California
Photo: Public domain
Best Places To Raise A Family In California
Photo: Public domain
Best Places To Retire In California
Photo: Public domain
Richest Cities In California
Photo: Public domain
Safest Places In California
Photo: Public domain
Worst Places To Live In California
Photo: Public domain