The unfortunate fact of the matter is that some places in the Empire State have a larger percent of their population that never graduated from high school.
While the emphasis on going to college might be overblown, the fact is that not graduating from high school puts you at a significant disadvantage on average. Educational attainment might not be the best way to measure one person’s intelligence, but it does shine a light on the state.
We will use Saturday Night Science to determine what places in New York have the highest percentage of adults without a high school degree.
A recent study we published found that New York is the 26th smartest state in the United States, with an average IQ of 100.
But that doesn’t mean that a few cities in New York are a bit slower than others due to a lack of basic education.
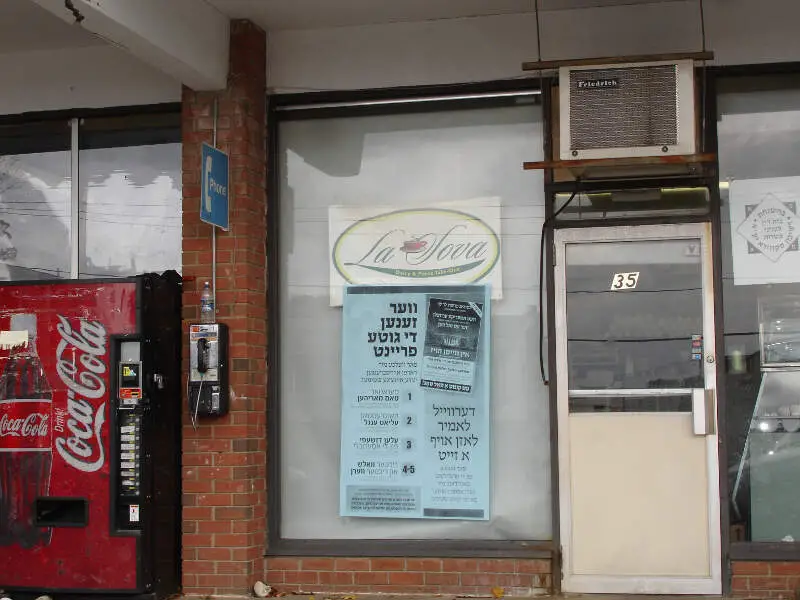
#1 dumbest in New York
New Square is an all-Hasidic village in the town of Ramapo, Rockland County, New York, United States. It is located north of Hillcrest, east of Viola, south of New Hempstead, and west of New City. As of the 2010 census, it had a population of 6,944. Its inhabitants are predominantly members of the Skverer Hasidic movement who seek to maintain a Hasidic lifestyle disconnected from the secular world.
Data | Crime | Cost of living | Movers
#2 dumbest in New York
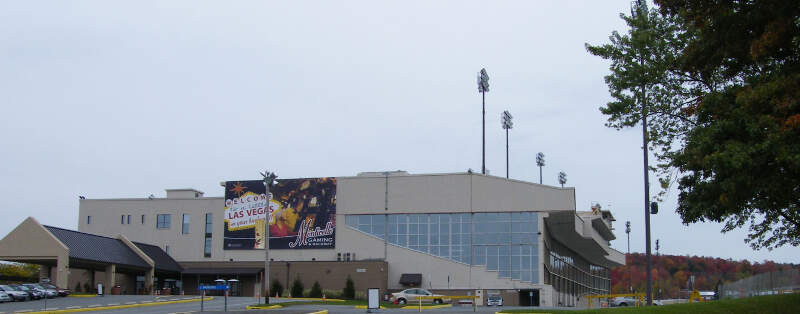
Kiryas Joel is a village within the town of Monroe in Orange County, New York, United States. The majority of its residents are Yiddish-speaking Hasidic Jews who belong to the worldwide Satmar Hasidic sect.
Data | Crime | Cost of living | Movers
#3 dumbest in New York
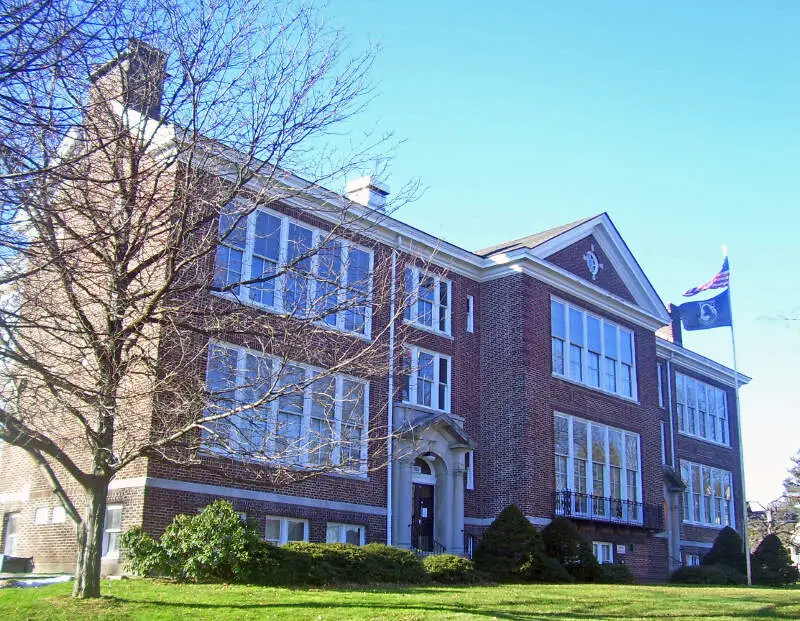
Monticello is a village located in Thompson in Sullivan County, New York, United States. The population was 6,726 at the 2010 census. It is the seat for the Town of Thompson and the county seat of Sullivan County. The village was named after the residence of Thomas Jefferson.
Data | Crime | Cost of living | Movers
#4 dumbest in New York
Coordinates: 4107N 7404W 41.117; -74.067
Data | Crime | Cost of living | Movers
#5 dumbest in New York
Spring Valley is a village in the towns of Ramapo and Clarkstown in Rockland County, New York, United States. It is located north of Chestnut Ridge, east of Airmont and Monsey, south of Hillcrest, and west of Nanuet. The population was 31,347 at the 2010 census, making it the 2nd most populous community in Rockland County, after New City.
Data | Crime | Cost of living | Movers
#6 dumbest in New York
Data | Movers
#7 dumbest in New York
Data | Crime | Cost of living | Movers
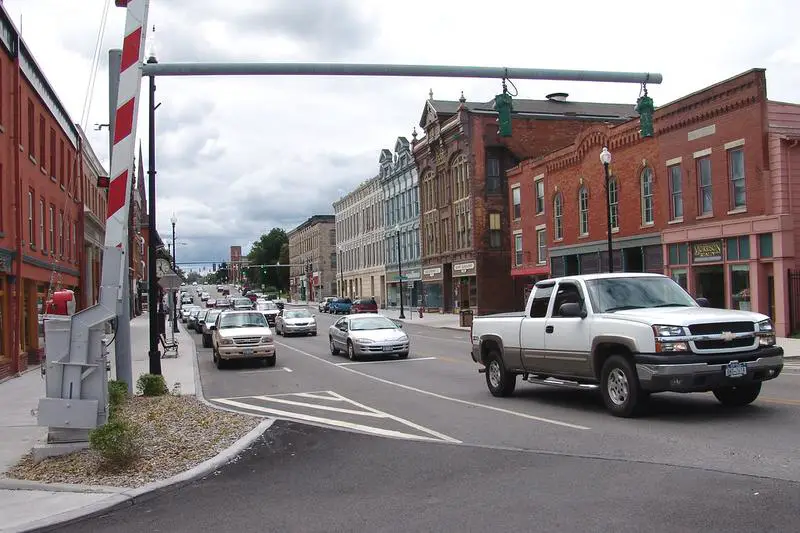
#8 dumbest in New York
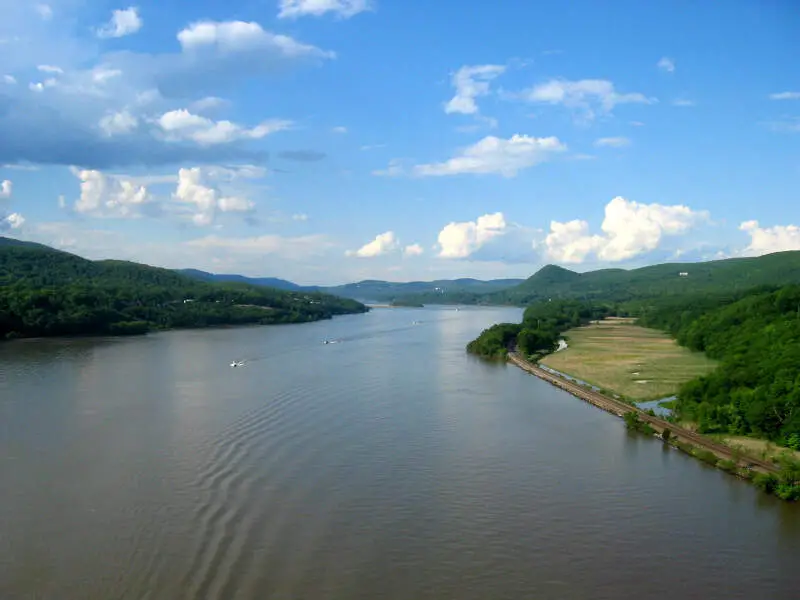
Newburgh is a city located in Orange County, New York, United States, 60 miles north of New York City, and 90 miles south of Albany, on the Hudson River. Newburgh is a part of the New York CSA. The Newburgh area was first settled in the early 18th century by the Germans and British. During the American Revolution, Newburgh served as the headquarters of the Continental Army. Prior to its chartering in 1865, the city of Newburgh was part of the town of Newburgh; the town now borders the city to the north and west. East of the city is the Hudson River; the city of Beacon, New York is across the river; and it is connected to Newburgh via the Newburgh-Beacon Bridge. The entire southern boundary of the city is with the town of New Windsor. Most of this boundary is formed by Quassaick Creek. In May 2016, the city requested help for its PFOS contaminated water supply under Superfund.
Data | Crime | Cost of living | Movers
#9 dumbest in New York
Data | Crime | Cost of living | Movers
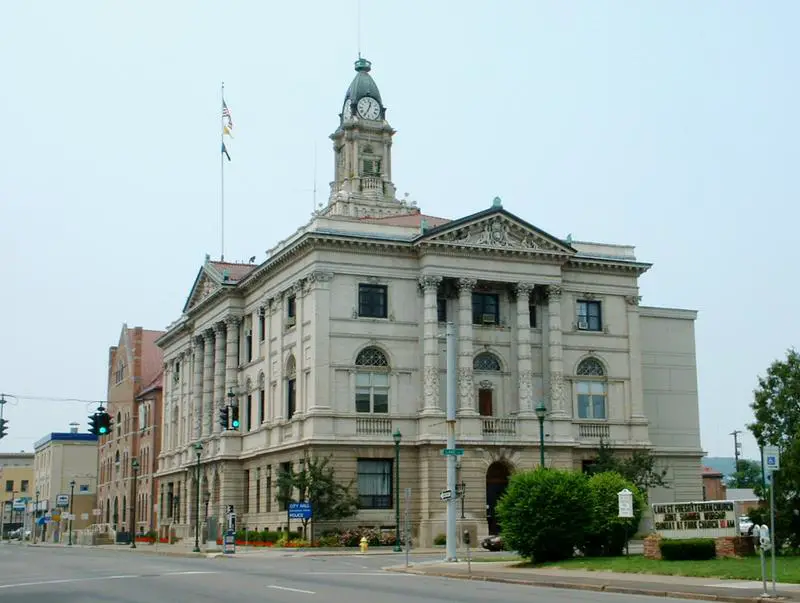
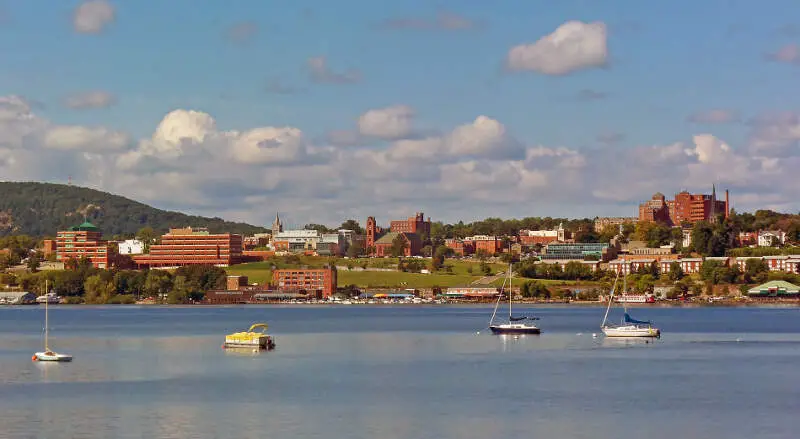
#10 dumbest in New York
Elmira is a city in Chemung County, New York, United States. It is the principal city of the Elmira, New York Metropolitan Statistical Area, which encompasses Chemung County, New York. The population was 29,200 at the 2010 census. It is the county seat of Chemung County.
Data | Crime | Cost of living | Movers
The receipts
Compare the top ten
Pick a metric. The bars rescale. The red line is New York’s statewide median.
On the map
Where New York’s dumbest cities are
Saturday Night Science
Methodology: How we determined the dumbest cities in the Empire State
We realize that formal education is only part of it when it comes to being intelligent, but on the other hand, knowing the difference between they’re, their, and there is always going to make you look pretty stupid.
So, we used Saturday Night Science to narrow down our criteria to focus on a city’s educational opportunities and what percentage of the population takes advantage of those opportunities.
In short, we came up with these criteria to determine the dumbest cities in New York:
- % of the city’s population with less than a high school education (Age 25+)
- % of city’s population with a college degree (Age 25+)
We got the data from the U.S. Census 2020-2024 American Community Survey.
Then, our algorithm generates a rank for each place in these categories. After crunching all the numbers, a ranking of the cities in New York from dumbest to brightest.
For this ranking, we used every New York city with at least 5,000 residents. We updated this article for 2026, and it’s our eleventh time ranking the dumbest cities in New York.
The full plate
Dumbest Cities In New York For 2026
Click any column to sort. Search by city name.
| Rank | City | Population | % Adult High School Dropout | % Highly Educated |
|---|---|---|---|---|
| 1 | New Square | 9,803 | 26.0% | 6.0% |
| 2 | Kiryas Joel | 38,916 | 26.0% | 6.0% |
| 3 | Monticello | 7,279 | 25.0% | 12.0% |
| 4 | Kaser | 5,694 | 18.0% | 4.0% |
| 5 | Spring Valley | 33,192 | 26.0% | 17.0% |
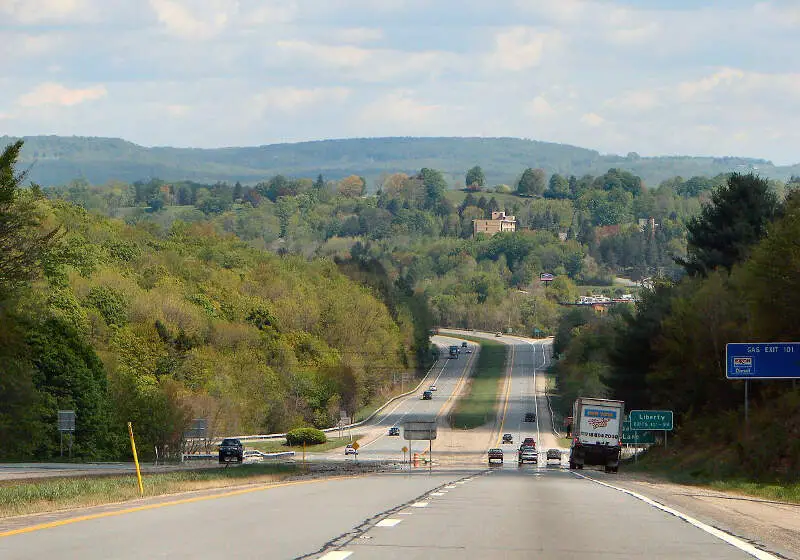
| 6 | Liberty | 5,142 | 18.0% | 15.0% |
| 7 | Fulton | 11,272 | 17.0% | 16.0% |
| 8 | Newburgh | 28,519 | 21.0% | 20.0% |
| 9 | Albion | 5,506 | 15.0% | 9.0% |
| 10 | Elmira | 26,257 | 18.0% | 18.0% |
| 11 | Middletown | 30,289 | 18.0% | 20.0% |
| 12 | Hempstead | 58,801 | 24.0% | 22.0% |
| 13 | Haverstraw | 12,325 | 29.0% | 25.0% |
| 14 | Herkimer | 7,566 | 13.0% | 15.0% |
| 15 | Wappingers Falls | 5,761 | 20.0% | 23.0% |
| 16 | Ogdensburg | 9,455 | 14.0% | 18.0% |
| 17 | Salamanca | 5,846 | 13.0% | 16.0% |
| 18 | Utica | 64,217 | 18.0% | 23.0% |
| 19 | Gloversville | 14,962 | 13.0% | 17.0% |
| 20 | Lackawanna | 19,753 | 14.0% | 20.0% |
| 21 | Mechanicville | 5,124 | 14.0% | 22.0% |
| 22 | Port Jervis | 8,652 | 12.0% | 16.0% |
| 23 | Auburn | 26,285 | 13.0% | 21.0% |
| 24 | Medina | 5,770 | 12.0% | 20.0% |
| 25 | Solvay | 6,544 | 14.0% | 24.0% |
| 26 | Endicott | 13,387 | 12.0% | 21.0% |
| 27 | West Haverstraw | 10,711 | 17.0% | 30.0% |
| 28 | Rome | 31,795 | 12.0% | 21.0% |
| 29 | Schenectady | 68,847 | 14.0% | 26.0% |
| 30 | Syracuse | 146,384 | 17.0% | 30.0% |
| 31 | Bath | 5,560 | 11.0% | 18.0% |
| 32 | Massena | 10,238 | 13.0% | 25.0% |
| 33 | Watervliet | 10,287 | 11.0% | 17.0% |
| 34 | Dunkirk | 12,549 | 11.0% | 17.0% |
| 35 | Airmont | 10,205 | 17.0% | 31.0% |
| 36 | Rochester | 208,772 | 16.0% | 30.0% |
| 37 | Port Chester | 31,102 | 21.0% | 37.0% |
| 38 | Amsterdam | 18,166 | 12.0% | 23.0% |
| 39 | Ossining | 26,950 | 21.0% | 37.0% |
| 40 | Freeport | 44,088 | 13.0% | 27.0% |
| 41 | Jamestown | 28,188 | 11.0% | 22.0% |
| 42 | Yonkers | 209,978 | 17.0% | 35.0% |
| 43 | Binghamton | 47,151 | 14.0% | 30.0% |
| 44 | Newark | 8,991 | 10.0% | 19.0% |
| 45 | Niagara Falls | 47,987 | 11.0% | 23.0% |
| 46 | Mount Vernon | 72,427 | 15.0% | 35.0% |
| 47 | Rensselaer | 9,287 | 12.0% | 26.0% |
| 48 | Chestnut Ridge | 10,557 | 15.0% | 35.0% |
| 49 | Sleepy Hollow | 10,887 | 25.0% | 43.0% |
| 50 | Peekskill | 25,625 | 16.0% | 38.0% |
| 51 | Oneida | 10,171 | 11.0% | 25.0% |
| 52 | Buffalo | 276,854 | 13.0% | 31.0% |
| 53 | Kingston | 23,911 | 13.0% | 32.0% |
| 54 | Hornell | 8,152 | 9.0% | 22.0% |
| 55 | New York | 8,483,844 | 16.0% | 42.0% |
| 56 | Ilion | 7,593 | 9.0% | 22.0% |
| 57 | North Syracuse | 6,693 | 9.0% | 25.0% |
| 58 | Batavia | 15,097 | 8.0% | 21.0% |
| 59 | Lockport | 20,610 | 9.0% | 25.0% |
| 60 | Poughkeepsie | 31,958 | 11.0% | 32.0% |
| 61 | Hudson | 5,865 | 15.0% | 44.0% |
| 62 | Norwich | 6,782 | 10.0% | 27.0% |
| 63 | Walden | 6,868 | 10.0% | 27.0% |
| 64 | Patchogue | 12,396 | 12.0% | 35.0% |
| 65 | Malone | 5,429 | 8.0% | 24.0% |
| 66 | Watertown | 24,375 | 9.0% | 26.0% |
| 67 | Geneva | 12,512 | 12.0% | 40.0% |
| 68 | Elmsford | 5,186 | 13.0% | 43.0% |
| 69 | Lindenhurst | 27,142 | 10.0% | 31.0% |
| 70 | Colonie | 7,702 | 11.0% | 35.0% |
| 71 | Glen Cove | 28,112 | 13.0% | 42.0% |
| 72 | Cortland | 17,450 | 9.0% | 27.0% |
| 73 | Hudson Falls | 7,395 | 4.0% | 14.0% |
| 74 | Oswego | 17,033 | 8.0% | 26.0% |
| 75 | New Hempstead | 5,472 | 13.0% | 46.0% |
| 76 | Olean | 13,738 | 9.0% | 31.0% |
| 77 | Westbury | 15,808 | 12.0% | 42.0% |
| 78 | Monroe | 9,515 | 11.0% | 42.0% |
| 79 | Cohoes | 18,159 | 8.0% | 28.0% |
| 80 | Valley Stream | 40,315 | 11.0% | 40.0% |
| 81 | Johnstown | 8,111 | 6.0% | 22.0% |
| 82 | Troy | 51,033 | 10.0% | 38.0% |
| 83 | Depew | 15,000 | 6.0% | 25.0% |
| 84 | Goshen | 5,773 | 10.0% | 40.0% |
| 85 | Lancaster | 10,113 | 7.0% | 27.0% |
| 86 | East Rochester | 6,218 | 9.0% | 36.0% |
| 87 | Hilton | 5,968 | 6.0% | 26.0% |
| 88 | Glens Falls | 14,609 | 8.0% | 34.0% |
| 89 | Webster | 5,718 | 10.0% | 42.0% |
| 90 | Beacon | 14,834 | 11.0% | 48.0% |
| 91 | Canandaigua | 10,514 | 8.0% | 37.0% |
| 92 | Mineola | 21,211 | 13.0% | 57.0% |
| 93 | Lynbrook | 20,325 | 9.0% | 42.0% |
| 94 | Suffern | 11,441 | 9.0% | 43.0% |
| 95 | New Rochelle | 82,769 | 11.0% | 52.0% |
| 96 | Washingtonville | 5,707 | 7.0% | 35.0% |
| 97 | Plattsburgh | 19,830 | 8.0% | 41.0% |
| 98 | North Tonawanda | 30,198 | 5.0% | 28.0% |
| 99 | Mamaroneck | 19,826 | 12.0% | 57.0% |
| 100 | Corning | 10,643 | 7.0% | 39.0% |
Source: U.S. Census ACS 2020-2024. 162 cities with more than 5,000 residents.
Summary
There You Have It – Now That You’re Asleep
If you’re measuring the locations in New York where there are a high number of dropouts and adults who never received a formal education, this is an accurate ranking.
The dumbest cities in New York are New Square, Kiryas Joel, Monticello, Kaser, Spring Valley, Liberty, Fulton, Newburgh, Albion, and Elmira. Not sold on New York? Take the two-minute Find Your Place quiz and see which state actually fits you.