

Gayest places in Missouri research summary. We used Saturday Night Science to research the cities in Missouri with the highest percent of same-sex households for 2026. The data comes from the American Community Survey 2020-2024 5-year vintage, which counts same-sex married spouses and same-sex unmarried partners at the city level.
7.2% gay households · #1 gayest in Missouri
5.5% gay households · #2 gayest in Missouri
 Located in
St. Louis County, Missouri
Located in
St. Louis County, Missouri
Data | Crime | Cost of living | Movers
3.0% gay households · #3 gayest in Missouri
Data | Crime | Cost of living | Movers
2.8% gay households · #4 gayest in Missouri
Data | Crime | Cost of living | Movers
2.6% gay households · #5 gayest in Missouri
Data | Crime | Cost of living | Movers
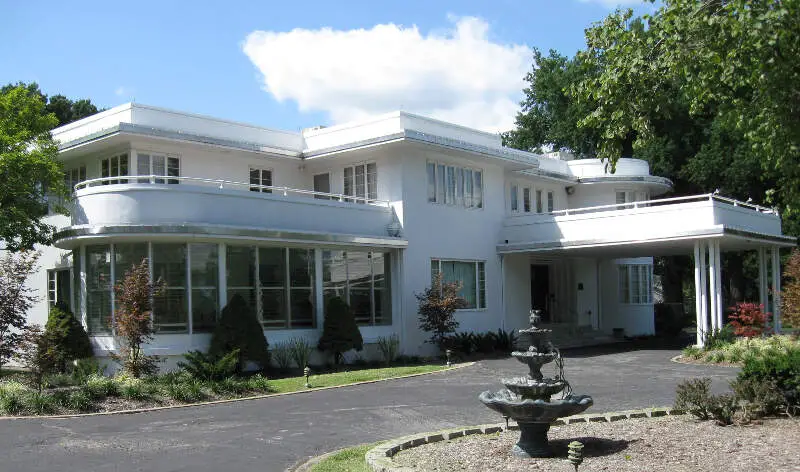
2.6% gay households · #6 gayest in Missouri
Data | Crime | Cost of living | Movers
2.5% gay households · #7 gayest in Missouri
 Located in
Jackson County, Missouri
Located in
Jackson County, Missouri
Grain Valley is a city in Jackson County, Missouri, in the United States. Grain Valley is located in the Kansas City Metropolitan Area and is a suburb of Kansas City, Missouri. It is approx. 23 miles east of Kansas City.
Data | Crime | Cost of living | Movers
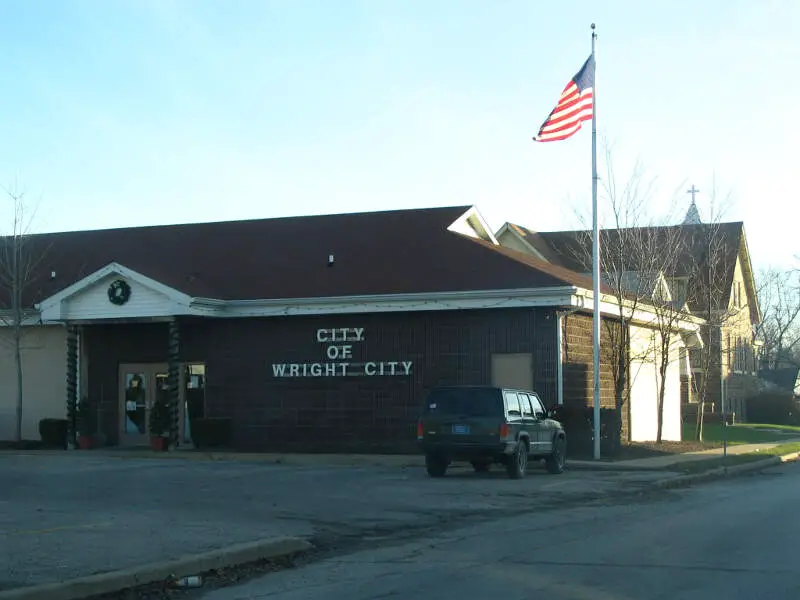
2.5% gay households · #8 gayest in Missouri
Data | Crime | Cost of living | Movers
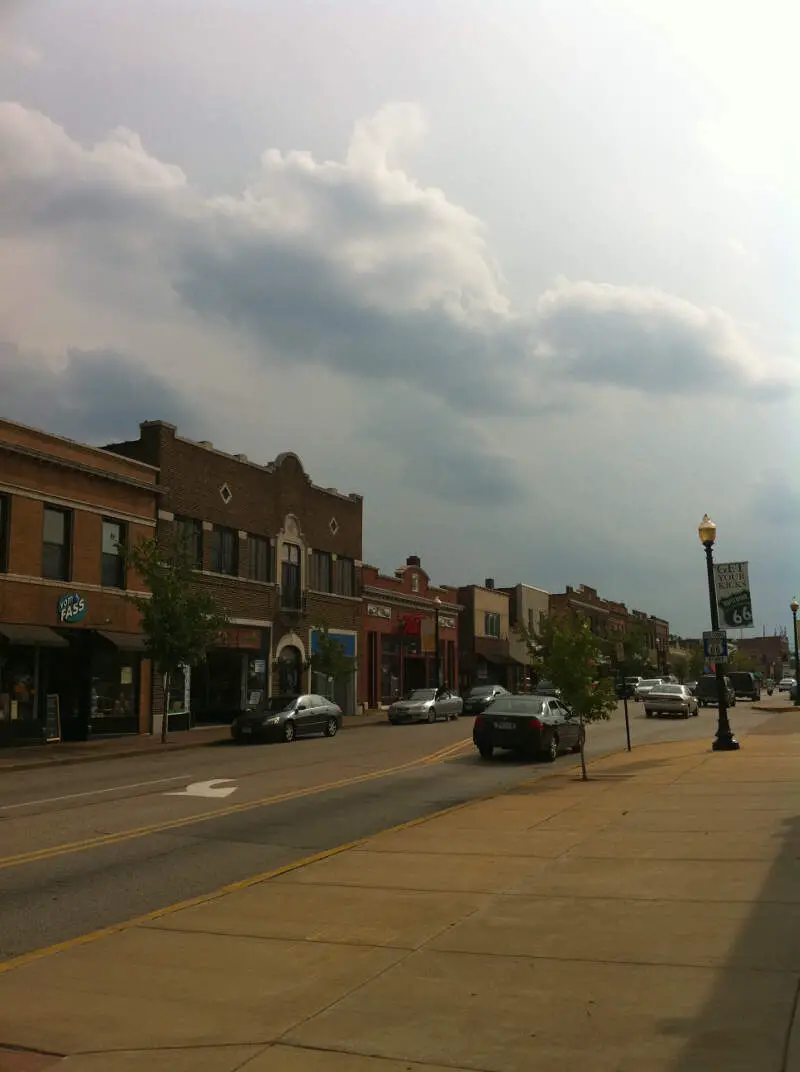
2.4% gay households · #9 gayest in Missouri
 Located in
St. Louis County, Missouri
Located in
St. Louis County, Missouri
Maplewood is an inner-ring suburb of St. Louis, located in St. Louis County. The population was 8,046 at the 2010 census.
Data | Crime | Cost of living | Movers
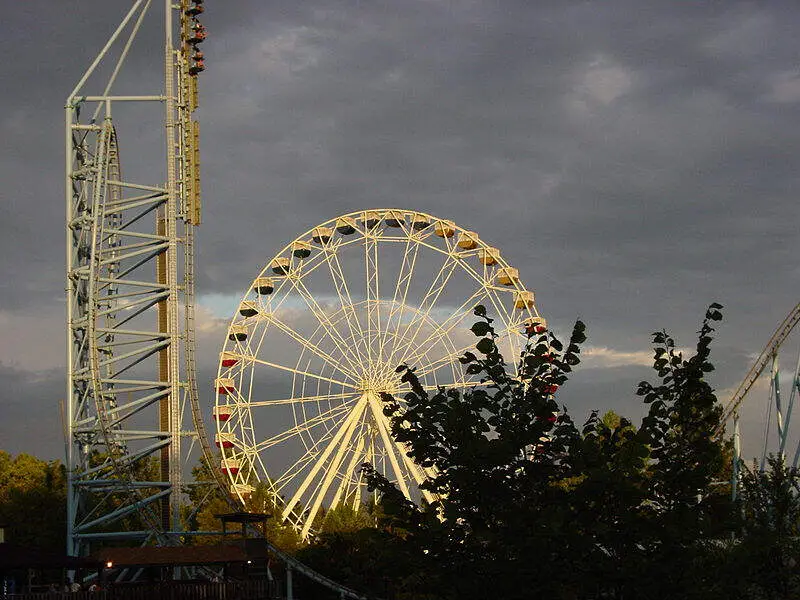
2.2% gay households · #10 gayest in Missouri
 Located in
St. Louis County, Missouri
Located in
St. Louis County, Missouri
Coordinates: 383010N 903842W 38.502736; -90.645075
Data | Crime | Cost of living | Movers
The receipts
Compare the top ten
Pick a metric. The bars rescale. The red line is Missouri’s statewide median.
On the map
Where Missouri’s LGBTQ households are
Saturday Night Science
How we determined the gayest places in Missouri for 2026
In order to rank the gayest cities in Missouri, we used Saturday Night Science and the 2020-2024 American Community Survey 5-year estimates from the U.S. Census. We looked at:
- Percentage of all households that are unmarried, same-sex partners
We limited the analysis to non-CDPs that have over 1,000 households.
We ranked each place from 1 to 214 with the city containing the highest percentage of unmarried, same-sex partner households being the most gay.
In the end, Pagedale ended up being the most gay place with 7.2% gay households.
Skip to the end to see the list of all the places in the state from gayest to straightest.
We updated this report for 2026. This report is our eleventh time ranking the gayest places in Missouri.
The full plate
Gayest Places In Missouri
Click any column to sort. Search by city name.
| Rank | City | Households | LGBTQ Households | % Gay Households |
|---|---|---|---|---|
| 1 | Pagedale | 1,188 | 85 | 7.2% |
| 2 | Black Jack | 2,683 | 148 | 5.5% |
| 3 | Mountain Grove | 1,957 | 59 | 3.0% |
| 4 | Desloge | 1,977 | 55 | 2.8% |
| 5 | El Dorado Springs | 1,689 | 44 | 2.6% |
| 6 | Centralia | 1,987 | 51 | 2.6% |
| 7 | Grain Valley | 6,119 | 155 | 2.5% |
| 8 | Wright City | 1,783 | 44 | 2.5% |
| 9 | Maplewood | 4,418 | 106 | 2.4% |
| 10 | Eureka | 4,690 | 104 | 2.2% |
| 11 | Riverview | 1,327 | 27 | 2.0% |
| 12 | Caruthersville | 2,276 | 45 | 2.0% |
| 13 | St. Louis | 144,891 | 2,754 | 1.9% |
| 14 | Potosi | 1,059 | 20 | 1.9% |
| 15 | Sullivan | 2,722 | 51 | 1.9% |
| 16 | Boonville | 2,710 | 49 | 1.8% |
| 17 | Marshall | 4,456 | 79 | 1.8% |
| 18 | Knob Noster | 1,298 | 23 | 1.8% |
| 19 | Aurora | 2,940 | 52 | 1.8% |
| 20 | Osage Beach | 2,267 | 40 | 1.8% |
| 21 | Carrollton | 1,287 | 22 | 1.7% |
| 22 | Willard | 2,180 | 37 | 1.7% |
| 23 | Ste. Genevieve | 2,023 | 34 | 1.7% |
| 24 | Dexter | 3,249 | 54 | 1.7% |
| 25 | Webster Groves | 9,446 | 154 | 1.6% |
| 26 | St. Clair | 2,034 | 33 | 1.6% |
| 27 | California | 2,028 | 32 | 1.6% |
| 28 | Marlborough | 1,340 | 21 | 1.6% |
| 29 | Washington | 6,702 | 105 | 1.6% |
| 30 | Country Club | 1,103 | 17 | 1.5% |
| 31 | Bolivar | 4,475 | 68 | 1.5% |
| 32 | Kansas City | 221,979 | 3,211 | 1.4% |
| 33 | Cape Girardeau | 16,364 | 234 | 1.4% |
| 34 | Rolla | 8,005 | 113 | 1.4% |
| 35 | Blue Springs | 22,908 | 322 | 1.4% |
| 36 | Springfield | 78,824 | 1,093 | 1.4% |
| 37 | Clayton | 6,222 | 86 | 1.4% |
| 38 | North Kansas City | 2,776 | 38 | 1.4% |
| 39 | Moberly | 5,103 | 68 | 1.3% |
| 40 | Vinita Park | 1,070 | 14 | 1.3% |
| 41 | Overland | 6,378 | 82 | 1.3% |
| 42 | Chesterfield | 20,811 | 267 | 1.3% |
| 43 | Rogersville | 1,647 | 21 | 1.3% |
| 44 | Sikeston | 6,883 | 87 | 1.3% |
| 45 | Wentzville | 16,294 | 205 | 1.3% |
| 46 | Smithville | 4,075 | 50 | 1.2% |
| 47 | University City | 15,782 | 191 | 1.2% |
| 48 | Columbia | 52,564 | 596 | 1.1% |
| 49 | Pleasant Valley | 1,150 | 13 | 1.1% |
| 50 | Raytown | 12,492 | 138 | 1.1% |
| 51 | Crystal City | 1,845 | 20 | 1.1% |
| 52 | Hannibal | 6,891 | 74 | 1.1% |
| 53 | Town and Country | 4,035 | 43 | 1.1% |
| 54 | Park Hills | 3,661 | 39 | 1.1% |
| 55 | Raymore | 9,322 | 98 | 1.1% |
| 56 | Independence | 51,477 | 530 | 1.0% |
| 57 | Maryland Heights | 12,592 | 126 | 1.0% |
| 58 | Louisiana | 1,403 | 14 | 1.0% |
| 59 | Rock Hill | 2,253 | 22 | 1.0% |
| 60 | Kimberling City | 1,231 | 12 | 1.0% |
| 61 | Piedmont | 1,137 | 11 | 1.0% |
| 62 | Normandy | 1,872 | 18 | 1.0% |
| 63 | St. Peters | 24,591 | 229 | 0.9% |
| 64 | Joplin | 22,710 | 211 | 0.9% |
| 65 | Ferguson | 8,097 | 73 | 0.9% |
| 66 | Valley Park | 3,219 | 29 | 0.9% |
| 67 | Clinton | 4,002 | 36 | 0.9% |
| 68 | Chillicothe | 3,390 | 30 | 0.9% |
| 69 | Riverside | 1,627 | 14 | 0.9% |
| 70 | Breckenridge Hills | 2,225 | 19 | 0.9% |
| 71 | Platte City | 2,041 | 17 | 0.8% |
| 72 | Chaffee | 1,340 | 11 | 0.8% |
| 73 | Lebanon | 6,338 | 52 | 0.8% |
| 74 | Ladue | 3,428 | 28 | 0.8% |
| 75 | St. James | 1,596 | 13 | 0.8% |
| 76 | Festus | 5,091 | 40 | 0.8% |
| 77 | Montgomery City | 1,184 | 9 | 0.8% |
| 78 | Kearney | 4,316 | 32 | 0.7% |
| 79 | Warrensburg | 7,441 | 54 | 0.7% |
| 80 | Jefferson City | 17,529 | 124 | 0.7% |
| 81 | Grandview | 11,566 | 79 | 0.7% |
| 82 | Jennings | 5,589 | 38 | 0.7% |
| 83 | Richmond | 2,662 | 18 | 0.7% |
| 84 | Creve Coeur | 8,158 | 55 | 0.7% |
| 85 | Gladstone | 11,765 | 78 | 0.7% |
| 86 | Pine Lawn | 1,068 | 7 | 0.7% |
| 87 | Camdenton | 1,231 | 8 | 0.6% |
| 88 | Manchester | 7,279 | 46 | 0.6% |
| 89 | Lee’s Summit | 40,526 | 250 | 0.6% |
| 90 | Dardenne Prairie | 4,704 | 29 | 0.6% |
| 91 | Brentwood | 4,091 | 24 | 0.6% |
| 92 | Florissant | 21,229 | 124 | 0.6% |
| 93 | Union | 4,990 | 29 | 0.6% |
| 94 | Macon | 2,431 | 14 | 0.6% |
| 95 | New Haven | 1,050 | 6 | 0.6% |
| 96 | Maryville | 4,230 | 24 | 0.6% |
| 97 | Woodson Terrace | 1,597 | 9 | 0.6% |
| 98 | St. Joseph | 28,756 | 162 | 0.6% |
| 99 | Republic | 8,439 | 46 | 0.5% |
| 100 | Clever | 1,105 | 6 | 0.5% |
Source: U.S. Census ACS 2020-2024. Places with over 1,000 households.
Summary
There You Have It – The Most LGBT Friendly Cities In Missouri For 2026
If you’re looking at the number of gay households in Missouri, this is an accurate list.
The gayest cities in Missouri are Pagedale, Black Jack, Mountain Grove, Desloge, El Dorado Springs, Centralia, Grain Valley, Wright City, Maplewood, and Eureka. Not sold on Missouri? Take the two-minute Find Your Place quiz and see which state actually fits you.
Questions and answers
Gayest Places In Missouri FAQs
What is the gayest city in Missouri?
Pagedale is the gayest place in Missouri for 2026, with same-sex couples making up 7.2% of households. Black Jack and Mountain Grove are next.
What are the gayest places in Missouri?
The gayest places in Missouri are Pagedale, Black Jack, Mountain Grove, Desloge, El Dorado Springs, Centralia, Grain Valley, Wright City, Maplewood, and Eureka. We ranked all 214 places with over 1,000 households by their share of same-sex partner households.
How do you measure the gayest places?
The Census does not ask about sexual orientation, so we use the closest thing it tracks: the share of households headed by same-sex partners, from the American Community Survey. It undercounts single LGBT residents, but it is consistent from place to place.
What is the straightest place in Missouri?
Lawson is the straightest place in Missouri by this measure, with same-sex couples at 0.0% of households. It anchors the other end of the ranking.
Does a town have to be big to make the list?
No. Any Missouri place with more than 1,000 households qualifies, and 214 made the cut this year. Small towns can and do out-rank the big cities on this one.



