Most African American cities in Iowa research summary. We used Saturday Night Science to analyze Iowa’s most recent Census data to determine the cities with the largest Black population, based on the percentage of Black residents.
The city with the largest African American population in Iowa is Waterloo (16.4% Black); the least is Norwalk (0.1%). Statewide, Iowa is 3.8% Black — the 36th blackest state in the country.
Roughly 42 million people identifying as Black or African American live in the United States, about 12% of the total population. In Iowa, the Black population is 121,705, at 3.8% of the state total.
We broke down the most recent Census data to determine the cities in Iowa with the largest African American population in 2026.
#1 most African American in Iowa
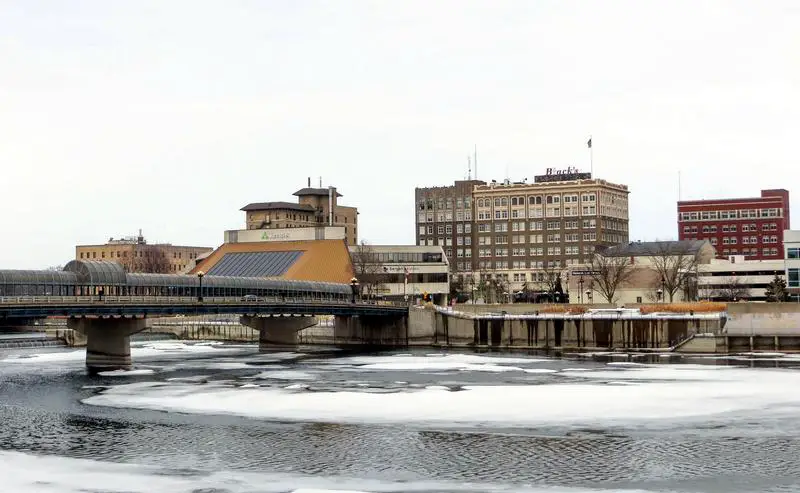
Waterloo is a city in and the county seat of Black Hawk County, Iowa, United States. As of the 2010 United States Census the population decreased by 0.5% to 68,406; the 2014 Census estimates the population at 68,364, making it the sixth-largest city in the state. The city is part of the Waterloo – Cedar Falls Metropolitan Statistical Area, and is the more populous of the two cities.
Data | Crime | Cost of living | Movers
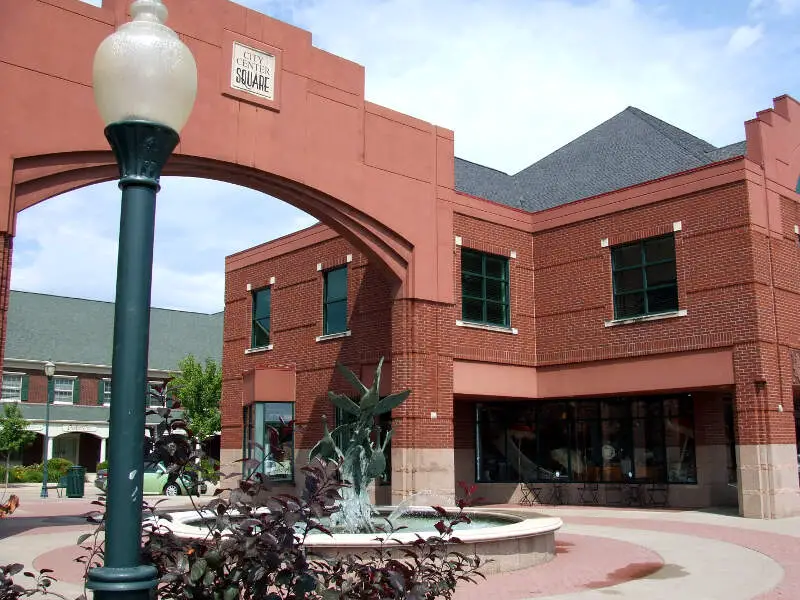
#2 most African American in Iowa
Coralville is a city in Johnson County, Iowa, United States. It is a suburb of Iowa City and part of the Iowa City Metropolitan Statistical Area. The population was 18,907 at the 2010 census.
Data | Crime | Cost of living | Movers
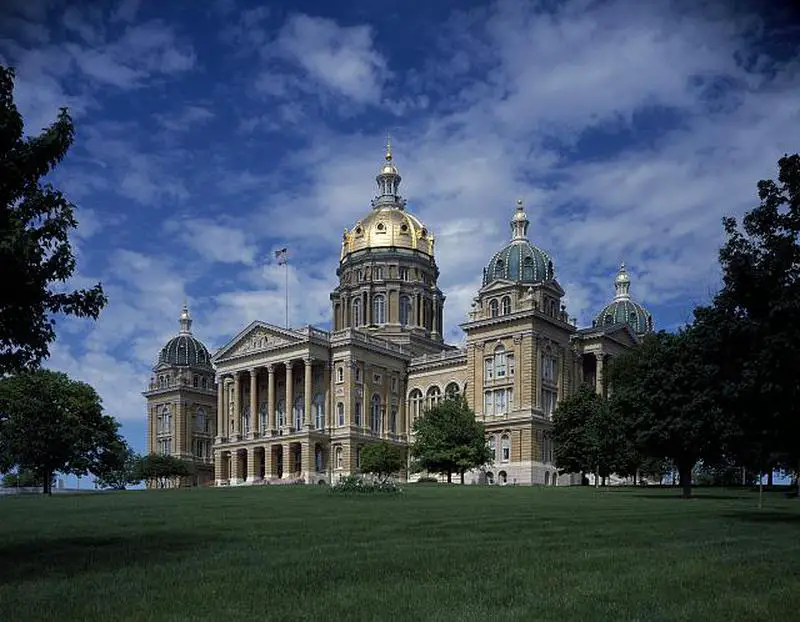
#3 most African American in Iowa
Des Moines is the capital and the most populous city in the U.S. state of Iowa. It is also the county seat of Polk County. A small part of the city extends into Warren County. It was incorporated on September 22, 1851, as Fort Des Moines, which was shortened to “Des Moines” in 1857. It is on and named after the Des Moines River, which likely was adapted from the French colonial name, Rivire des Moines, meaning “River of the Monks”. The city’s population was 203,433 as of the 2010 census. The five-county metropolitan area is ranked 89th in terms of population in the United States with 634,725 residents according to the 2016 estimate by the United States Census Bureau.
Data | Crime | Cost of living | Movers | Compare
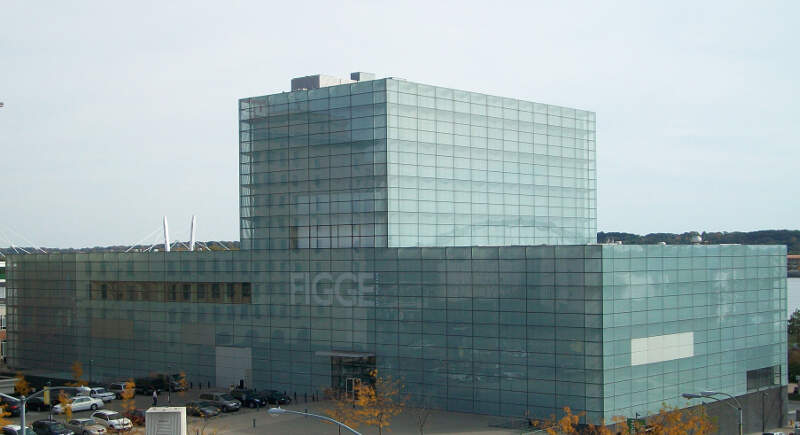
#4 most African American in Iowa
Davenport is the county seat of Scott County in Iowa and is located along the Mississippi River on the eastern border of the state. It is the largest of the Quad Cities, a metropolitan area with a population estimate of 382,630 and a CSA population of 474,226; it is the 90th largest CSA in the nation. Davenport was founded on May 14, 1836 by Antoine Le Claire and was named for his friend, George Davenport, a colonel who was stationed at nearby Fort Armstrong during the Black Hawk War. According to the 2010 census, the city had a population of 99,685. The city appealed this figure, arguing that the Census Bureau missed a section of residents, and that its total population was more than 100,000. The Census Bureau estimated Davenport’s 2011 population to be 100,802.
Data | Crime | Cost of living | Movers
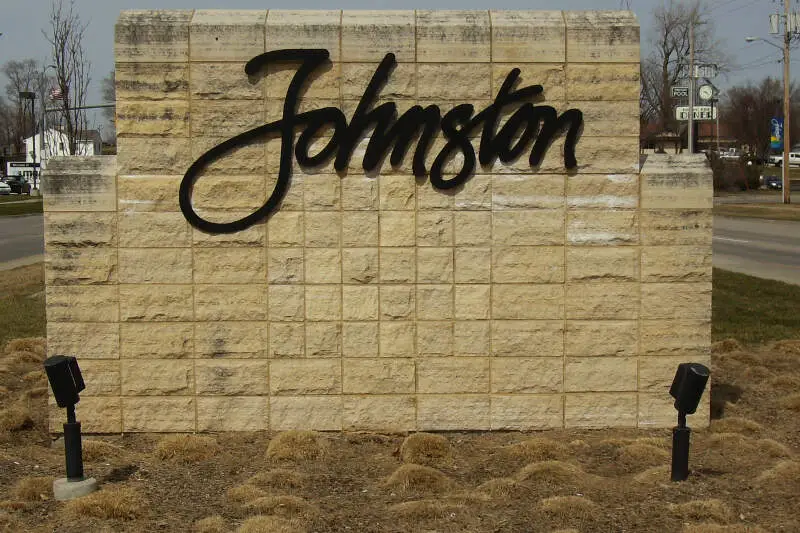
#5 most African American in Iowa
Johnston is a city in Polk County, Iowa, United States. The population was 17,278 in the 2010 census, an increase of almost 100% from the 8,649 population in the 2000 census. It is part of the Des Moines-West Des Moines Metropolitan Statistical Area.
Data | Crime | Cost of living | Movers
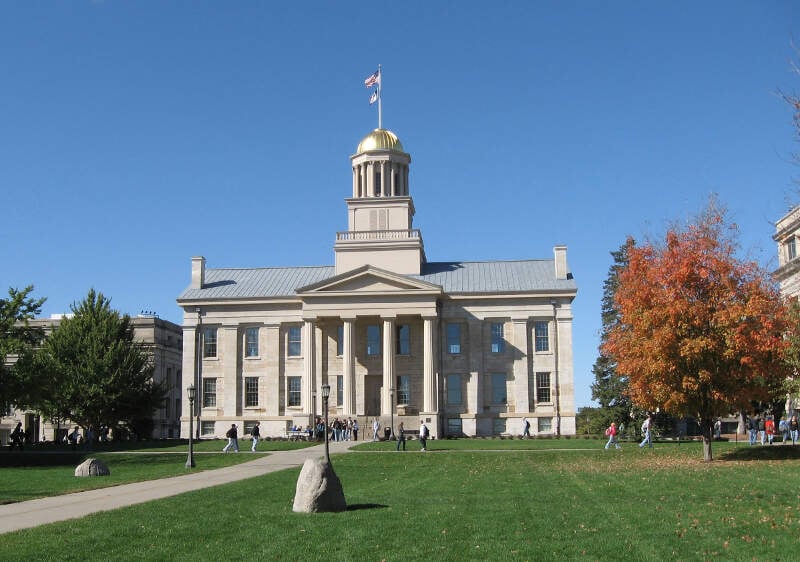
#6 most African American in Iowa
Iowa City is a city in Johnson County, Iowa, United States. It is the home of the University of Iowa and county seat of Johnson County, at the center of the Iowa City Metropolitan Statistical Area. The U.S. Census Bureau estimated the city’s population at 74,398 in 2016, making it the state’s fifth-largest city. Iowa City is the county seat of Johnson County. The metropolitan area, which encompasses Johnson and Washington counties, has a population of over 164,000.
Data | Crime | Cost of living | Movers
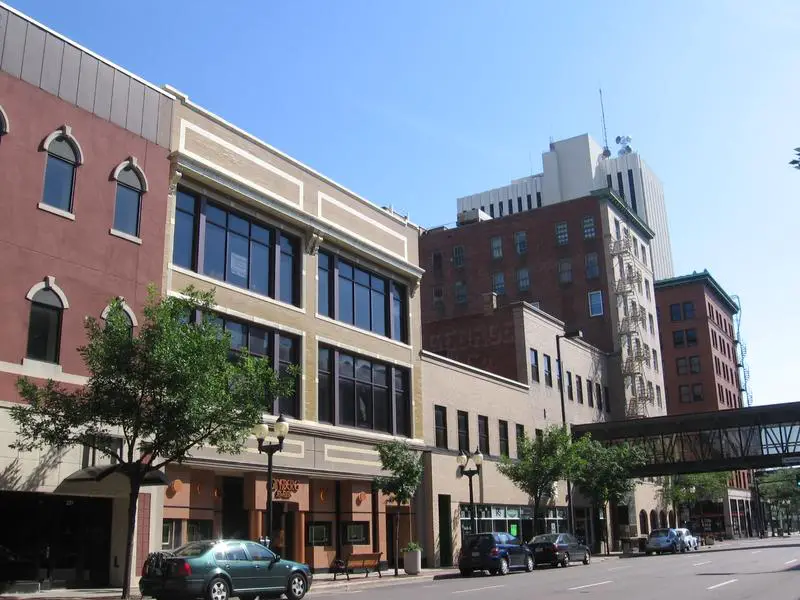
#7 most African American in Iowa
Cedar Rapids is the second largest city in Iowa and is the county seat of Linn County. The city lies on both banks of the Cedar River, 20 miles north of Iowa City and 100 miles northeast of Des Moines, the state’s capital and largest city. It is a part of the Cedar Rapids/Iowa City Corridor of Linn, Benton, Cedar, Jones, Johnson, and Washington counties. Until massive flooding in 2008, the city’s government was headquartered in the Veterans Memorial Building, near the Linn County Courthouse and jail on Mays Island in the Cedar River; Cedar Rapids was one of a few cities in the world, along with Paris, France, with governmental offices on a municipal island.
Data | Crime | Cost of living | Movers
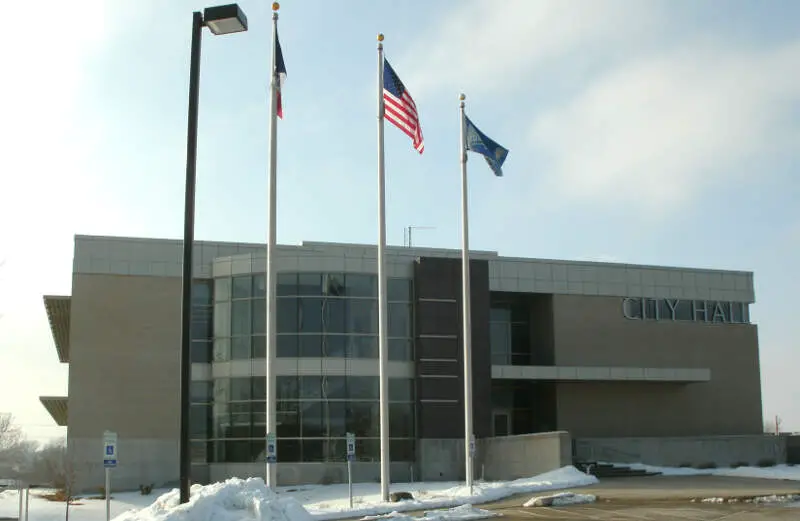
#8 most African American in Iowa
Hiawatha is a city in Linn County, Iowa, United States. It is a suburb located north of Cedar Rapids and is part of the Cedar Rapids Metropolitan Statistical Area. The population was 7,024 in the 2010 census, an increase from 6,480 in 2000.
Data | Crime | Cost of living | Movers
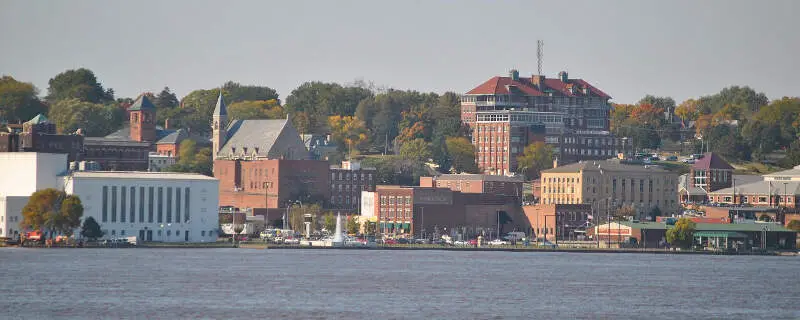
#9 most African American in Iowa
Burlington is a city and the county seat of Des Moines County, Iowa, United States. The population was 25,663 in the 2010 census, a decline from the 26,839 population in the 2000 census. Burlington is the center of a micropolitan area including West Burlington, Iowa, and Middletown, Iowa, and Gulfport, Illinois. Burlington is the home of Snake Alley, once labelled the crookedest alley in the world.
Data | Crime | Cost of living | Movers
#10 most African American in Iowa
Grimes is a city in Dallas and Polk counties in the U.S. state of Iowa. The population was 8,246 at the 2010 census. Grimes is part of the Des Moines-West Des Moines Metropolitan Statistical Area.
Data | Crime | Cost of living | Movers
The receipts
Compare the top ten
Pick a metric. The bars rescale. The red line is Iowa’s statewide median.
On the map
Where Iowa’s Black communities live
Saturday Night Science
Methodology: How We Determined The Cities In Iowa With The Largest Black Population For 2026
We still believe in the accuracy of data — especially from the Census. So that’s where we went to get the race breakdown across Iowa.
That leads us to the Census’s most recently available data, the 2020-2024 American Community Survey data from the US Census.
Specifically, we looked at table B03002: Hispanic OR LATINO ORIGIN BY RACE. Here are the category names as defined by the Census:
- Hispanic or Latino
- White alone*
- Black or African American alone*
- American Indian and Alaska Native alone*
- Asian alone*
- Native Hawaiian and Other Pacific Islander alone*
- Some other race alone*
- Two or more races*
Our particular column of interest was the number of people who identified as Black or African American.
We limited our analysis to non-CDPs with a population greater than 5,000 people in Iowa. That left us with 76 cities.
We then calculated the percentage of residents that are Black or African American. The percentages ranked from 16.4% to 0.1%.
Finally, we ranked each city based on the percentage of the Black population, with a higher score being more Black than a lower score. Waterloo took the distinction of being the most Black, while Norwalk was the least African American city.
We updated this article for 2026. This is our eleventh time ranking the cities in Iowa with the largest African American population.
The full plate
African American Population By City In Iowa
Click any column to sort. Search by city name.
| Rank | City | Population | African American Population | % African American |
|---|---|---|---|---|
| 1 | Waterloo | 67,008 | 11,004 | 16.4% |
| 2 | Coralville | 23,234 | 3,114 | 13.4% |
| 3 | Des Moines | 212,421 | 23,574 | 11.1% |
| 4 | Davenport | 100,913 | 11,086 | 11.0% |
| 5 | Johnston | 24,384 | 2,590 | 10.6% |
| 6 | Iowa City | 75,752 | 7,093 | 9.4% |
| 7 | Cedar Rapids | 137,264 | 11,682 | 8.5% |
| 8 | Hiawatha | 7,206 | 487 | 6.8% |
| 9 | Burlington | 23,728 | 1,573 | 6.6% |
| 10 | Grimes | 16,366 | 1,011 | 6.2% |
| 11 | Anamosa | 5,629 | 338 | 6.0% |
| 12 | Sioux City | 86,101 | 5,117 | 5.9% |
| 13 | Le Mars | 10,640 | 590 | 5.5% |
| 14 | Clinton | 24,322 | 1,290 | 5.3% |
| 15 | Altoona | 21,495 | 1,106 | 5.1% |
| 16 | Waukee | 29,236 | 1,478 | 5.1% |
| 17 | West Des Moines | 71,083 | 3,581 | 5.0% |
| 18 | Urbandale | 46,595 | 2,214 | 4.8% |
| 19 | Mount Pleasant | 8,951 | 424 | 4.7% |
| 20 | Fort Dodge | 24,827 | 1,149 | 4.6% |
| 21 | Clarinda | 5,353 | 223 | 4.2% |
| 22 | Dubuque | 59,174 | 2,426 | 4.1% |
| 23 | North Liberty | 21,125 | 852 | 4.0% |
| 24 | Ottumwa | 25,430 | 1,023 | 4.0% |
| 25 | Fairfield | 9,456 | 368 | 3.9% |
| 26 | Pleasant Hill | 11,136 | 429 | 3.9% |
| 27 | Ames | 67,669 | 2,579 | 3.8% |
| 28 | Storm Lake | 11,428 | 431 | 3.8% |
| 29 | Muscatine | 23,489 | 839 | 3.6% |
| 30 | Fort Madison | 10,133 | 354 | 3.5% |
| 31 | Keokuk | 9,662 | 308 | 3.2% |
| 32 | Red Oak | 5,510 | 167 | 3.0% |
| 33 | Clive | 19,012 | 548 | 2.9% |
| 34 | Mason City | 27,050 | 772 | 2.9% |
| 35 | Council Bluffs | 62,586 | 1,671 | 2.7% |
| 36 | Sheldon | 5,474 | 143 | 2.6% |
| 37 | Marion | 41,896 | 1,078 | 2.6% |
| 38 | Bettendorf | 39,647 | 1,010 | 2.5% |
| 39 | Ankeny | 72,615 | 1,807 | 2.5% |
| 40 | Waverly | 10,494 | 256 | 2.4% |
| 41 | Maquoketa | 6,075 | 142 | 2.3% |
| 42 | Marshalltown | 27,626 | 586 | 2.1% |
| 43 | Estherville | 5,839 | 117 | 2.0% |
| 44 | Charles City | 7,232 | 141 | 1.9% |
| 45 | Iowa Falls | 5,038 | 91 | 1.8% |
| 46 | Atlantic | 6,763 | 118 | 1.7% |
| 47 | Oskaloosa | 11,504 | 195 | 1.7% |
| 48 | Grinnell | 9,505 | 148 | 1.6% |
| 49 | Denison | 8,260 | 123 | 1.5% |
| 50 | Newton | 15,700 | 228 | 1.5% |
| 51 | Winterset | 5,416 | 74 | 1.4% |
| 52 | Cedar Falls | 40,888 | 555 | 1.4% |
| 53 | Independence | 6,164 | 82 | 1.3% |
| 54 | Boone | 12,424 | 160 | 1.3% |
| 55 | Orange City | 6,426 | 77 | 1.2% |
| 56 | Webster City | 7,769 | 91 | 1.2% |
| 57 | Decorah | 7,535 | 81 | 1.1% |
| 58 | Centerville | 5,372 | 54 | 1.0% |
| 59 | Indianola | 16,044 | 160 | 1.0% |
| 60 | Eldridge | 6,818 | 64 | 0.9% |
| 61 | Creston | 7,435 | 68 | 0.9% |
| 62 | Carroll | 10,208 | 80 | 0.8% |
| 63 | Perry | 7,985 | 56 | 0.7% |
| 64 | Washington | 7,290 | 51 | 0.7% |
| 65 | Sioux Center | 8,454 | 53 | 0.6% |
| 66 | Nevada | 6,983 | 35 | 0.5% |
| 67 | Pella | 10,720 | 41 | 0.4% |
| 68 | Spencer | 11,400 | 40 | 0.4% |
| 69 | Cherokee | 5,154 | 18 | 0.3% |
| 70 | Knoxville | 7,473 | 20 | 0.3% |
| 71 | Clear Lake | 7,607 | 18 | 0.2% |
| 72 | Algona | 5,377 | 12 | 0.2% |
| 73 | Manchester | 5,191 | 11 | 0.2% |
| 74 | Glenwood | 5,144 | 8 | 0.2% |
| 75 | Oelwein | 5,834 | 7 | 0.1% |
| 76 | Norwalk | 14,183 | 9 | 0.1% |
Source: U.S. Census ACS 2020-2024. 76 cities with more than 5,000 residents.
Summary
Summary: Black Populations Across Iowa
If you’re looking for a breakdown of African American populations across Iowa according to the most recent data, this is an accurate list.
The blackest cities in Iowa are Waterloo, Coralville, Des Moines, Davenport, Johnston, Iowa City, Cedar Rapids, Hiawatha, Burlington, and Grimes. Not sold on Iowa? Take the two-minute Find Your Place quiz and see which state actually fits you.


