Most African American cities in Oregon research summary. We used Saturday Night Science to analyze Oregon’s most recent Census data to determine the cities with the largest Black population, based on the percentage of Black residents.
The city with the largest African American population in Oregon is Fairview (11.4% Black); the least is Milton-Freewater (0.0%). Statewide, Oregon is 1.8% Black — the 41st blackest state in the country.
Roughly 42 million people identifying as Black or African American live in the United States, about 12% of the total population. In Oregon, the Black population is 77,886, at 1.8% of the state total.
We broke down the most recent Census data to determine the cities in Oregon with the largest African American population in 2026.
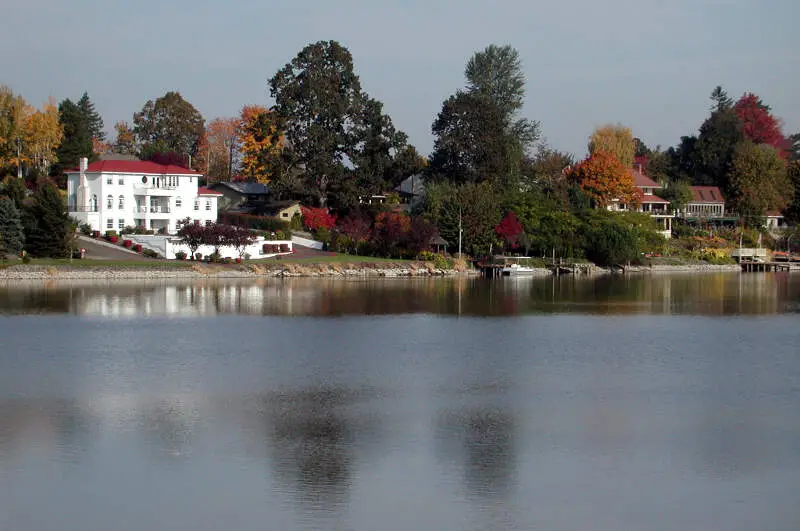
#1 most African American in Oregon
Fairview is a city in Multnomah County, Oregon, United States. As of the 2010 census, the city population was 8,920.
Data | Crime | Cost of living | Movers
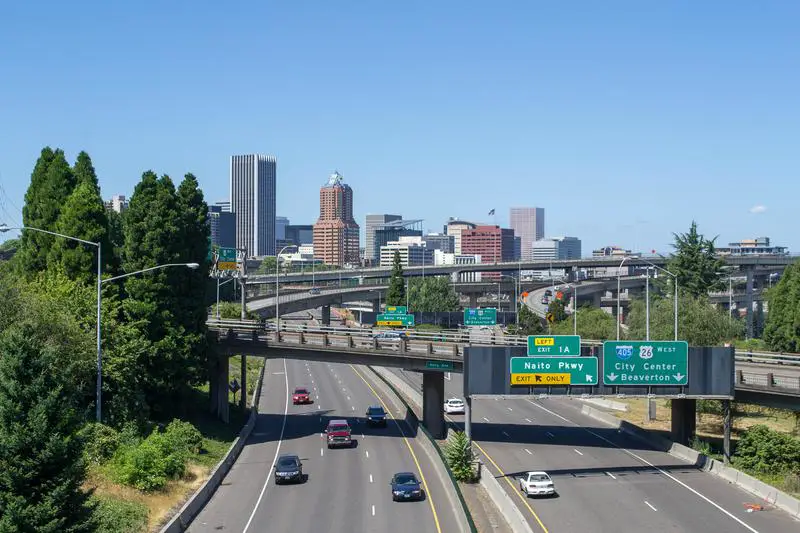
#2 most African American in Oregon
Portland is the largest city in the U.S. state of Oregon and the seat of Multnomah County. It is a major port in the Willamette Valley region of the Pacific Northwest, at the confluence of the Willamette and Columbia rivers. The city covers 145 square miles and had an estimated population of 639,863 in 2016, making it the 26th most populous city in the United States, and the second-most populous in the Pacific Northwest. Approximately 2,424,955 people live in the Portland metropolitan statistical area, making it the 25th most populous MSA in the United States. Its Combined Statistical Area ranks 18th with a population of 3,160,488. Roughly 60% of Oregon’s population resides within the Portland metropolitan area.
Data | Crime | Cost of living | Movers | Compare
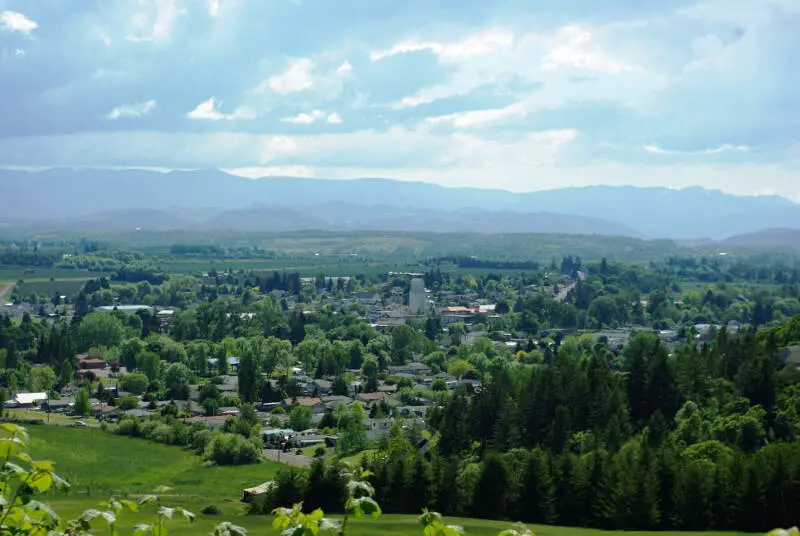
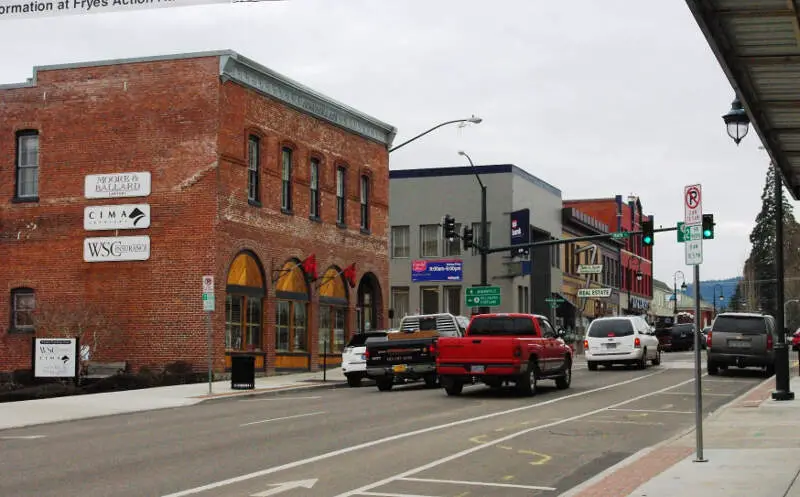
#3 most African American in Oregon
Sheridan is a city in Yamhill County, Oregon, United States. Platted in the 1860s when it received a post office, the city was incorporated in 1880. A major fire burned much of the city in 1913, and a flood covered much of the city in 1964. The population of the city as of the 2010 Census was 6,127, an increase from 3,570 at the 2000 census. However, the 2000 Census count failed to include those incarcerated at the federal prison in the city, while the newer count did include those inmates.
Data | Crime | Cost of living | Movers
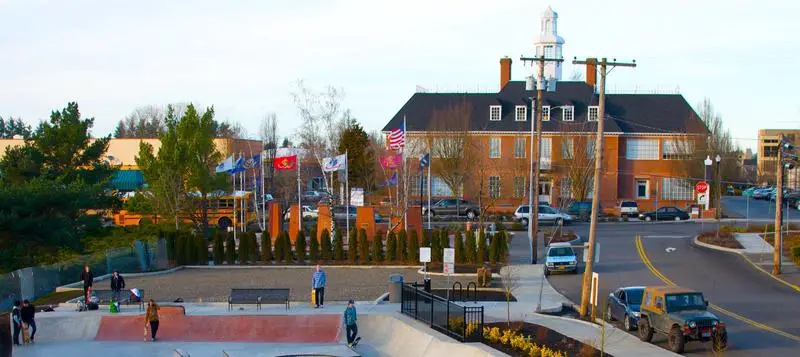
#4 most African American in Oregon
Gresham is a city located in Multnomah County, Oregon, in the United States, immediately east of Portland. Though it began as a settlement in the mid-1800s, it was not officially incorporated as a city until 1905; it was named after Walter Quinton Gresham, the American Civil War general and United States Postmaster General.
Data | Crime | Cost of living | Movers
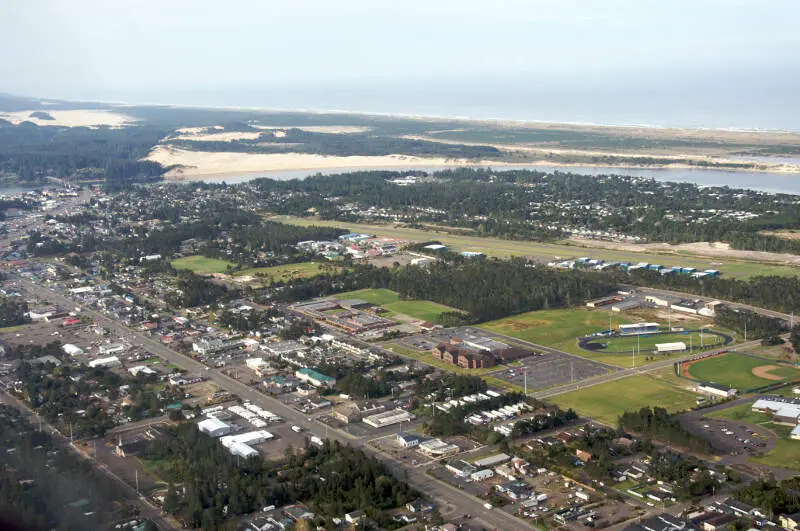
#5 most African American in Oregon
Florence is a coastal city in Lane County, in the U.S. state of Oregon. It lies at the mouth of the Siuslaw River on the Pacific Ocean and about midway between Newport and Coos Bay along U.S. Route 101. As of the 2010 census, the city had a total population of 8,466.
Data | Crime | Cost of living | Movers
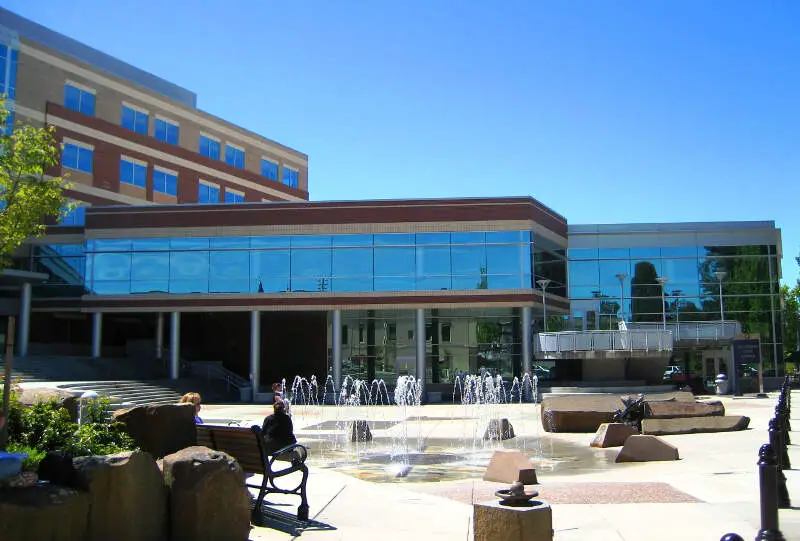
#6 most African American in Oregon
Hillsboro is the fifth-largest city in the State of Oregon and is the county seat of Washington County. Lying in the Tualatin Valley on the west side of the Portland metropolitan area, the city hosts many high-technology companies, such as Intel, that comprise what has become known as the Silicon Forest. At the 2010 Census, the city’s population was 91,611.
Data | Crime | Cost of living | Movers
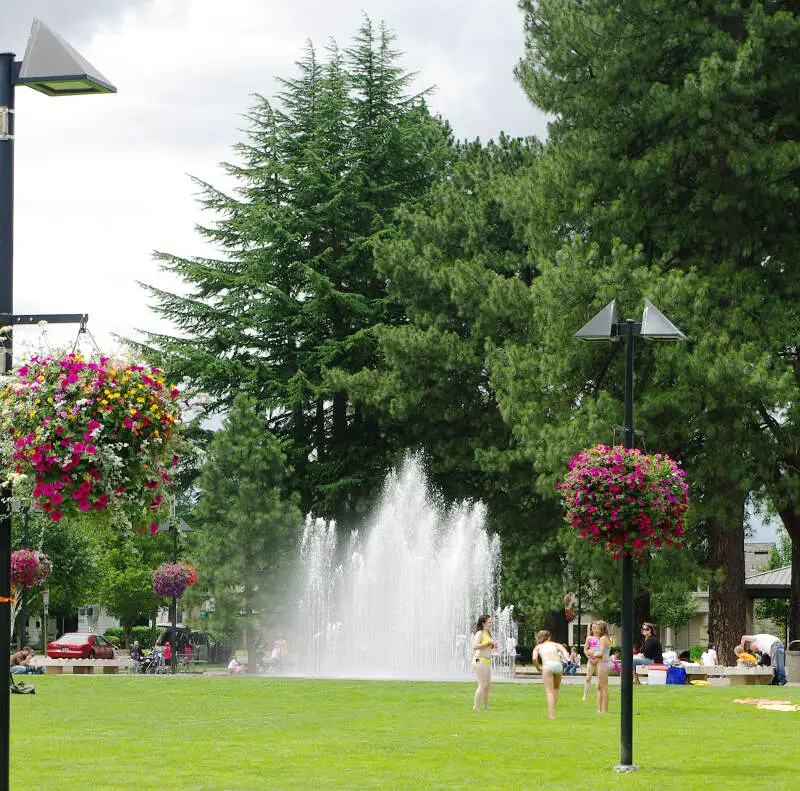
#7 most African American in Oregon
Beaverton is a city in Washington County, in the U.S. state of Oregon. The city center is 7 miles west of downtown Portland in the Tualatin River Valley. As of the 2010 census, the population is 89,803. This makes it the second-largest city in the county and Oregon’s sixth-largest city. Fire protection and EMS services are provided through Tualatin Valley Fire and Rescue.
Data | Crime | Cost of living | Movers
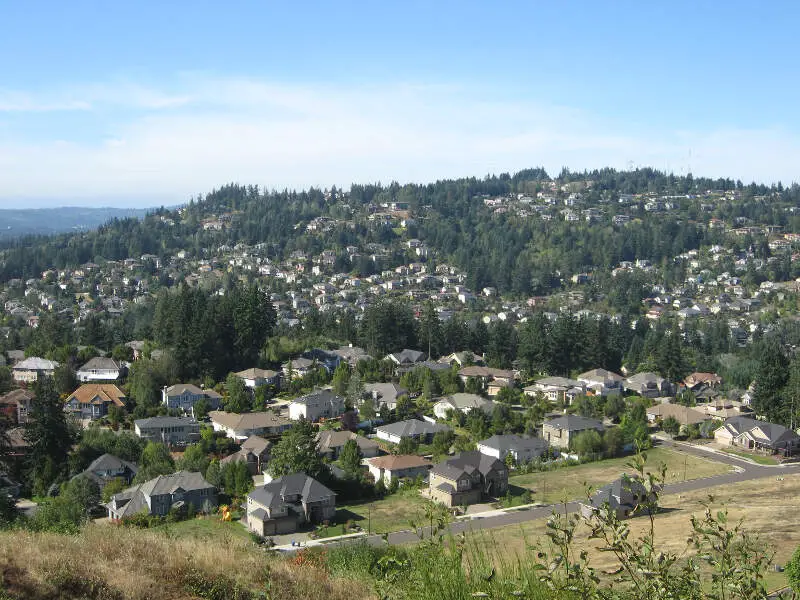
#8 most African American in Oregon
Happy Valley is a city in Clackamas County, Oregon, United States. The population was 13,903 at the 2010 census.
Data | Crime | Cost of living | Movers
#9 most African American in Oregon
Troutdale is a city in Multnomah County, Oregon, U.S.A., north of Gresham and east of Wood Village. As of the 2010 census, the city population was 15,962. The city serves as the western gateway to the Historic Columbia River Highway, the Mount Hood Scenic Byway, and the Columbia River Gorge.
Data | Crime | Cost of living | Movers
#10 most African American in Oregon
Forest Grove is a city in Washington County, Oregon, United States, 25 miles west of Portland. Originally a small farm town, it is now primarily a bedroom suburb of Portland. Settled in the 1840s, the town was platted in 1850, then incorporated in 1872, making it the first city in Washington County. The population was 21,083 at the 2010 census, an increase of 19.1% over the 2000 figure.
Data | Crime | Cost of living | Movers
The receipts
Compare the top ten
Pick a metric. The bars rescale. The red line is Oregon’s statewide median.
On the map
Where Oregon’s Black communities live
Saturday Night Science
Methodology: How We Determined The Cities In Oregon With The Largest Black Population For 2026
We still believe in the accuracy of data — especially from the Census. So that’s where we went to get the race breakdown across Oregon.
That leads us to the Census’s most recently available data, the 2020-2024 American Community Survey data from the US Census.
Specifically, we looked at table B03002: Hispanic OR LATINO ORIGIN BY RACE. Here are the category names as defined by the Census:
- Hispanic or Latino
- White alone*
- Black or African American alone*
- American Indian and Alaska Native alone*
- Asian alone*
- Native Hawaiian and Other Pacific Islander alone*
- Some other race alone*
- Two or more races*
Our particular column of interest was the number of people who identified as Black or African American.
We limited our analysis to non-CDPs with a population greater than 5,000 people in Oregon. That left us with 73 cities.
We then calculated the percentage of residents that are Black or African American. The percentages ranked from 11.4% to 0.0%.
Finally, we ranked each city based on the percentage of the Black population, with a higher score being more Black than a lower score. Fairview took the distinction of being the most Black, while Milton-Freewater was the least African American city.
We updated this article for 2026. This is our eleventh time ranking the cities in Oregon with the largest African American population.
The full plate
African American Population By City In Oregon
Click any column to sort. Search by city name.
| Rank | City | Population | African American Population | % African American |
|---|---|---|---|---|
| 1 | Fairview | 10,735 | 1,223 | 11.4% |
| 2 | Portland | 641,165 | 35,307 | 5.5% |
| 3 | Sheridan | 6,339 | 301 | 4.7% |
| 4 | Gresham | 112,378 | 5,105 | 4.5% |
| 5 | Florence | 9,482 | 275 | 2.9% |
| 6 | Hillsboro | 108,231 | 3,126 | 2.9% |
| 7 | Beaverton | 97,812 | 2,454 | 2.5% |
| 8 | Happy Valley | 26,738 | 626 | 2.3% |
| 9 | Troutdale | 15,923 | 350 | 2.2% |
| 10 | Forest Grove | 26,529 | 582 | 2.2% |
| 11 | Milwaukie | 21,392 | 411 | 1.9% |
| 12 | Baker City | 10,210 | 180 | 1.8% |
| 13 | Silverton | 10,456 | 174 | 1.7% |
| 14 | Eugene | 179,591 | 2,869 | 1.6% |
| 15 | Corvallis | 59,960 | 933 | 1.6% |
| 16 | Salem | 178,865 | 2,781 | 1.6% |
| 17 | Umatilla | 7,508 | 113 | 1.5% |
| 18 | West Linn | 26,935 | 399 | 1.5% |
| 19 | Dallas | 17,531 | 254 | 1.4% |
| 20 | Tigard | 56,011 | 797 | 1.4% |
| 21 | Gladstone | 11,977 | 158 | 1.3% |
| 22 | Wilsonville | 26,974 | 355 | 1.3% |
| 23 | Cornelius | 14,255 | 185 | 1.3% |
| 24 | Prineville | 11,470 | 138 | 1.2% |
| 25 | Monmouth | 11,428 | 133 | 1.2% |
| 26 | Seaside | 7,192 | 77 | 1.1% |
| 27 | La Grande | 13,058 | 138 | 1.1% |
| 28 | Oregon City | 37,755 | 388 | 1.0% |
| 29 | Medford | 86,315 | 884 | 1.0% |
| 30 | Hermiston | 19,546 | 200 | 1.0% |
| 31 | Pendleton | 16,950 | 169 | 1.0% |
| 32 | Tualatin | 27,763 | 273 | 1.0% |
| 33 | Newport | 10,583 | 104 | 1.0% |
| 34 | Springfield | 61,499 | 572 | 0.9% |
| 35 | Keizer | 39,082 | 339 | 0.9% |
| 36 | North Bend | 10,171 | 84 | 0.8% |
| 37 | Sutherlin | 8,599 | 69 | 0.8% |
| 38 | Albany | 56,839 | 440 | 0.8% |
| 39 | Central Point | 19,216 | 147 | 0.8% |
| 40 | Newberg | 26,066 | 199 | 0.8% |
| 41 | Ontario | 11,842 | 86 | 0.7% |
| 42 | Hood River | 8,361 | 59 | 0.7% |
| 43 | Klamath Falls | 22,115 | 151 | 0.7% |
| 44 | Lake Oswego | 40,381 | 269 | 0.7% |
| 45 | Talent | 6,254 | 40 | 0.6% |
| 46 | Astoria | 10,109 | 63 | 0.6% |
| 47 | Independence | 10,199 | 57 | 0.6% |
| 48 | The Dalles | 15,917 | 87 | 0.5% |
| 49 | Coos Bay | 15,925 | 83 | 0.5% |
| 50 | McMinnville | 34,596 | 160 | 0.5% |
| 51 | Cottage Grove | 10,698 | 49 | 0.5% |
| 52 | Scappoose | 8,179 | 34 | 0.4% |
| 53 | Grants Pass | 39,311 | 161 | 0.4% |
| 54 | Sweet Home | 10,078 | 36 | 0.4% |
| 55 | Bend | 103,390 | 360 | 0.3% |
| 56 | Canby | 18,134 | 63 | 0.3% |
| 57 | Eagle Point | 9,839 | 31 | 0.3% |
| 58 | Junction City | 6,947 | 20 | 0.3% |
| 59 | Sherwood | 20,307 | 54 | 0.3% |
| 60 | Redmond | 36,092 | 89 | 0.2% |
| 61 | Woodburn | 27,875 | 60 | 0.2% |
| 62 | Roseburg | 23,778 | 49 | 0.2% |
| 63 | Stayton | 8,292 | 17 | 0.2% |
| 64 | Lincoln City | 9,968 | 13 | 0.1% |
| 65 | St. Helens | 14,258 | 14 | 0.1% |
| 66 | Lebanon | 19,344 | 17 | 0.1% |
| 67 | Ashland | 21,259 | 16 | 0.1% |
| 68 | Sandy | 12,854 | 4 | 0.0% |
| 69 | Brookings | 6,703 | 1 | 0.0% |
| 71 | Molalla | 10,186 | 0 | 0.0% |
| 71 | Madras | 7,676 | 0 | 0.0% |
| 71 | Winston | 5,690 | 0 | 0.0% |
| 71 | Milton-Freewater | 7,036 | 0 | 0.0% |
Source: U.S. Census ACS 2020-2024. 73 cities with more than 5,000 residents.
Summary
Summary: Black Populations Across Oregon
If you’re looking for a breakdown of African American populations across Oregon according to the most recent data, this is an accurate list.
The blackest cities in Oregon are Fairview, Portland, Sheridan, Gresham, Florence, Hillsboro, Beaverton, Happy Valley, Troutdale, and Forest Grove. Not sold on Oregon? Take the two-minute Find Your Place quiz and see which state actually fits you.


