Racial diversity in Illinois is a mixed bag.
There are parts of Illinois where there’s a high level of diversity. But where will you find the most diverse places in Illinois?
To answer that question, we went to the US Census data. Using Saturday Night Science, we measured the Gini coefficient for all 330 cities in Illinois to rank them from most to least diverse.
#1 most diverse in Illinois
Data | Crime | Cost of living | Movers
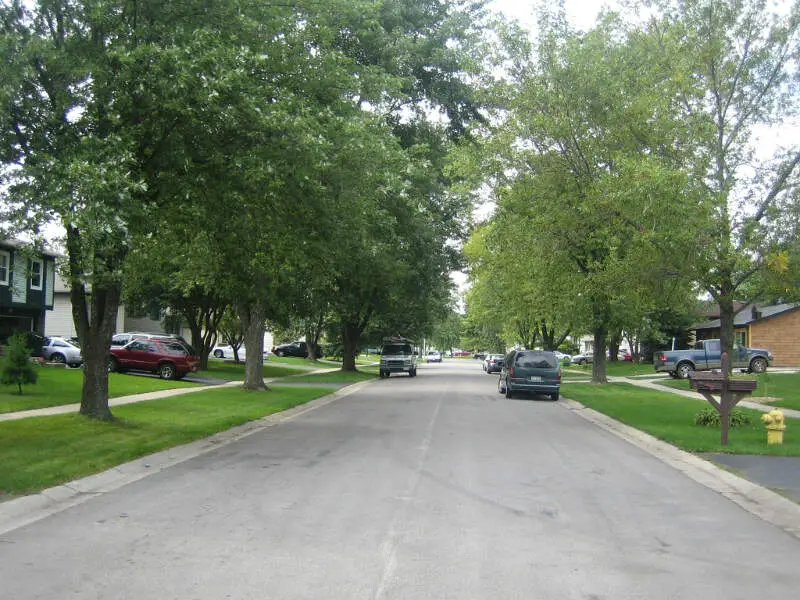
#2 most diverse in Illinois
Glendale Heights is a village in DuPage County, Illinois, United States. The population was 34,208 at the 2010 census. It is best known nationally as the hometown of Smashing Pumpkins founder Billy Corgan, but known more locally for its ethnically diverse population. The town elected Dupage County’s first Asian mayor in 1995.
Data | Crime | Cost of living | Movers
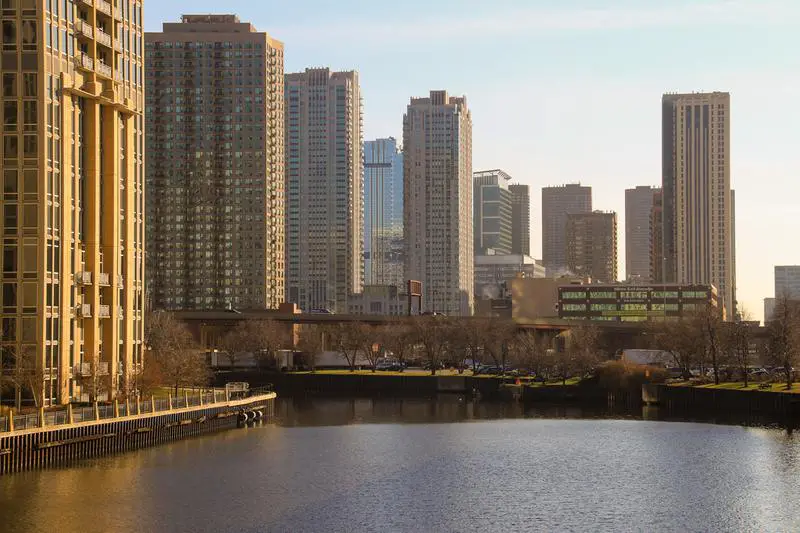
#3 most diverse in Illinois
Chicago or ), officially the City of Chicago, is the third-most populous city in the United States. With over 2.7million residents, it is also the most populous city in both the state of Illinois and the Midwestern United States. It is the county seat of Cook County. The Chicago metropolitan area, often referred to as Chicagoland, has nearly 10million people and is the third-largest in the United States. Chicago has often been called a global architecture capital and is considered one of the most important business centers in the world.
Data | Crime | Cost of living | Movers
#4 most diverse in Illinois
North Chicago is a city in Lake County, Illinois, United States, and a suburb of the Chicago metropolitan area. The population was 32,574 at the 2010 census.
Data | Crime | Cost of living | Movers
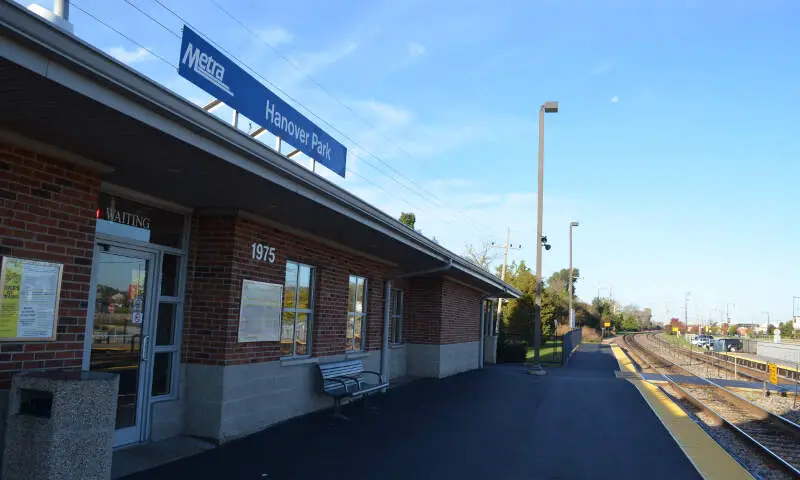
#5 most diverse in Illinois
Data | Crime | Cost of living | Movers
#6 most diverse in Illinois
Data | Crime | Cost of living | Movers
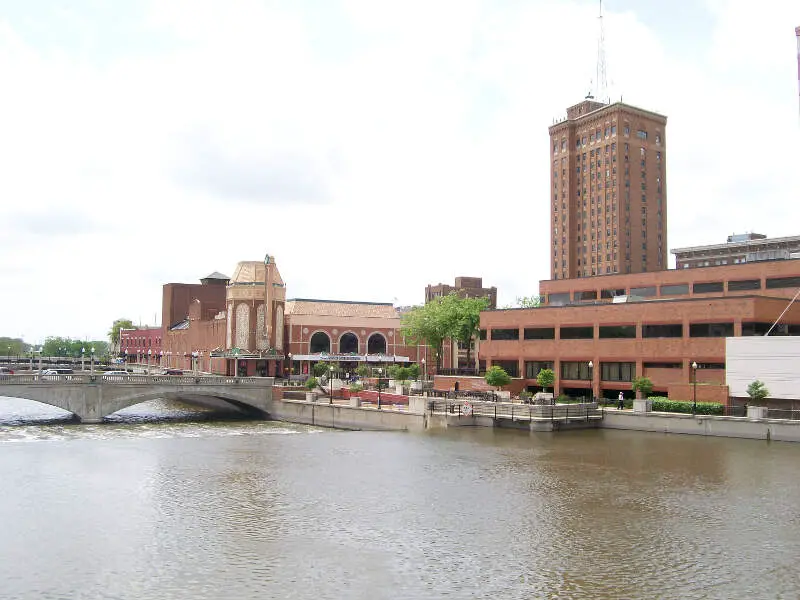
#7 most diverse in Illinois
Aurora, a suburb of Chicago, is a city predominantly in Kane County and DuPage County, with portions extending into Kendall and Will counties. It is in the outer region of Chicago metropolitan area in the U.S. state of Illinois. It is the second most populous city in the state, and the 114th most populous city in the country. The population was 197,899 at the 2010 census, and was estimated to have increased to 199,963 by July 2013.
Data | Crime | Cost of living | Movers
#8 most diverse in Illinois
Data | Crime | Cost of living | Movers
#9 most diverse in Illinois
Data | Crime | Cost of living | Movers
#10 most diverse in Illinois
Kankakee is a city in and the county seat of Kankakee County, Illinois, United States. The city’s name is probably derived from the Miami-Illinois word teeyaahkiki, meaning: “Open countryland in open/land exposed to view,” in reference to the area’s prior status as a marsh. As of the 2010 census, the city population was 27,537. Kankakee is a principal city of the Kankakee-Bourbonnais-Bradley Metropolitan Statistical Area
Data | Crime | Cost of living | Movers
The receipts
Compare the top ten
Pick a metric. The bars rescale. The red line is Illinois’s statewide median.
On the map
Where diversity lives in Illinois
Saturday Night Science
Methodology: How we determined the most diverse cities in Illinois for 2026
We still believe in the accuracy of data — especially from the Census — and Saturday Night Science. So that’s where we went to get the race breakdown across Illinois.
That leads us to the Census’s most recently available data, the 2020-2024 American Community Survey data from the US Census.
Specifically, we looked at table B03002: HISPANIC OR LATINO ORIGIN BY RACE. Here are the category names as defined by the Census:
- White alone*
- Black or African American alone*
- American Indian and Alaska Native alone*
- Asian alone*
- Native Hawaiian and Other Pacific Islander alone*
- Some other race alone*
- Two or more races*
- Hispanic or Latino
We limited our analysis to non-CDPs with a population greater than 5,000 people. That left us with 330 cities.
We then calculated the HHI for each city by finding the racial breakdown of a city in percent terms, squaring them, and then adding the squares together. This left us with scores ranging from 2,578 (Bolingbrook) to 9,436 (Litchfield).
Finally, we ranked each city based on the HHI, with a lower score being more diverse than a high score. Bolingbrook took the distinction of being the most diverse, while Litchfield was the least diverse city.
We updated this article for 2026. This report is our eleventh time ranking the most diverse places in Illinois.
The full plate
Race By City In Illinois For 2026
Click any column to sort. Search by city name.
| Rank | City | Population | HHI | % White | % Black | % Hispanic | % Asian |
|---|---|---|---|---|---|---|---|
| 1 | Bolingbrook | 74,096 | 2,578 | 34.8% | 17.7% | 28.9% | 14.1% |
| 2 | Glendale Heights | 32,808 | 2,632 | 27.8% | 10.0% | 33.2% | 25.5% |
| 3 | Chicago | 2,711,226 | 2,726 | 32.1% | 27.4% | 29.7% | 7.2% |
| 4 | North Chicago | 30,643 | 2,883 | 25.1% | 23.7% | 40.5% | 6.1% |
| 5 | Hanover Park | 36,732 | 2,953 | 30.2% | 7.2% | 40.5% | 18.5% |
| 6 | Alsip | 18,583 | 3,030 | 40.0% | 24.3% | 28.6% | 2.3% |
| 7 | Aurora | 179,898 | 3,038 | 32.2% | 10.7% | 41.6% | 12.2% |
| 8 | Zion | 24,600 | 3,084 | 24.5% | 23.1% | 43.7% | 2.9% |
| 9 | Romeoville | 41,152 | 3,162 | 40.5% | 14.3% | 35.7% | 6.1% |
| 10 | Kankakee | 23,996 | 3,179 | 31.3% | 39.8% | 24.5% | 0.9% |
| 11 | Streamwood | 39,001 | 3,202 | 36.1% | 5.1% | 40.7% | 14.5% |
| 12 | Skokie | 66,219 | 3,247 | 48.6% | 10.0% | 11.0% | 25.4% |
| 13 | Hoffman Estates | 51,175 | 3,263 | 47.9% | 5.5% | 17.0% | 25.1% |
| 14 | Carol Stream | 39,460 | 3,291 | 50.1% | 6.3% | 18.5% | 19.3% |
| 15 | Rockford | 147,521 | 3,335 | 49.6% | 19.2% | 21.6% | 3.7% |
| 16 | Chicago Heights | 26,736 | 3,340 | 21.4% | 40.3% | 35.5% | 0.3% |
| 17 | Joliet | 150,445 | 3,379 | 44.0% | 16.0% | 34.2% | 2.4% |
| 18 | Forest Park | 13,943 | 3,416 | 51.0% | 24.0% | 12.4% | 8.8% |
| 19 | Round Lake | 18,628 | 3,428 | 44.5% | 3.7% | 35.8% | 12.1% |
| 20 | Evergreen Park | 19,420 | 3,457 | 49.8% | 25.5% | 17.6% | 2.5% |
| 21 | Wheeling | 38,433 | 3,461 | 49.1% | 3.8% | 28.1% | 15.3% |
| 22 | Westchester | 16,436 | 3,463 | 48.4% | 20.0% | 26.6% | 3.8% |
| 23 | Urbana | 39,341 | 3,469 | 52.9% | 18.7% | 10.1% | 14.2% |
| 24 | Steger | 9,418 | 3,491 | 50.7% | 22.4% | 19.7% | 1.4% |
| 25 | Rantoul | 12,421 | 3,513 | 52.0% | 17.9% | 20.1% | 0.8% |
| 26 | Fairview Heights | 16,745 | 3,522 | 51.0% | 27.6% | 6.9% | 4.0% |
| 27 | Beach Park | 14,115 | 3,530 | 32.8% | 10.9% | 47.8% | 7.2% |
| 27 | Crest Hill | 20,628 | 3,531 | 50.5% | 15.0% | 27.0% | 2.4% |
| 29 | Blue Island | 21,741 | 3,534 | 18.0% | 30.7% | 47.5% | 0.6% |
| 29 | Midlothian | 13,948 | 3,533 | 46.0% | 9.3% | 36.0% | 2.9% |
| 31 | Berkeley | 5,199 | 3,559 | 21.3% | 26.2% | 49.1% | 2.6% |
| 32 | East Moline | 20,904 | 3,575 | 52.9% | 20.6% | 17.5% | 2.9% |
| 33 | Champaign | 89,996 | 3,594 | 54.5% | 17.2% | 7.9% | 15.8% |
| 34 | Lansing | 28,284 | 3,607 | 25.2% | 51.4% | 17.9% | 2.2% |
| 35 | Peoria | 112,169 | 3,626 | 53.2% | 25.6% | 8.0% | 6.6% |
| 36 | Chicago Ridge | 14,099 | 3,642 | 54.4% | 9.4% | 21.0% | 3.1% |
| 37 | Schaumburg | 76,868 | 3,656 | 53.7% | 5.7% | 12.7% | 23.8% |
| 38 | West Chicago | 25,395 | 3,656 | 35.3% | 3.0% | 47.8% | 10.3% |
| 39 | Rolling Meadows | 24,027 | 3,665 | 50.9% | 2.6% | 29.2% | 14.3% |
| 40 | Mundelein | 31,915 | 3,674 | 48.5% | 3.1% | 34.6% | 10.1% |
| 40 | Elgin | 114,934 | 3,673 | 34.9% | 5.2% | 48.7% | 6.6% |
| 42 | Hillside | 8,084 | 3,754 | 15.7% | 48.5% | 34.0% | 0.6% |
| 43 | Carbondale | 22,158 | 3,754 | 54.2% | 26.3% | 7.1% | 7.3% |
| 43 | Woodridge | 33,941 | 3,755 | 56.8% | 10.5% | 16.0% | 12.1% |
| 45 | Des Plaines | 59,156 | 3,779 | 54.8% | 3.7% | 23.1% | 14.9% |
| 46 | Pingree Grove | 10,914 | 3,794 | 57.1% | 12.3% | 17.6% | 6.5% |
| 47 | DeKalb | 40,443 | 3,807 | 56.4% | 13.8% | 19.9% | 4.0% |
| 48 | Justice | 12,324 | 3,824 | 56.3% | 17.1% | 18.0% | 5.1% |
| 49 | Crete | 8,386 | 3,826 | 47.2% | 38.9% | 7.6% | 1.0% |
| 50 | Evanston | 76,340 | 3,842 | 58.0% | 14.2% | 12.3% | 9.4% |
| 51 | Addison | 35,489 | 3,868 | 40.8% | 3.2% | 46.0% | 8.6% |
| 52 | Homewood | 19,294 | 3,875 | 44.3% | 43.1% | 6.4% | 1.4% |
| 53 | South Elgin | 24,217 | 3,877 | 57.4% | 4.7% | 20.3% | 10.9% |
| 54 | Gurnee | 30,510 | 3,911 | 58.2% | 7.7% | 17.0% | 12.9% |
| 55 | Morton Grove | 24,619 | 3,917 | 53.0% | 2.0% | 8.0% | 32.0% |
| 56 | Beardstown | 6,169 | 3,936 | 47.4% | 7.4% | 40.3% | 1.8% |
| 57 | Monee | 5,108 | 3,937 | 50.5% | 35.7% | 10.3% | 0.8% |
| 58 | Waukegan | 89,076 | 3,943 | 16.7% | 16.6% | 57.9% | 5.4% |
| 59 | Montgomery | 21,515 | 4,004 | 53.8% | 7.9% | 32.1% | 2.1% |
| 60 | Bensenville | 18,603 | 4,046 | 40.6% | 6.3% | 48.5% | 2.9% |
| 61 | Vernon Hills | 26,876 | 4,103 | 57.9% | 1.9% | 11.5% | 24.6% |
| 62 | Lincolnwood | 13,112 | 4,107 | 57.2% | 4.3% | 7.4% | 27.3% |
| 63 | Bartlett | 40,501 | 4,120 | 59.0% | 4.1% | 15.0% | 19.7% |
| 64 | Danville | 28,595 | 4,191 | 54.4% | 34.2% | 7.6% | 1.3% |
| 65 | Broadview | 7,896 | 4,212 | 9.3% | 59.5% | 23.6% | 1.9% |
| 66 | Crestwood | 10,579 | 4,233 | 61.0% | 16.3% | 13.4% | 1.1% |
| 67 | Palatine | 66,293 | 4,235 | 60.7% | 4.5% | 19.2% | 12.5% |
| 68 | Oak Park | 53,292 | 4,246 | 61.5% | 17.8% | 9.3% | 5.1% |
| 69 | Carpentersville | 37,346 | 4,248 | 30.0% | 4.9% | 57.4% | 4.1% |
| 70 | Bridgeview | 16,849 | 4,249 | 55.4% | 4.8% | 33.7% | 4.8% |
| 71 | Westmont | 23,724 | 4,271 | 61.7% | 5.9% | 14.2% | 14.6% |
| 72 | North Riverside | 7,249 | 4,276 | 56.6% | 8.5% | 31.5% | 1.7% |
| 73 | Mount Prospect | 55,472 | 4,302 | 61.0% | 2.5% | 18.1% | 15.4% |
| 74 | Naperville | 150,692 | 4,314 | 61.0% | 4.3% | 7.6% | 22.3% |
| 75 | Sauk Village | 9,678 | 4,316 | 14.2% | 61.9% | 14.7% | 0.0% |
| 76 | Buffalo Grove | 42,891 | 4,319 | 58.2% | 3.4% | 5.8% | 29.7% |
| 77 | Belleville | 41,370 | 4,322 | 56.7% | 32.5% | 2.9% | 1.0% |
| 78 | Burbank | 28,739 | 4,354 | 41.6% | 1.9% | 51.1% | 3.2% |
| 79 | Rock Island | 36,151 | 4,362 | 62.5% | 15.6% | 13.3% | 3.8% |
| 80 | Oswego | 36,375 | 4,365 | 62.4% | 10.1% | 17.9% | 4.4% |
| 81 | Round Lake Beach | 27,079 | 4,367 | 34.5% | 4.2% | 56.1% | 2.2% |
| 82 | Shiloh | 14,572 | 4,367 | 60.9% | 24.4% | 4.9% | 3.3% |
| 83 | Moline | 42,197 | 4,381 | 62.1% | 10.5% | 19.8% | 3.2% |
| 84 | River Grove | 10,451 | 4,389 | 52.5% | 2.1% | 40.0% | 4.7% |
| 85 | Round Lake Park | 7,919 | 4,404 | 43.9% | 0.8% | 49.5% | 0.8% |
| 86 | Plano | 12,203 | 4,409 | 52.9% | 1.3% | 39.8% | 0.8% |
| 87 | Harvey | 20,230 | 4,412 | 2.4% | 53.6% | 39.1% | 2.2% |
| 88 | Maywood | 23,201 | 4,419 | 4.5% | 55.1% | 36.9% | 1.3% |
| 89 | Niles | 30,064 | 4,468 | 62.2% | 2.3% | 13.3% | 20.3% |
| 90 | Savoy | 8,968 | 4,478 | 62.9% | 7.1% | 6.9% | 20.3% |
| 91 | Flossmoor | 9,391 | 4,489 | 30.1% | 59.5% | 4.9% | 1.6% |
| 92 | Warrenville | 14,718 | 4,496 | 61.4% | 4.7% | 25.6% | 6.5% |
| 93 | Wood Dale | 13,933 | 4,538 | 59.1% | 2.7% | 31.8% | 5.1% |
| 94 | South Barrington | 5,021 | 4,557 | 48.4% | 0.8% | 0.4% | 46.9% |
| 95 | Lyons | 10,339 | 4,569 | 45.0% | 1.5% | 50.3% | 2.3% |
| 96 | Highwood | 5,301 | 4,610 | 57.1% | 1.2% | 36.6% | 2.1% |
| 97 | Oak Brook | 8,056 | 4,621 | 59.3% | 0.3% | 5.7% | 32.7% |
| 98 | Berwyn | 55,595 | 4,633 | 24.9% | 7.4% | 62.8% | 3.8% |
| 99 | Oak Lawn | 56,861 | 4,636 | 63.1% | 8.6% | 24.0% | 1.7% |
| 100 | Oak Forest | 26,805 | 4,640 | 64.8% | 7.8% | 18.4% | 5.8% |
Source: U.S. Census ACS 2020-2024. 330 cities with more than 5,000 residents.
Summary
Summary: Diversity Across Illinois
If you’re looking for a scientific breakdown of diversity across Illinois, this is an accurate list.
The most diverse cities in Illinois are Bolingbrook, Glendale Heights, Chicago, North Chicago, Hanover Park, Alsip, Aurora, Zion, Romeoville, and Kankakee.


