Racial diversity in Iowa is a mixed bag.
There are parts of Iowa where there’s a high level of diversity. But where will you find the most diverse places in Iowa?
To answer that question, we went to the US Census data. Using Saturday Night Science, we measured the Gini coefficient for all 85 cities in Iowa to rank them from most to least diverse.
#1 most diverse in Iowa
Storm Lake is a city in Buena Vista County, Iowa, United States. The population was 10,600 in the 2010 census, an increase from 10,076 in the 2000 census. It is the county seat of Buena Vista County. Storm Lake is home to Buena Vista University, originally Buena Vista College. Tyson Foods operates a large hog slaughterhouse, meat packing plant, and turkey processing plant in Storm Lake.
Data | Crime | Cost of living | Movers
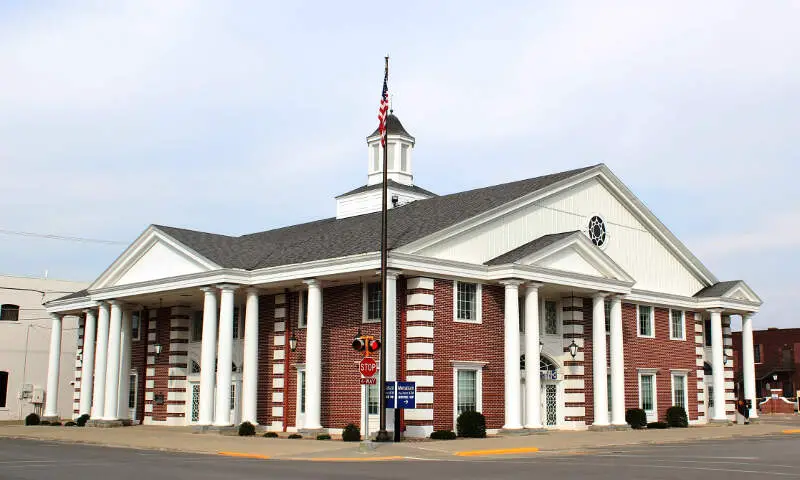
#2 most diverse in Iowa
Marshalltown is a city in, and the county seat of, Marshall County, Iowa, United States. The population was 27,552 in the 2010 census, compared to 26,009 in 2000.
Data | Crime | Cost of living | Movers
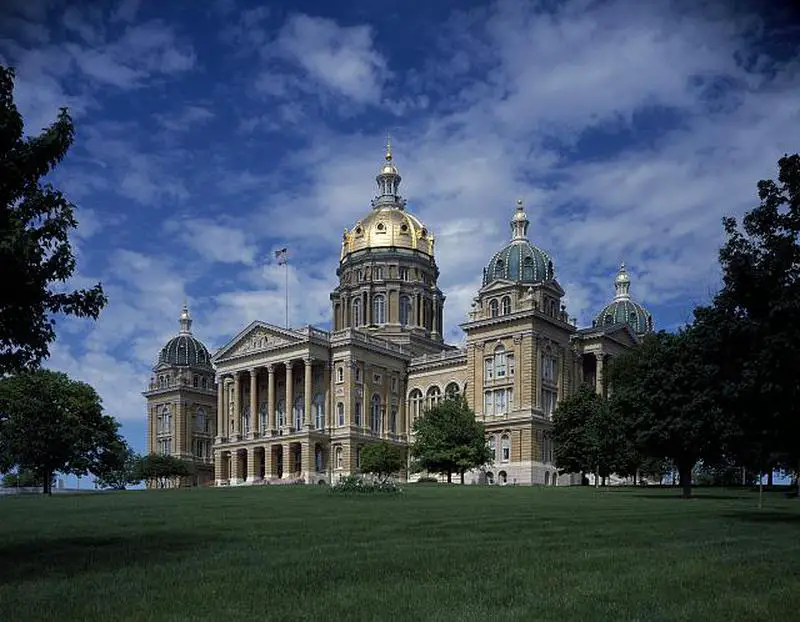
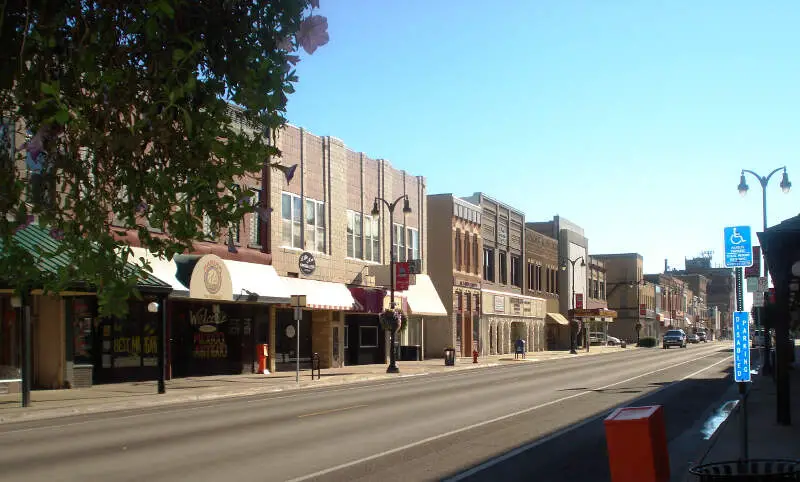
#3 most diverse in Iowa
Des Moines is the capital and the most populous city in the U.S. state of Iowa. It is also the county seat of Polk County. A small part of the city extends into Warren County. It was incorporated on September 22, 1851, as Fort Des Moines, which was shortened to “Des Moines” in 1857. It is on and named after the Des Moines River, which likely was adapted from the French colonial name, Rivire des Moines, meaning “River of the Monks”. The city’s population was 203,433 as of the 2010 census. The five-county metropolitan area is ranked 89th in terms of population in the United States with 634,725 residents according to the 2016 estimate by the United States Census Bureau.
Data | Crime | Cost of living | Movers
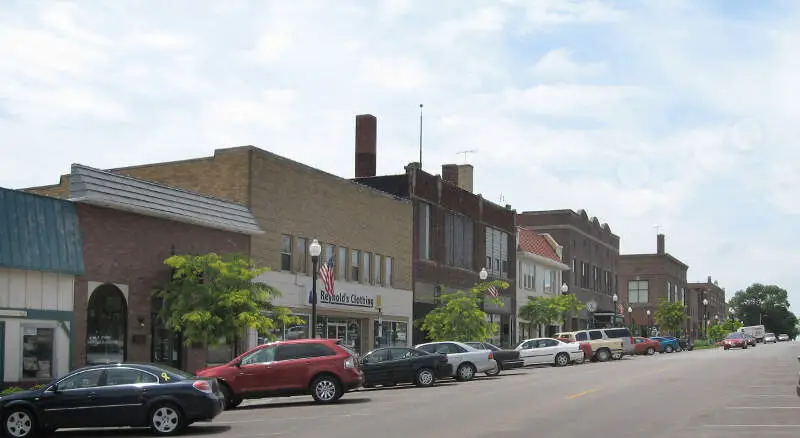
#4 most diverse in Iowa
Denison is a city in Crawford County, Iowa, United States, along the Boyer River. The population was 8,298 at the 2010 census. It is the county seat of Crawford County.
Data | Crime | Cost of living | Movers
#5 most diverse in Iowa
Sioux City is a city in Woodbury and Plymouth counties in the northwestern part of the U.S. state of Iowa. The population was 82,684 in the 2010 census, which makes it the fourth largest city in Iowa. The bulk of the city is in Woodbury County, of which it is the county seat, though a small portion is in Plymouth County. Sioux City is located at the navigational head of the Missouri River. Often the city and surrounding area is referred to as Siouxland, especially by the local media and residents. The city is home to several cultural points of interest including the Sioux City Public Museum, Sioux City Art Center and Sergeant Floyd Monument, which is a National Historical Landmark. The city is also home to Chris Larsen Park, commonly referred to as -the Riverfront,- includes the Anderson Dance Pavilion, Sergeant Floyd Riverboat Museum and Lewis and Clark Interpretive Center. Sioux City is the primary city of the five-county Sioux City, IA-NE-SD Metropolitan Statistical Area, with a population of 168,825 in 2010 and a slight increase to an estimated 168,921 in 2012. The Sioux City-Vermillion, IA-NE-SD Combined Statistical Area had a population of 182,675 as of 2010 and has grown to an estimated population of 183,052 as of 2012.
Data | Crime | Cost of living | Movers
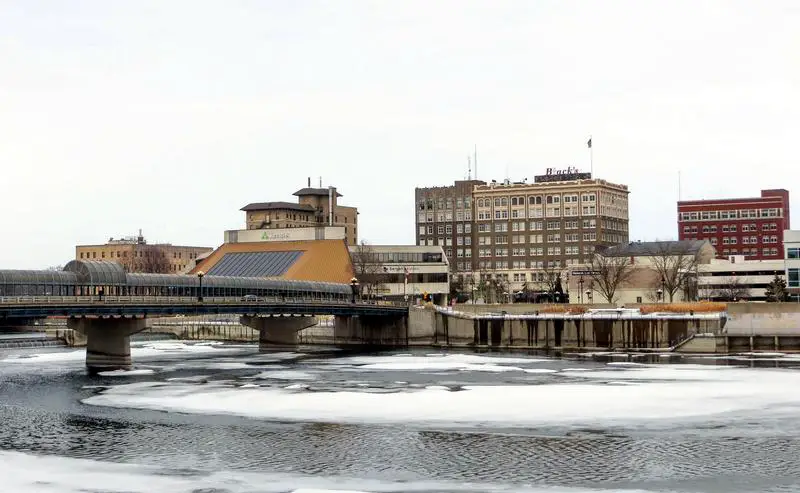
#6 most diverse in Iowa
Waterloo is a city in and the county seat of Black Hawk County, Iowa, United States. As of the 2010 United States Census the population decreased by 0.5% to 68,406; the 2014 Census estimates the population at 68,364, making it the sixth-largest city in the state. The city is part of the Waterloo – Cedar Falls Metropolitan Statistical Area, and is the more populous of the two cities.
Data | Crime | Cost of living | Movers
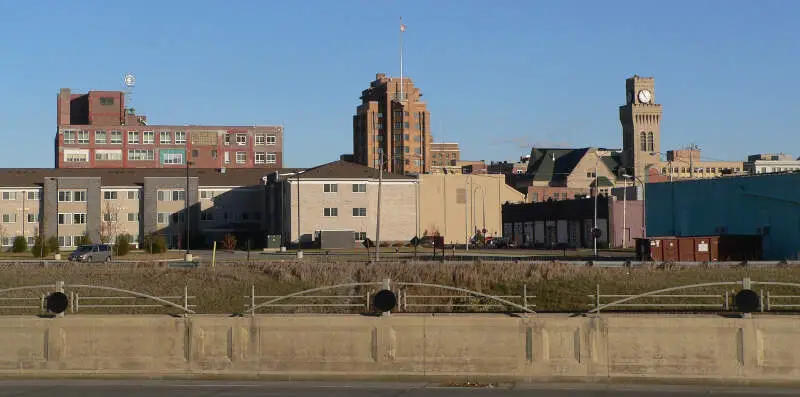
#7 most diverse in Iowa
Coralville is a city in Johnson County, Iowa, United States. It is a suburb of Iowa City and part of the Iowa City Metropolitan Statistical Area. The population was 18,907 at the 2010 census.
Data | Crime | Cost of living | Movers
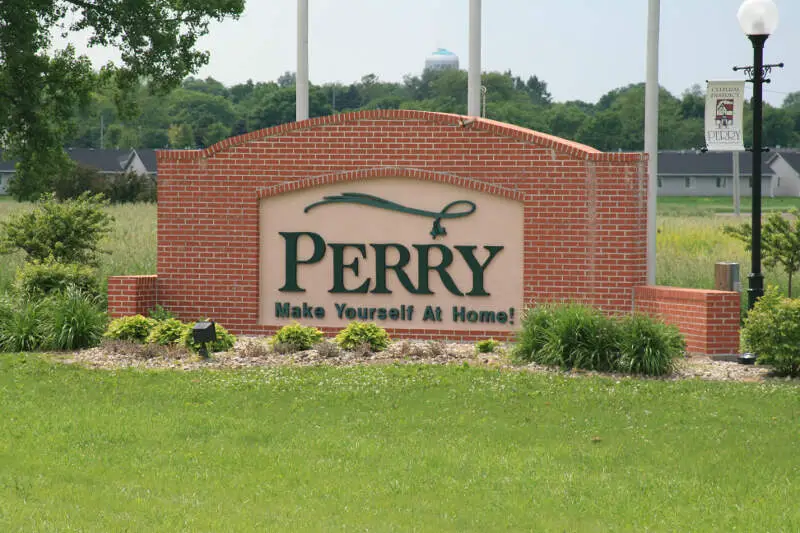
#8 most diverse in Iowa
Perry is a city in Dallas County, Iowa, United States, along the North Raccoon River. The population was 7,702 at the 2010 Census. It is part of the Des Moines-West Des Moines Metropolitan Statistical Area.
Data | Crime | Cost of living | Movers
#9 most diverse in Iowa
Ottumwa is a city in and the county seat of Wapello County, Iowa, United States. The population was 25,023 at the 2010 census. Located in southeastern Iowa, the city is split into northern and southern halves by the Des Moines River.
Data | Crime | Cost of living | Movers
#10 most diverse in Iowa
Data | Crime | Cost of living | Movers
The receipts
Compare the top ten
Pick a metric. The bars rescale. The red line is Iowa’s statewide median.
On the map
Where diversity lives in Iowa
Saturday Night Science
Methodology: How we determined the most diverse cities in Iowa for 2026
We still believe in the accuracy of data — especially from the Census — and Saturday Night Science. So that’s where we went to get the race breakdown across Iowa.
That leads us to the Census’s most recently available data, the 2020-2024 American Community Survey data from the US Census.
Specifically, we looked at table B03002: HISPANIC OR LATINO ORIGIN BY RACE. Here are the category names as defined by the Census:
- White alone*
- Black or African American alone*
- American Indian and Alaska Native alone*
- Asian alone*
- Native Hawaiian and Other Pacific Islander alone*
- Some other race alone*
- Two or more races*
- Hispanic or Latino
We limited our analysis to non-CDPs with a population greater than 5,000 people. That left us with 85 cities.
We then calculated the HHI for each city by finding the racial breakdown of a city in percent terms, squaring them, and then adding the squares together. This left us with scores ranging from 3,182 (Storm Lake) to 9,263 (Polk City).
Finally, we ranked each city based on the HHI, with a lower score being more diverse than a high score. Storm Lake took the distinction of being the most diverse, while Polk City was the least diverse city.
We updated this article for 2026. This report is our eleventh time ranking the most diverse places in Iowa.
The full plate
Race By City In Iowa For 2026
Click any column to sort. Search by city name.
| Rank | City | Population | HHI | % White | % Black | % Hispanic | % Asian |
|---|---|---|---|---|---|---|---|
| 1 | Storm Lake | 11,428 | 3,182 | 33.1% | 3.8% | 43.5% | 12.7% |
| 2 | Marshalltown | 27,626 | 4,135 | 54.1% | 2.1% | 34.2% | 4.9% |
| 3 | Des Moines | 212,421 | 4,171 | 61.0% | 11.1% | 16.3% | 6.6% |
| 4 | Denison | 8,260 | 4,241 | 42.9% | 1.5% | 48.8% | 3.3% |
| 5 | Sioux City | 86,101 | 4,392 | 61.8% | 5.9% | 22.6% | 2.4% |
| 6 | Waterloo | 67,008 | 4,664 | 65.5% | 16.4% | 8.4% | 3.2% |
| 7 | Coralville | 23,234 | 4,760 | 66.7% | 13.4% | 5.4% | 8.5% |
| 8 | Perry | 7,985 | 5,006 | 61.6% | 0.7% | 34.7% | 0.4% |
| 9 | Ottumwa | 25,430 | 5,100 | 69.0% | 4.0% | 17.1% | 2.3% |
| 10 | Osceola | 5,523 | 5,162 | 66.5% | 0.1% | 26.3% | 0.5% |
| 11 | Iowa City | 75,752 | 5,179 | 70.4% | 9.4% | 8.1% | 7.1% |
| 12 | Hiawatha | 7,206 | 5,287 | 71.2% | 6.8% | 9.7% | 7.6% |
| 13 | Davenport | 100,913 | 5,309 | 71.2% | 11.0% | 9.0% | 1.9% |
| 14 | Muscatine | 23,489 | 5,418 | 70.5% | 3.6% | 20.4% | 0.9% |
| 15 | Johnston | 24,384 | 5,943 | 75.9% | 10.6% | 2.7% | 7.3% |
| 16 | Fairfield | 9,456 | 5,955 | 76.0% | 3.9% | 4.7% | 11.7% |
| 17 | Waukee | 29,236 | 5,972 | 76.4% | 5.1% | 5.9% | 6.5% |
| 18 | Ames | 67,669 | 6,047 | 76.8% | 3.8% | 5.1% | 9.3% |
| 19 | Sheldon | 5,474 | 6,085 | 76.0% | 2.6% | 17.1% | 1.3% |
| 20 | West Des Moines | 71,083 | 6,111 | 77.4% | 5.0% | 6.5% | 6.3% |
| 21 | Cedar Rapids | 137,264 | 6,144 | 77.5% | 8.5% | 5.2% | 2.6% |
| 22 | Webster City | 7,769 | 6,154 | 76.5% | 1.2% | 17.0% | 3.7% |
| 23 | Clive | 19,012 | 6,301 | 78.2% | 2.9% | 12.8% | 4.3% |
| 24 | Mount Pleasant | 8,951 | 6,356 | 78.9% | 4.7% | 9.5% | 1.7% |
| 25 | North Liberty | 21,125 | 6,390 | 79.2% | 4.0% | 6.5% | 4.2% |
| 26 | Urbandale | 46,595 | 6,413 | 79.4% | 4.8% | 7.2% | 4.9% |
| 27 | Fort Dodge | 24,827 | 6,461 | 79.6% | 4.6% | 8.9% | 1.5% |
| 28 | Bettendorf | 39,647 | 6,574 | 80.4% | 2.5% | 5.6% | 7.0% |
| 29 | Tiffin | 5,737 | 6,592 | 80.7% | 4.1% | 3.4% | 2.4% |
| 30 | Burlington | 23,728 | 6,642 | 80.9% | 6.6% | 4.8% | 1.5% |
| 31 | Windsor Heights | 5,143 | 6,709 | 81.4% | 5.6% | 4.3% | 4.7% |
| 32 | Grimes | 16,366 | 6,750 | 81.6% | 6.2% | 5.3% | 4.6% |
| 32 | Council Bluffs | 62,586 | 6,749 | 81.2% | 2.7% | 11.6% | 1.1% |
| 34 | Le Mars | 10,640 | 6,766 | 81.3% | 5.5% | 10.8% | 0.0% |
| 35 | Altoona | 21,495 | 6,771 | 81.7% | 5.1% | 6.5% | 2.1% |
| 36 | Estherville | 5,839 | 6,907 | 82.0% | 2.0% | 13.4% | 0.3% |
| 37 | Sioux Center | 8,454 | 7,098 | 83.3% | 0.6% | 12.8% | 1.2% |
| 38 | Clarinda | 5,353 | 7,142 | 84.1% | 4.2% | 3.3% | 1.5% |
| 39 | Bondurant | 8,560 | 7,186 | 84.3% | 5.5% | 6.2% | 1.5% |
| 40 | Nevada | 6,983 | 7,232 | 84.4% | 0.5% | 9.3% | 0.1% |
| 41 | Mason City | 27,050 | 7,281 | 84.9% | 2.9% | 7.0% | 1.3% |
| 42 | Dubuque | 59,174 | 7,333 | 85.3% | 4.1% | 3.0% | 1.5% |
| 43 | Pleasant Hill | 11,136 | 7,340 | 85.3% | 3.9% | 6.7% | 1.6% |
| 44 | Cherokee | 5,154 | 7,368 | 85.3% | 0.3% | 8.1% | 0.8% |
| 45 | Washington | 7,290 | 7,372 | 85.0% | 0.7% | 11.9% | 0.0% |
| 46 | Charles City | 7,232 | 7,385 | 85.6% | 1.9% | 5.8% | 3.2% |
| 47 | Clinton | 24,322 | 7,387 | 85.6% | 5.3% | 4.8% | 0.5% |
| 48 | Ankeny | 72,615 | 7,394 | 85.7% | 2.5% | 5.1% | 3.5% |
| 49 | Orange City | 6,426 | 7,407 | 85.5% | 1.2% | 9.4% | 0.4% |
| 50 | Grinnell | 9,505 | 7,471 | 86.1% | 1.6% | 3.1% | 3.9% |
| 51 | Newton | 15,700 | 7,482 | 86.1% | 1.5% | 5.7% | 0.1% |
| 52 | Keokuk | 9,662 | 7,490 | 86.2% | 3.2% | 5.3% | 0.4% |
| 53 | Adel | 6,430 | 7,496 | 86.2% | 0.9% | 6.0% | 0.0% |
| 54 | Algona | 5,377 | 7,522 | 86.1% | 0.2% | 10.0% | 0.5% |
| 55 | Marion | 41,896 | 7,644 | 87.2% | 2.6% | 2.8% | 2.1% |
| 56 | Sergeant Bluff | 5,171 | 7,652 | 87.1% | 0.9% | 3.2% | 7.2% |
| 57 | Fort Madison | 10,133 | 7,767 | 87.9% | 3.5% | 4.8% | 0.6% |
| 58 | Anamosa | 5,629 | 7,816 | 88.1% | 6.0% | 1.6% | 1.3% |
| 59 | Iowa Falls | 5,038 | 7,857 | 88.2% | 1.8% | 8.5% | 0.5% |
| 60 | Red Oak | 5,510 | 7,904 | 88.7% | 3.0% | 0.6% | 2.0% |
| 61 | Eldridge | 6,818 | 7,981 | 89.0% | 0.9% | 6.8% | 1.4% |
| 62 | Waverly | 10,494 | 7,998 | 89.3% | 2.4% | 3.6% | 1.5% |
| 63 | Oskaloosa | 11,504 | 8,031 | 89.5% | 1.7% | 2.8% | 1.6% |
| 64 | Maquoketa | 6,075 | 8,045 | 89.5% | 2.3% | 1.0% | 0.0% |
| 65 | Centerville | 5,372 | 8,049 | 89.5% | 1.0% | 4.4% | 1.5% |
| 66 | Decorah | 7,535 | 8,101 | 89.8% | 1.1% | 3.8% | 1.3% |
| 67 | Carroll | 10,208 | 8,106 | 89.8% | 0.8% | 4.2% | 0.4% |
| 68 | Spirit Lake | 5,518 | 8,110 | 89.8% | 0.1% | 3.7% | 0.2% |
| 69 | Spencer | 11,400 | 8,210 | 90.4% | 0.4% | 5.6% | 0.9% |
| 70 | Cedar Falls | 40,888 | 8,226 | 90.6% | 1.4% | 2.2% | 3.2% |
| 71 | Glenwood | 5,144 | 8,262 | 90.6% | 0.2% | 7.5% | 0.0% |
| 72 | Manchester | 5,191 | 8,360 | 91.2% | 0.2% | 4.2% | 0.0% |
| 73 | Boone | 12,424 | 8,390 | 91.4% | 1.3% | 3.8% | 0.1% |
| 74 | Oelwein | 5,834 | 8,422 | 91.6% | 0.1% | 1.3% | 0.9% |
| 75 | Indianola | 16,044 | 8,442 | 91.8% | 1.0% | 2.9% | 0.9% |
| 76 | Asbury | 5,989 | 8,455 | 91.8% | 2.6% | 0.5% | 4.5% |
| 77 | Creston | 7,435 | 8,518 | 92.2% | 0.9% | 3.7% | 1.2% |
| 78 | Norwalk | 14,183 | 8,596 | 92.6% | 0.1% | 3.0% | 1.2% |
| 79 | Knoxville | 7,473 | 8,672 | 93.0% | 0.3% | 1.9% | 1.5% |
| 80 | Atlantic | 6,763 | 8,732 | 93.4% | 1.7% | 3.1% | 0.4% |
| 81 | Pella | 10,720 | 8,785 | 93.7% | 0.4% | 3.2% | 1.3% |
| 82 | Independence | 6,164 | 8,847 | 94.0% | 1.3% | 1.9% | 0.4% |
| 83 | Winterset | 5,416 | 8,893 | 94.2% | 1.4% | 2.4% | 0.0% |
| 84 | Clear Lake | 7,607 | 8,995 | 94.8% | 0.2% | 2.2% | 1.7% |
| 85 | Polk City | 6,037 | 9,263 | 96.2% | 0.2% | 2.5% | 0.0% |
Source: U.S. Census ACS 2020-2024. 85 cities with more than 5,000 residents.
Summary
Summary: Diversity Across Iowa
If you’re looking for a scientific breakdown of diversity across Iowa, this is an accurate list.
The most diverse cities in Iowa are Storm Lake, Marshalltown, Des Moines, Denison, Sioux City, Waterloo, Coralville, Perry, Ottumwa, and Osceola.


